

Investment Thesis
Visa grew fiscal Q4 net revenue 13% and raised its dividend 16%, but client incentives are growing faster than revenue, costs grew as fast as sales, free cash flow rose only 2% on 17% GAAP profit growth, and the guide for fiscal 2027 points to slower growth.
- Earnings. Net revenue was $12,139M (+13%) and non-GAAP EPS was $3.48 (+17%) against $3.44 expected (TIKR). GAAP EPS was $3.19 (+22%). For the year, net revenue was $45,903M (+15%) and non-GAAP EPS $13.27 (+16%).
- Incentives. Client incentives, a deduction from revenue, rose 21% to $5,123M. Gross revenue before them grew about 15%, and incentives took roughly 39% of the increase (derived from rounded growth rates).
- No operating leverage. Non-GAAP operating expenses rose 12% in Q4 and 16% for the year. Non-GAAP operating margin was about 66.6% against 66.3% in Q4, and 67.5% against 67.7% for the year (derived). Fiscal 2027 guidance has both revenue and expenses growing at low double-digit rates.
- Cash flow. Non-GAAP net income rose 12% and GAAP net income 17%, but operating cash flow rose 3% to $23,728M and free cash flow 2% to $22,057M (derived). Cash taxes rose 25% and a $2,040M reduction in accrued litigation cut operating cash flow.
- Shareholder returns. Buybacks of $20,451M and dividends of $5,112M total $25,563M, 116% of free cash flow (derived). Cash and investments fell 29% and equity fell 5% (derived).
- Cross-border. Cross-border volume rose 14% in constant dollars in Q4 (13% nominal), while international transaction revenue rose only 8%. For the year, nominal cross-border volume rose 16% against 8% for the revenue line.
- Adjustments. Non-GAAP EPS excludes $1,724M of pre-tax litigation provisions for the year (about $0.70 a share after tax, derived), after $2,533M the year before. GAAP EPS growth of 21% for the year is higher than non-GAAP growth of 16% because those provisions fell.
- Stock. It was at $402 on Oct 27 and about 1.4% lower in extended trading after the report (TIKR). At $402 it is about 30x fiscal 2026 non-GAAP EPS, and about 27x on the fiscal 2027 guide (derived).
- This article contains no price target or rating. Every figure comes from Visa's release or a named source, and anything I calculated is marked.
Source: Visa fiscal fourth quarter and full year 2026 earnings release, Exhibit 99.1 to Form 8-K, Oct 27, 2026.
Q4 FY2026 At A Glance
Net revenue grew 13% and non-GAAP EPS grew 17%, while payments volume grew 9% and processed transactions grew 10%.
| Metric (fiscal Q4, quarter ended Sept 30) | Q4 FY26 | Q4 FY25 | Change |
|---|---|---|---|
| Net revenue | $12,139M | $10,724M | +13% |
| Service revenue | $5,255M | n/a | +14% |
| Data processing revenue | $6,245M | n/a | +16% |
| International transaction revenue | $4,115M | n/a | +8% |
| Other revenue | $1,647M | n/a | +40% |
| Client incentives (deduction) | $5,123M | n/a | +21% |
| Operating expenses (GAAP / non-GAAP) | $4,877M / $4,051M | $4,576M / $3,611M | +7% / +12% |
| Operating income (GAAP) | $7,262M | $6,148M | +18% (d) |
| Operating margin (GAAP) | 59.8% | 57.3% | +2.5 pts (d) |
| Net income (GAAP / non-GAAP) | $6,002M / $6,552M | $5,090M / $5,803M | +18% / +13% |
| Diluted EPS (GAAP / non-GAAP) | $3.19 / $3.48 | $2.62 / $2.98 | +22% / +17% |
| Payments volume (constant dollars) | $4.1T | n/a | +9% |
| Processed transactions | 74.2B | n/a | +10% |
| Diluted Class A shares | 1,882M | 1,945M | -3.2% (d) |
(d) = derived. The release does not give prior-year dollar values for the revenue lines. Sources: Visa Q4 FY2026 earnings release; Zacks for payments volume in dollars.
What The Market Believes vs. What The Data Actually Shows
Visa beat estimates and raised its dividend, yet the stock slipped after hours because incentives and costs grew and the fiscal 2027 outlook was modest.
| Item | Result or guide | Comparison |
|---|---|---|
| Non-GAAP EPS | $3.48 | $3.44 expected (TIKR), +$0.04; Zacks says +1.5% |
| Net revenue | $12.1B | Beat by about 0.5% (Zacks) |
| Client incentives | +21% | Faster than net revenue (+13%) |
| Q1 FY27 net revenue and operating expenses | Low double-digit growth | Adjusted, constant dollars; Q1 EPS growth at the low end of the mid-teens (Zacks) |
| FY27 net revenue and operating expenses | Low double-digit growth | Versus +15% and +16% (non-GAAP) in FY26 |
| FY27 non-GAAP EPS growth | Low double digits to low teens | Versus +16% in FY26 (Zacks, TIKR) |
| Quarterly dividend | $0.78 per Class A share | Raised 16% from about $0.67 (derived); payable Dec 1 |
Price reaction: TIKR reports Visa at $402 as of Oct 27 and about 1.4% lower in extended trading after the report, citing Reuters. I could not confirm the next-day close. TIKR attributes the slip to rising incentives and operating expenses and a modest outlook. It notes that about 25% of payments volume is up for client renewal in 2027, against 20% in 2026, including several large clients. The CFO said renewals help secure long-term client relationships (as reported by TIKR).
Sources: Visa earnings release; TIKR; Zacks.
Forensic #1: Client Incentives Grew 21% And Took About 39% Of Gross Revenue Growth
Visa's reported net revenue is what remains after paying clients to issue and use its products.
| Q4 FY26 revenue build | Amount | Growth |
|---|---|---|
| Service revenue | $5,255M | +14% |
| Data processing revenue | $6,245M | +16% |
| International transaction revenue | $4,115M | +8% |
| Other revenue | $1,647M | +40% |
| Revenue before incentives | $17,262M (d) | about +15% (d) |
| Client incentives | -$5,123M | +21% |
| Net revenue | $12,139M | +13% |
(d) = derived. Prior-year values are backed out from the rounded growth rates, so the 15% and 39% figures are approximate. Source: Visa Q4 FY2026 earnings release.
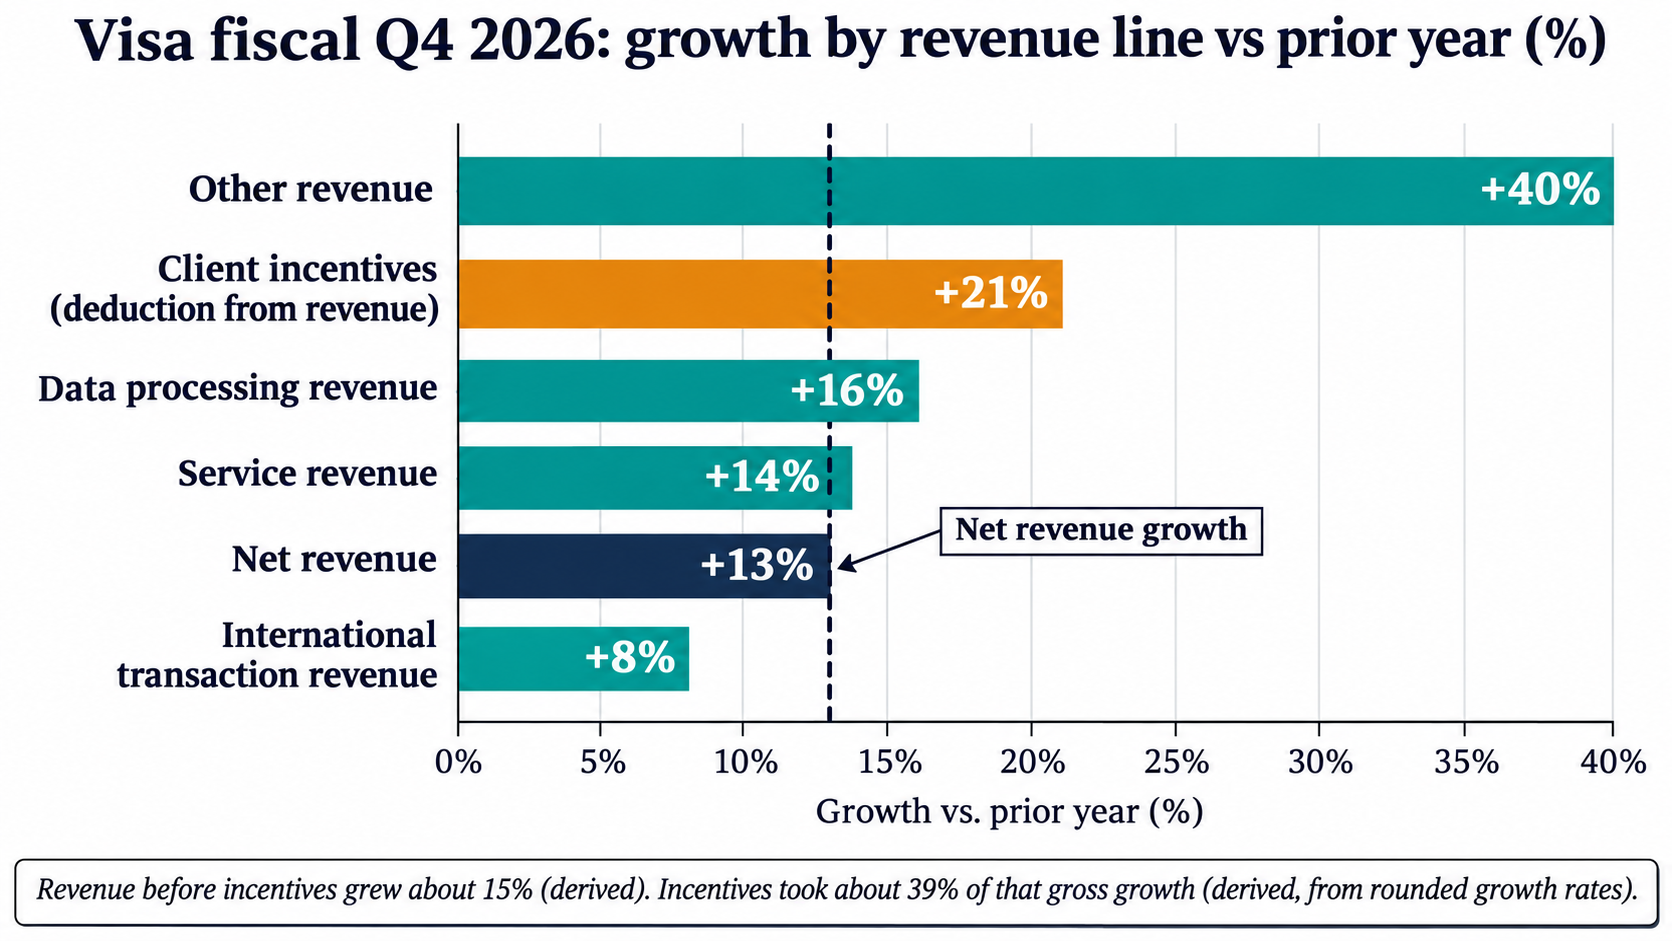
Fiscal Q4 2026 Growth By Revenue Line vs Fiscal Q4 2025 (Self-Made)
Incentives were about 29.7% of revenue before incentives in Q4, against about 28.3% a year ago, and 28.5% for the full year (derived). For the year they rose 16% to $18,317M. Visa's prepaid client incentive assets, current and non-current, rose 17% to $8,590M, and the current incentive liability rose 17% to $12,150M (derived).
The fastest-growing line is Other revenue, up 40% to $1,647M, 14% of net revenue (derived). The release extract I read does not break it down. Data processing revenue grew 16% against 10% growth in processed transactions, and service revenue grew 14%, based on payments volume of the previous quarter, which rose 10%.
Sources: Visa Q4 FY2026 earnings release.
Forensic #2: Costs Grew As Fast As Revenue, And Fiscal 2027 Guides The Same
Visa's non-GAAP operating margin has stopped expanding.
| Non-GAAP view | Q4 FY26 | Q4 FY25 | FY26 | FY25 |
|---|---|---|---|---|
| Net revenue | $12,139M | $10,724M | $45,903M | $40,000M |
| Non-GAAP operating expenses | $4,051M | $3,611M | $14,919M | $12,906M |
| Expense growth | +12% | +16% | ||
| Revenue growth | +13% | +15% | ||
| Non-GAAP operating margin | 66.6% (d) | 66.3% (d) | 67.5% (d) | 67.7% (d) |
(d) = derived: net revenue minus non-GAAP operating expenses, divided by net revenue. This is my measure, not a company figure. Source: Visa Q4 FY2026 earnings release.
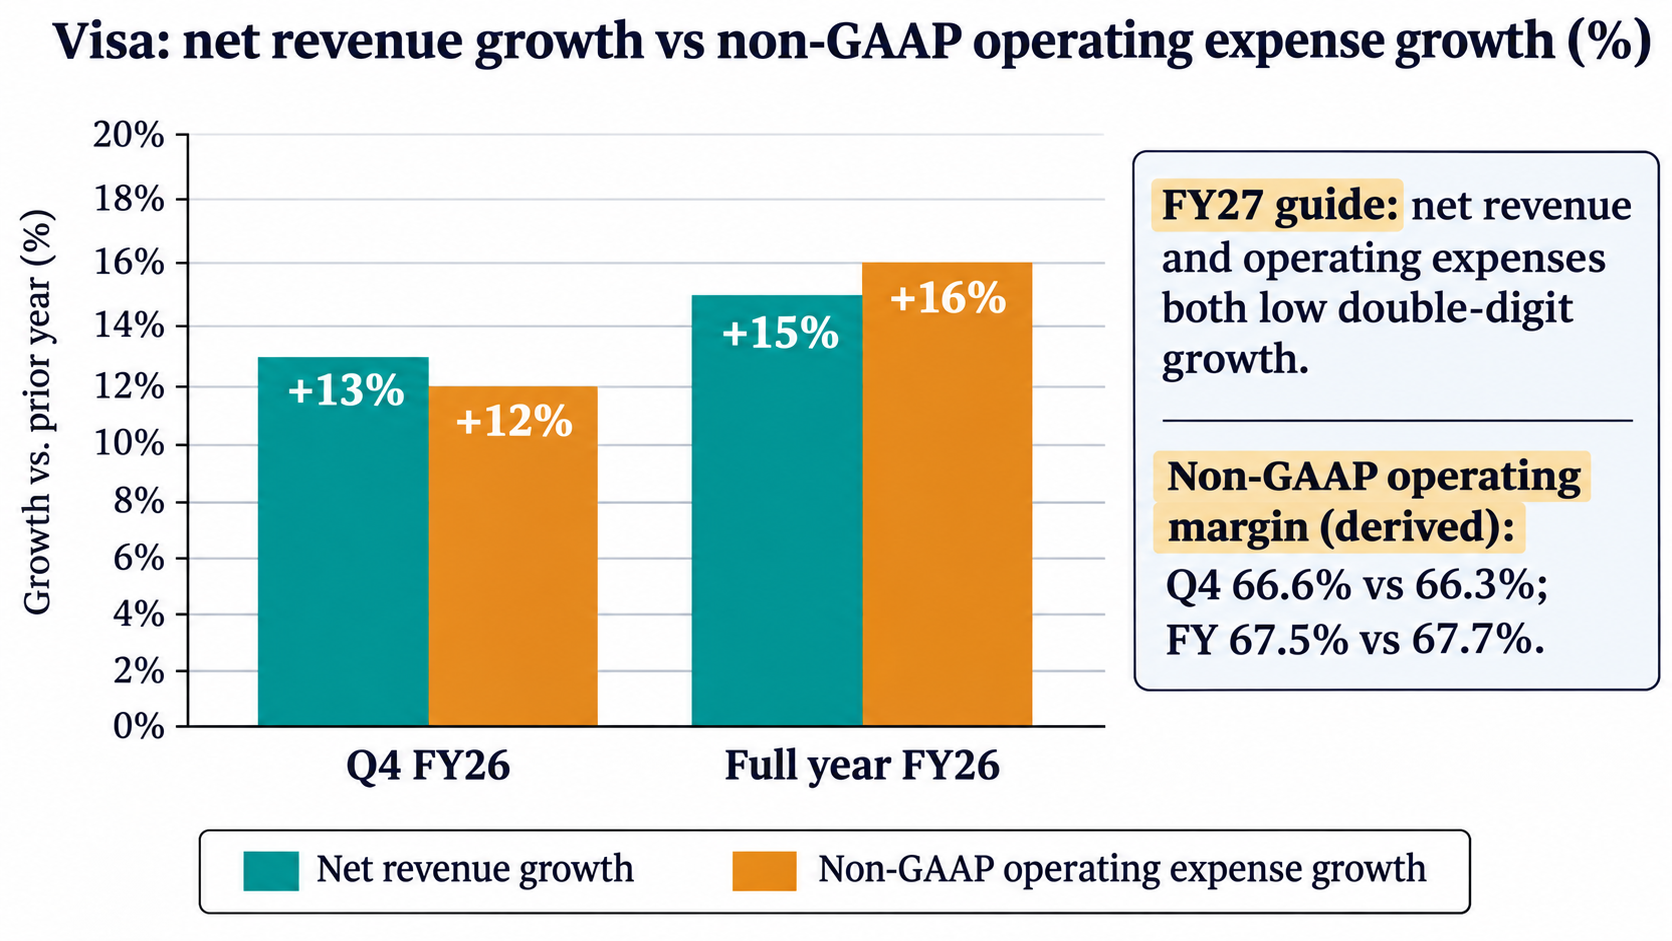
Net Revenue Growth vs Non-GAAP Operating Expense Growth, Q4 And Full Year FY2026 (Self-Made)
The cost lines that grew fastest in Q4 on a GAAP basis were marketing (+23%, $711M against $576M), professional fees (+26%) and general and administrative (+52%), the last including a $282M non-cash charitable contribution to the Visa Foundation that the non-GAAP view excludes. For the year, personnel rose 14% to $7,934M, marketing rose 37% to $2,315M and severance reached $563M against $213M. Personnel cost in the June quarter was $2,458M against $1,841M and $1,871M in the quarters around it, and the release does not explain the spike.
The gap between GAAP and non-GAAP operating expenses in Q4 is $826M, 17% of GAAP expenses (derived), made up of $469M of litigation, $282M of charitable contribution, $61M of amortization and $14M of acquisition costs. For the year the gap is $2,874M, 16% (derived).
Fiscal 2027 guidance has net revenue and operating expenses both growing at low double-digit rates, adjusted and in constant dollars, with EPS growth in the low double digits to low teens (Zacks, TIKR; the release does not include an outlook). That points to a flat margin again, with EPS growth coming from buybacks. Diluted Class A shares fell 3.2% in Q4 (derived), which accounts for about three to four of the 17 points of non-GAAP EPS growth.
Sources: Visa Q4 FY2026 earnings release; Zacks; TIKR.
Forensic #3: Net Income Rose 17% But Free Cash Flow Rose 2%
Visa's profit growth did not turn into cash growth in fiscal 2026.
| Fiscal year | FY26 | FY25 | Change |
|---|---|---|---|
| Net income (GAAP) | $23,504M | $20,058M | +17% |
| Net income (non-GAAP) | $25,314M | $22,542M | +12% |
| Net cash from operating activities | $23,728M | $23,059M | +3% (d) |
| Capital expenditures | $1,671M | $1,482M | +13% (d) |
| Operating cash flow minus capex | $22,057M | $21,577M | +2% (d) |
| Cash paid for income taxes | $5,684M | $4,541M | +25% (d) |
| Change in accrued litigation (operating cash flow) | -$2,040M | +$1,303M | $3,343M swing (d) |
| Share repurchases | $20,451M | $18,316M | +12% (d) |
| Dividends paid | $5,112M | $4,634M | +10% (d) |
(d) = derived. Operating cash flow minus capex is my measure of free cash flow, not a company figure. Source: Visa Q4 FY2026 earnings release.
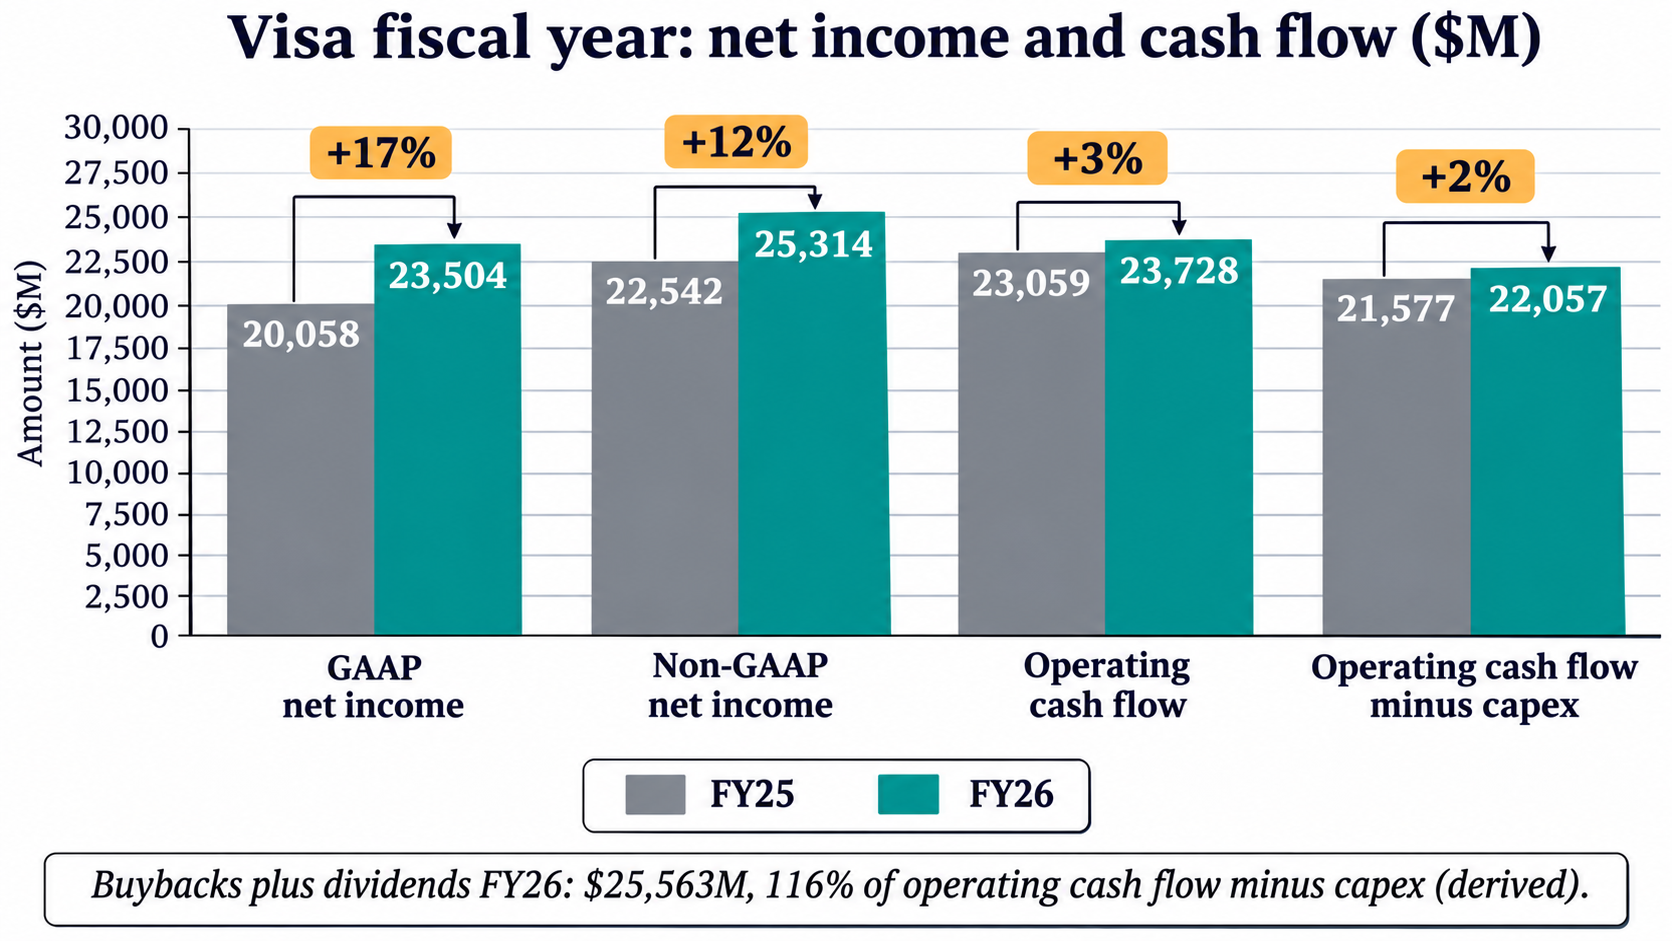
Fiscal 2026 Net Income, Operating Cash Flow And Free Cash Flow vs Fiscal 2025, $M (Self-Made)
Free cash flow was 87% of non-GAAP net income against 96% a year earlier, and 94% of GAAP net income against 108% (derived). The 25% rise in cash taxes and the $2,040M of litigation settlements paid out explain much of the gap, though the release extract does not attribute the figure line by line. Accrued litigation on the balance sheet fell to $990M from $3,033M, and the U.S. litigation escrow fell to $628M from $2,990M (derived changes of $2,043M and $2,362M). Zacks reports Q4 free cash flow of $6.9B after $493M of capex; the release does not report Q4 cash flow separately.
Buybacks and dividends came to $25,563M, 116% of free cash flow (derived). Visa repurchased about 61M Class A shares for $20.5B at an average of $335.49, with 11M shares for $4.0B at $369.12 in Q4. At $402 the stock is 20% above the average fiscal 2026 purchase price (derived). About $24.4B remains authorised. On Sept 18 Visa deposited $405M into the litigation escrow, which reduced as-converted Class B share counts at a weighted price of $366.81 and has the same per-share effect as a buyback, according to the release.
The return of more than free cash flow came out of the balance sheet. Cash and investment securities fell 29% to $14,177M and total debt fell 12% to $22,071M (derived). Total equity fell 5% to $36,111M. Goodwill and intangibles of $48,171M exceed equity, so equity less goodwill and intangibles is about -$12.1B against about -$9.6B (derived).
Sources: Visa Q4 FY2026 earnings release; Zacks.
Forensic #4: Cross-Border Volume Rose 14%, International Transaction Revenue Rose 8%
Visa's highest-yielding line is growing more slowly than the volume behind it.
| Growth versus prior year | Q4 FY26 | FY26 |
|---|---|---|
| Cross-border volume, constant dollars | +14% | +13% |
| Cross-border volume, nominal | +13% | +16% |
| Cross-border volume excluding intra-Europe, nominal | +14% | +15% |
| International transaction revenue | +8% | +8% |
| Payments volume, constant dollars | +9% | +9% |
| Processed transactions | +10% | +9% |
Source: Visa Q4 FY2026 earnings release. Revenue growth is nominal, so the nominal volume rows are the closer comparison.
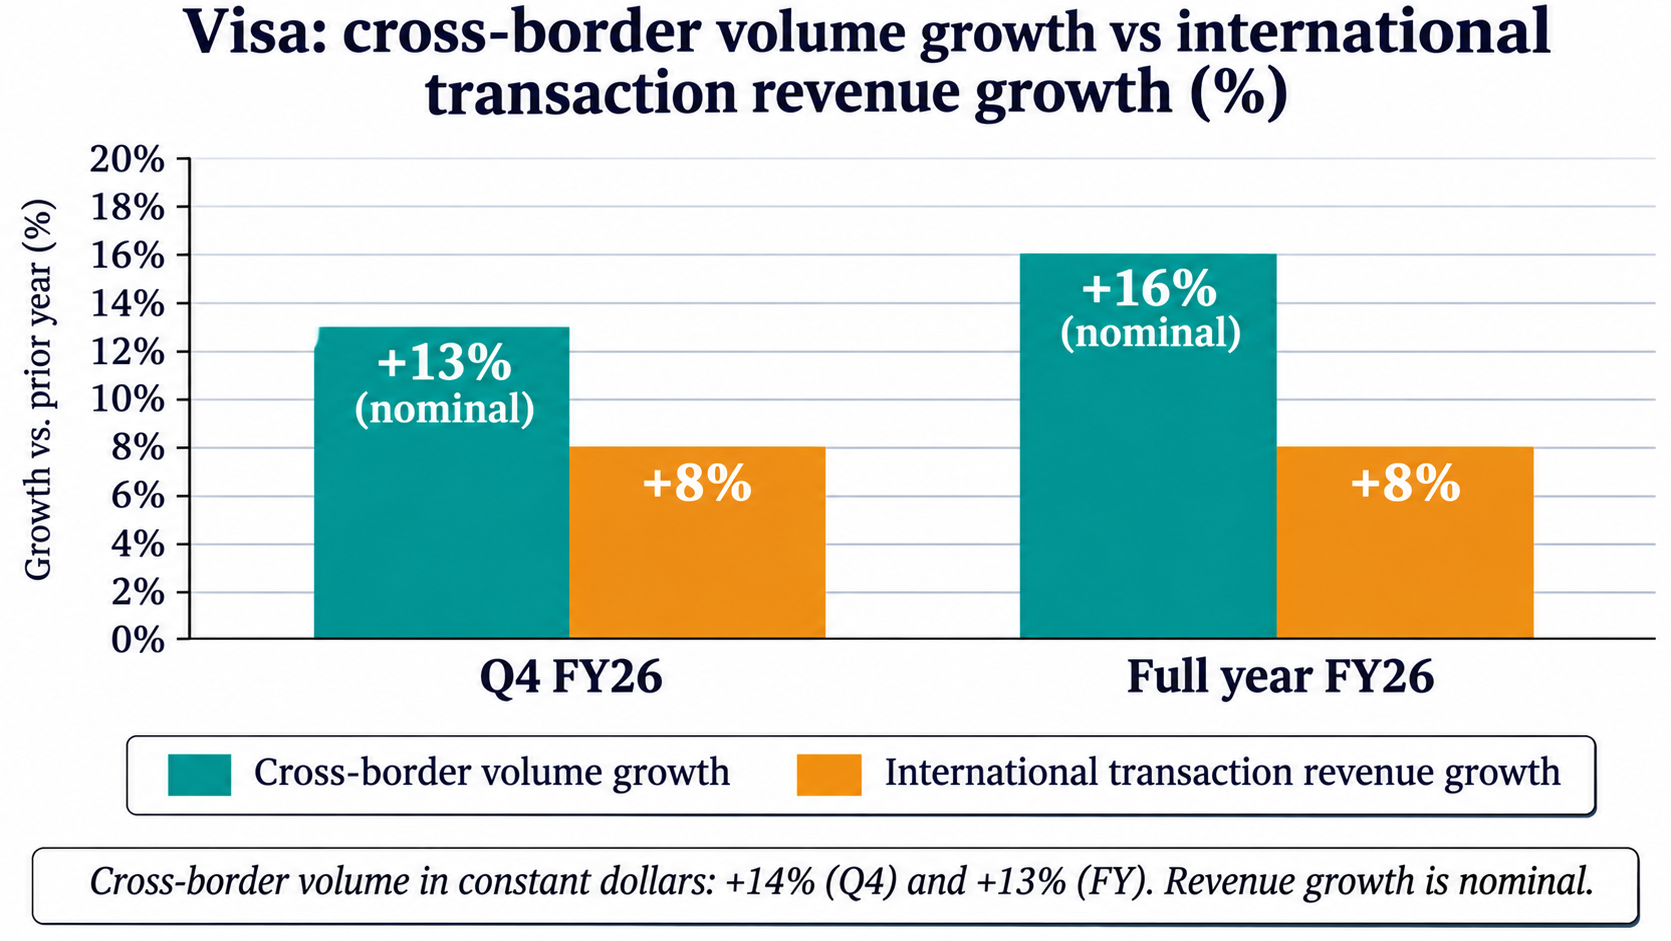
Cross-Border Volume Growth vs International Transaction Revenue Growth (Self-Made)
On nominal growth the gap between volume and revenue is about five to six points in Q4 and eight points for the year (derived). Revenue per dollar of cross-border volume fell about 4% to 5% in Q4 and about 7% for the year (derived from the rounded growth rates). The release extract I read does not explain the gap; candidates the sources suggest, such as a currency effect, mix between corridors or pricing, are not confirmed. For the year, the currency effect is large: cross-border volume excluding intra-Europe grew 12% in constant dollars and 15% nominal.
Management points to newer areas. FXC Intelligence reports that stablecoin settlement has passed an annualised $25B, ten times the year before, that more than 225 stablecoin-linked card programmes are live (+70%), and that nearly 50 AI partners are in production for agentic commerce. The CEO called the agentic and new money movement opportunity "very small" in the context of the 2027 business. These are call remarks as reported by one secondary source, and none is yet visible in the revenue lines.
Sources: Visa Q4 FY2026 earnings release; FXC Intelligence.
Valuation Snapshot
At $402, Visa traded at about 30x fiscal 2026 non-GAAP EPS and roughly 27x illustrative fiscal 2027 EPS.
| Measure | At $402 (Oct 27) | At about $396 (after hours) |
|---|---|---|
| Market capitalisation (1,882M diluted shares) | $757B | $746B |
| Price / FY26 non-GAAP EPS ($13.27) | 30.3x | 29.9x |
| Price / FY26 GAAP EPS ($12.32) | 32.6x | 32.2x |
| Price / FY27 EPS if non-GAAP EPS grows 10% to 13% | 27.5x to 26.8x | 27.2x to 26.4x |
| Free cash flow yield (FY26 $22.1B) | 2.9% | 3.0% |
| Buybacks plus dividends yield (FY26 $25.6B) | 3.4% | 3.4% |
| Dividend yield (new $0.78 quarterly rate) | 0.8% | 0.8% |
| Distance from 52-week high ($415) | -3.1% | n/a |
All ratios are derived. The FY27 row applies my assumption of 10% to 13% growth to FY26 non-GAAP EPS, as an illustration of "low double digits to low teens"; it is not company guidance for dollar EPS. The market cap uses weighted diluted Class A shares including as-converted classes. The after-hours price is $402 less the 1.4% move TIKR cites. The 52-week high is from TIKR and prices will have moved.
Risks: What Would Break The Thesis
The concern is that growth is slowing, costs are keeping pace, and the cash return is running ahead of cash generation.
- Incentive growth stays above revenue growth. About 25% of volume is up for renewal in 2027, and incentives took about 39% of gross revenue growth in Q4 (derived).
- No margin expansion. If revenue and expenses both grow at low double-digit rates, EPS growth depends on buybacks and tax.
- Litigation costs persist. Visa has excluded $2,533M and $1,724M of pre-tax litigation provisions from non-GAAP results in the last two years, and settlements paid reduced operating cash flow by $2,040M.
- Cash return above cash flow. At 116% of free cash flow, the return programme draws down cash and investments, which fell 29%.
- International yield. International transaction revenue growth of 8% against 13% to 16% nominal volume growth shows revenue is lagging volume.
- New payment methods. Stablecoin settlement and agentic commerce are small today, and I could not find a revenue figure for either.
- Valuation. About 30x non-GAAP EPS for low double-digit to low-teens growth leaves little room for a miss.
What To Watch Next
- Fiscal Q1 2027. Net revenue and expense growth against the low double-digit guide, and EPS at the low end of the mid-teens.
- Client incentives. Growth against net revenue growth and the outcome of the 2027 renewals.
- Operating margin. Whether non-GAAP expense growth falls below revenue growth.
- Cash conversion. Operating cash flow growth against net income growth, and litigation payments and escrow balances.
- International transaction revenue. Whether it grows closer to cross-border volume.
- BioCatch. The $2.4B cash acquisition announced Aug 3, expected to close by the end of fiscal Q2 2027.
- Dividend. The increase to $0.78 is payable Dec 1 to holders of record on Nov 10.
Sources And Data Notes
Financial figures come from Visa's fiscal Q4 and full-year 2026 earnings release (Exhibit 99.1 to Form 8-K), dated Oct 27, 2026. Fiscal Q4 is the quarter ended September 30, 2026. I did not read the Form 10-K or the call transcript. Prices are from Oct 27 and will have moved.
Primary sources
Secondary sources
- TIKR: EPS estimate, $402 price, after-hours move, renewals commentary, FY27 outlook, 52-week high
- Zacks: beat percentages, FY27 and Q1 outlook, payments volume in dollars, Q4 free cash flow
- FXC Intelligence: stablecoin and agentic commerce commentary, cross-border travel and e-commerce growth
Marked, not independently confirmed
- The fiscal 2027 outlook is not in the release extract I read. It comes from Zacks and TIKR, which agree on low double-digit net revenue and expense growth and differ slightly in how they describe EPS growth.
- The consensus EPS of $3.44 (TIKR) and an implied $3.43 (Zacks) differ by a cent.
- Stablecoin, agentic commerce and renewal commentary come from call summaries.
Where sources disagree
- Visa's own release shows litigation provisions of $469M in the text and reconciliation and $474M in the income statement for Q4 ($1,724M against $1,764M for the year). It does not explain the gap.
- Balance sheet cash plus the litigation escrow is $13,566M, while the cash flow statement ends at $19,118M including restricted cash. I could not reconcile the roughly $5.6B gap.
- Zacks reports Q4 free cash flow of $6.9B, which is not in the release extract.
Left out
- U.S. versus international payments volume, prior-year dollar values for each revenue line, and the Class B and preferred conversion terms, which the release extract does not give.
- Any closing price after Oct 27, which I could not confirm.
Derived figures are my arithmetic from the release and are marked (d), "derived" or "my arithmetic".

Sandeep Gupta
Independent equity research analyst publishing forensic theses on US-listed stocks. MBA, Politecnico di Milano School of Management (Milan, Italy).
Get new research in your inbox
Subscribe to receive forensic equity research the moment it's published. Free, no spam.
Related Research

Latest earnings releases: V
— Visa Reports Fiscal Fourth Quarter and Full-Year 2026 Results
Discussion
Be the first to comment.