
Investment Thesis
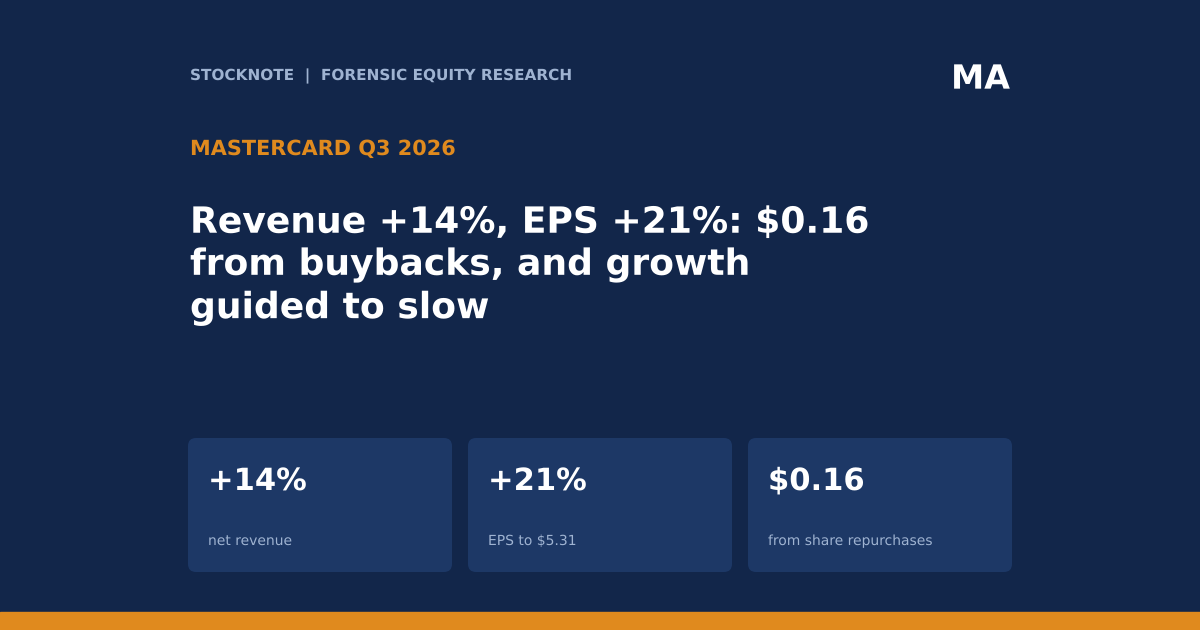
Mastercard grew net revenue 14% and EPS 21% to $5.31 in the third quarter, with value-added services growing 19%. The same call guided fourth-quarter revenue and expense growth to the same rate, the high end of low double digits, so the quarter's modest operating leverage is not guided to widen, and buybacks supplied $0.16 of the EPS.
- Earnings. Net revenue rose 14%, operating expenses 12%, operating income 15% and net income 18% (non-GAAP, currency-neutral). EPS rose 21% to $5.31.
- Mix. Payment network net revenue rose 11% and value-added services and solutions 19%. Acquisitions and dispositions added one point to operating expense growth.
- Pricing above volume. Domestic assessments rose 13%, cross-border 16% and transaction processing 14%, versus volume growth of about 7%, 11% and 9% (d, from the stated gaps of 6, 5 and 5 points).
- Volume. Worldwide gross dollar volume rose 7%, cross-border volume 11%, switched transactions 9%, and cards issued 5% to 3.8B.
- Buybacks. Repurchases were $3B in Q3 and $648M more through Oct 26. They contributed $0.16 to EPS, which is 17% of the $0.92 EPS increase (d).
- Outlook. Q4 net revenue and operating expense growth are both guided to the high end of low double digits, against 14% and 12% in Q3. Rebates and incentives as a share of gross assessments are expected to be higher in Q4 than in Q3.
- This article contains no price target or rating. Every figure comes from the executives' spoken remarks on the Q3 call or a named source, and anything I calculated is marked (d).
Bottom line. Mastercard remains an exceptionally profitable network, but the Q3 figures show earnings growth leaning on three things at once: pricing running 5 to 6 points ahead of volume, fast-growing value-added services, and about $3B a quarter of buybacks. The Q4 guide holds revenue and cost growth equal, so the next leg of EPS growth has to come from volume, services and repurchases, not margin expansion.
Source: Mastercard Q3 2026 earnings call transcript, Motley Fool, Oct 29, 2026.
Q3 2026 At A Glance
Every profit line grew faster than net revenue, but the revenue growth itself is guided to slow.
| Metric (Q3 2026, non-GAAP, currency-neutral) | Growth |
|---|---|
| Net revenue | +14% |
| Payment network net revenue | +11% |
| Value-added services and solutions net revenue | +19% |
| Operating expenses (includes +1 pt from acquisitions and dispositions) | +12% |
| Operating income | +15% |
| Net income | +18% |
| EPS | +21% to $5.31 |
| Worldwide gross dollar volume | +7% |
| Cross-border volume | +11% |
| Switched transactions | +9% |
| Cards issued | +5% (3.8B) |
| Share repurchases | $3B in Q3, $648M through Oct 26 |
| Contactless share of in-person switched purchases | 81%, up 5 pts |
Source: Mastercard Q3 2026 call transcript. The CFO gave growth rates; dollar amounts for revenue and expenses were not in the spoken remarks.
What The Market Believes vs. What The Data Actually Shows
| Item | Spoken figure | Context |
|---|---|---|
| Net revenue growth | +14% | Q4 and full year guided to the high end of low double digits |
| Operating expense growth | +12% | Q4 guided to the high end of low double digits, with a 1-point drag from acquisitions and dispositions |
| EPS growth | +21% | $0.16 from repurchases; ex-repurchase EPS would be about $5.15 (d) |
| Cross-border volume | +11% | Cross-border assessments +16% |
| Rebates and incentives | No growth rate given | Expected to be a higher share of gross assessments in Q4 |
| 2027 | No guidance | Management deferred to the next quarter |
The transcript gave no consensus estimates, so I make no beat or miss claim. The page's summary lists an adjusted operating margin of 60.5%, but that figure was not spoken, so I leave it out.
The usual framing is that payment networks compound at mid-teens with little cyclicality. Q3 fits that, but a guide to the high end of low double digits for both revenue and expenses means growth is slowing and operating leverage is flat, which is a different profile from the 14% and 21% headlines.
Forensic #1: Profit Lines Outgrew Revenue, Modestly
Operating income grew one point faster than revenue and net income four points faster, with the rest of the gap to EPS coming from a lower share count.
| Line | Growth | Gap to net revenue (d) |
|---|---|---|
| Net revenue | +14% | n/a |
| Operating expenses | +12% | -2 pts |
| Operating income | +15% | +1 pt |
| Net income | +18% | +4 pts |
| EPS | +21% | +7 pts |
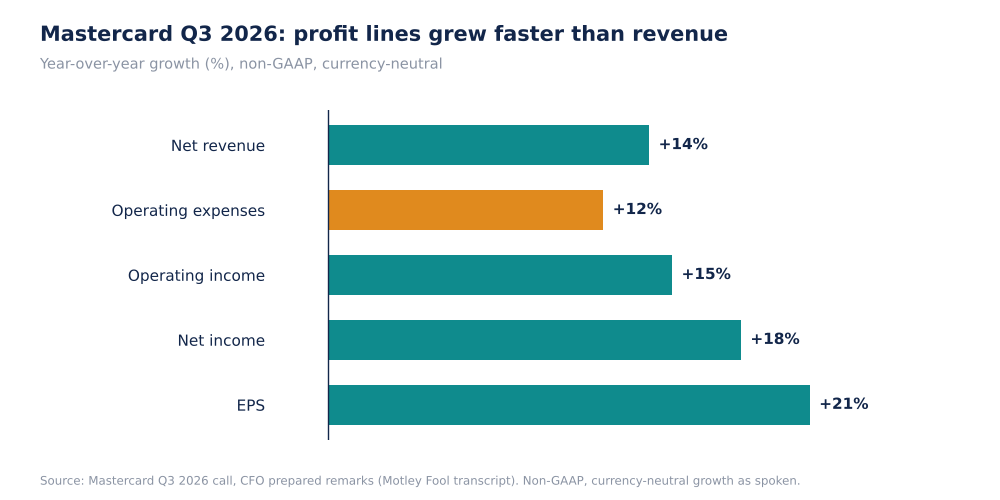
Mastercard Q3 2026 Growth In Revenue, Expenses, Operating Income, Net Income And EPS (Self-Made)
Operating income grew only one point faster than revenue even though expenses grew two points slower; the spoken remarks give no dollar figures, so I cannot say what share of revenue expenses represent. The gap between operating income (+15%) and net income (+18%) is not explained in the spoken remarks, so I do not attribute it.
Why it matters. The spread between operating income growth (15%) and net income growth (18%) arises below the operating line and the call did not explain it. The further spread to EPS growth (21%) is mostly share count. Investors should treat the 21% as a blend of about 15% operating growth and financial effects, not as the underlying growth rate.
Source: Mastercard Q3 2026 call transcript.
Forensic #2: Assessments Grew 5 To 6 Points Faster Than The Volume They Charge On
Mastercard's CFO gave the gaps between assessment growth and volume growth directly.
| Assessment line | Assessments | Gap to volume | Implied volume (d) |
|---|---|---|---|
| Domestic | +13% | 6 pts | about +7% |
| Cross-border | +16% | 5 pts | about +11% |
| Transaction processing | +14% | 5 pts | about +9% |
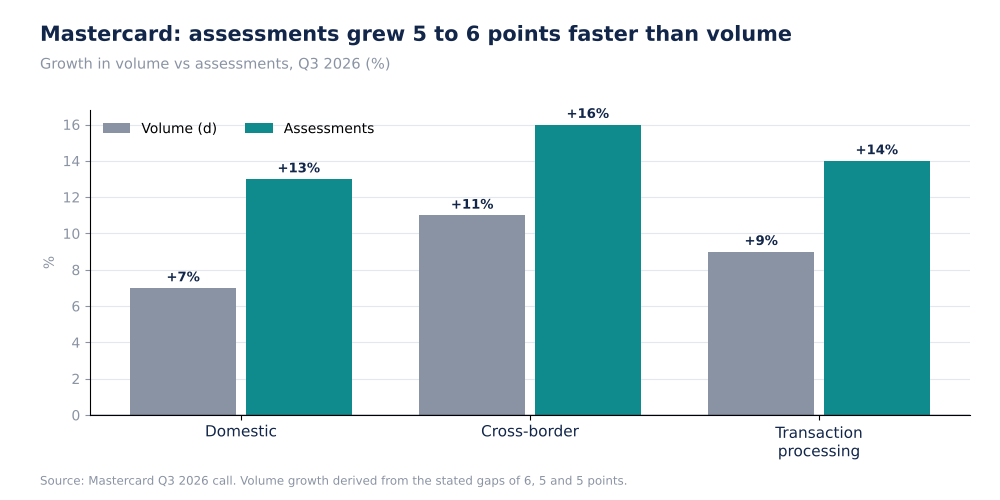
Mastercard Volume Growth vs Assessments Growth, Q3 2026 (Self-Made)
Implied volumes match the stated totals: gross dollar volume +7%, cross-border volume +11% and switched transactions +9%. The call does not state what drives the gaps, and the rebates and incentives that reduce net revenue are not quantified, so the gross-to-net picture is incomplete. Management said incentives would take a higher share of gross assessments in Q4.
For context, Visa reported fiscal Q4 cross-border volume up 13% (nominal) against international transaction revenue up 8%, the reverse relationship. The two companies define their revenue lines differently, so I do not compare them directly.
Why it matters. Assessments growing 5 to 6 points faster than volume is the mark of pricing, mix and new services, and it explains much of the revenue growth: worldwide volume rose 7% while net revenue rose 14%, so roughly half of the growth came from yield rather than volume (d, rough). That is attractive while it lasts, but management expects incentives to take a higher share of gross assessments in Q4, which trims how much of the yield reaches net revenue.
Source: Mastercard Q3 2026 call transcript; Visa figure from my earlier article on its Q4 FY2026 earnings release.
Forensic #3: Buybacks Supplied $0.16 Of EPS Growth
EPS rose 21% to $5.31. The CFO said repurchases contributed $0.16.
| EPS bridge | Amount |
|---|---|
| Q3 2025 EPS (d, from +21%) | about $4.39 |
| Net income growth and other (d) | about +$0.76 |
| Share repurchases | +$0.16 |
| Q3 2026 EPS | $5.31 |
| Repurchase share of the increase (d) | about 17% |
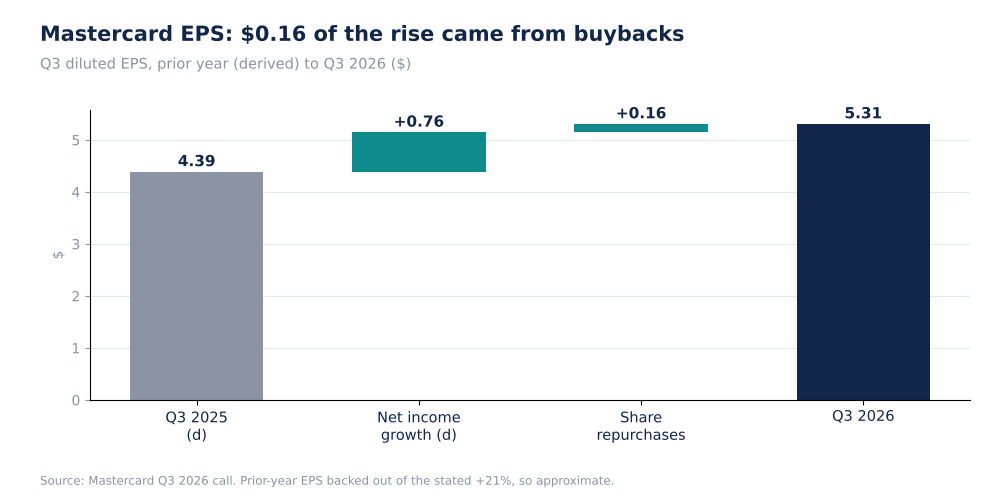
Mastercard Q3 EPS Bridge: Prior Year To Q3 2026, $ (Self-Made)
Repurchases were $3B in the quarter and $648M more through October 26. The page summary mentions $4.9B of remaining authorization, but the figure was not spoken, so I do not rely on it.
Why it matters. Buybacks add to EPS every quarter but do not add to operating profit. The $0.16 contribution equals about 3.6 points of the 21% EPS growth (d, against about $4.39 a year ago). Repurchases of about $3.65B since the quarter began show the pace is being maintained, and they are the part of EPS growth that depends on the share price staying at a level management is willing to buy at.
Source: Mastercard Q3 2026 call transcript. Prior-year EPS is derived from a rounded growth rate.
Forensic #4: The Outlook Slows Growth And Holds Costs
| Guide | Net revenue growth | Operating expense growth |
|---|---|---|
| Q3 2026 actual | +14% | +12% |
| Q4 2026 guide | high end of low double digits (FX headwind about 1 pt) | high end of low double digits (1-pt drag from acquisitions and dispositions; FX tailwind about 0.5 pt) |
| Full year 2026 guide | high end of low double digits (FX tailwind about 1 pt) | low double digits (FX headwind 0.5 to 1 pt) |
If revenue and expenses both grow at the same rate in Q4, operating leverage disappears, which is the pattern I flagged at Visa. Other income and expense is guided to an expense of about $115M, and the non-GAAP tax rate to 20% to 21%.
Why it matters. With revenue and expenses guided to the same growth rate, operating margin is flat in Q4. If revenue grows 12% to 13% and the repurchase effect adds 3 to 4 points, EPS growth would return toward the mid-teens (d, illustrative), well below the 21% in Q3. That is a fairer reference point for what the valuation should price than the Q3 headline.
Source: Mastercard Q3 2026 call transcript.
Valuation Snapshot
TradingView shows Mastercard at $638.01, up 0.36% on the day, within 0.6% of its all-time high of $641.57 set on Oct 29, the earnings date. Market cap is about $557.2B and dividend yield 0.55%.
| Measure | Figure |
|---|---|
| Share price (TradingView) | $638.01 |
| Market cap (TradingView) | about $557.2B |
| P/E, trailing (TradingView) | 31.9 |
| Price / annualised Q3 EPS of $21.24 (d) | about 30.0x |
| Annualised repurchases of $12B (d) | about 2.2% of market cap |
| Dividend yield (TradingView) | 0.55% |
The shares trade at a record after the report, so the market is paying about 30 times annualised EPS for growth that management has guided to slow to the high end of low double digits, with expenses growing at the same rate.
What has to be true. At about 30 times annualised EPS and a record price, the market is capitalising mid-teens EPS growth for a long time. The Q3 breakdown shows that growth is real but made up of pricing, services and buybacks. If incentives take a larger share or cross-border growth slows from 11%, the cushions are the 2.2% buyback yield and the 0.55% dividend yield.
Risks: What Would Break The Thesis
- Pricing above volume reverses. If assessments grow only with volume, revenue growth would fall below the high end of low double digits.
- Incentives rise faster. Management expects a higher share of gross assessments in Q4.
- Cross-border slows. It grew 11%, against 15% in Q3 2025 (local currency, per a Zacks article), so the comparison basis may differ.
- Data limits. I did not read the release or the 10-Q.
The most likely way for the thesis to be wrong is gradual slowing, not a collapse: volume growth easing, incentives taking more of gross revenue, and expense growth matching revenue. Each is visible in quarterly guidance, so investors get early warning.
What To Watch Next
- Rebates and incentives as a share of gross assessments in Q4.
- Operating expense growth against revenue growth after the Q4 guide.
- Value-added services growth against 19%.
- The 2027 guidance deferred to the next quarter.
- Cross-border volume growth against 11%.

Sandeep Gupta
Independent equity research analyst publishing forensic theses on US-listed stocks. MBA, Politecnico di Milano School of Management (Milan, Italy).
Get new research in your inbox
Subscribe to receive forensic equity research the moment it's published. Free, no spam.
Related Research


Latest earnings releases: MA
— Mastercard Incorporated Reports Third Quarter 2026 Financial Results
Discussion
Be the first to comment.