

Investment Thesis
Robinhood posted record revenue in Q3, but the profit lines moved the other way: revenue rose 12%, GAAP EPS fell 16%, and the next quarter's cost guide steps up sharply.
- Earnings. Net revenues were $1,424M (+12%). GAAP diluted EPS was $0.51 vs $0.61 (-16%). Adjusted EPS was $0.60 vs $0.62 (-3%), but above the $0.55 consensus. Adjusted EBITDA rose 9% to $808M, a 57% margin.
- Revenue mix. Event-contract revenue of $173M replaced almost exactly what crypto lost: roughly +$145M from event contracts and roughly -$147M from crypto, year over year (my arithmetic from rounded percentages). Net interest revenue fell 9% even as the margin book grew 59%.
- Costs and tax. Operating expenses rose 16% to $739M, led by operations (+139%) and provision for credit losses (+173%). The effective tax rate was 23.8% vs 12.3%. At last year's rate, Q3 EPS would have been about $0.59 (derived).
- Q4 cost step-up. Full-year adjusted operating expenses and SBC guidance of $2.675B to $2.75B implies $763M to $838M in Q4, 15% to 26% above Q3's $664M (derived).
- Balance sheet. Total assets rose 53% in nine months to $58.3B while equity rose 10% to $10.1B. Long-term borrowings went from nil to $2.66B.
- Stock. It closed at $94.56 on Oct 27 and fell 7.36% after hours to $87.60. That is about 37x annualised Q3 adjusted EPS and 13.9x annualised revenue (derived).
- This article contains no price target or rating. Every figure comes from Robinhood's release or a named source, and anything I calculated is marked.
Source: Robinhood Reports Third Quarter 2026 Results, Oct 27, 2026.
Q3 2026 At A Glance
Net revenues reached a record $1,424M, but pre-tax income fell 1% and net income attributable to Robinhood fell 16%.
| Metric (quarter ended Sept 30) | Q3 2026 | Q3 2025 | Change |
|---|---|---|---|
| Transaction-based revenues | $867M | $730M | +19% |
| Net interest revenues | $415M | $456M | -9% |
| Other revenues | $142M | $88M | +61% |
| Total net revenues | $1,424M | $1,274M | +12% |
| Total operating expenses | $739M | $639M | +16% |
| Income before income taxes | $625M | $634M | -1% |
| Provision for income taxes | $149M | $78M | +91% |
| Effective tax rate (d) | 23.8% | 12.3% | +11.5 pts |
| Net income attributable to Robinhood | $468M | $556M | -16% |
| Diluted EPS | $0.51 | $0.61 | -16% |
| Adjusted EPS | $0.60 | $0.62 | -3% |
| Adjusted EBITDA | $808M | $742M | +9% |
| Adjusted EBITDA margin | 57% | 58% | -1 pt |
| Funded customers | 28.7M | 26.8M (d) | +7% |
| Total platform assets | $396B | n/a | +19% |
| Net deposits | $15.7B | n/a | trailing 12 months $71.0B |
| Gold subscribers | 5.2M | 3.9M (d) | +34% |
(d) = derived: Funded customers rose by 1.9M and Gold subscribers by 1.3M per the release, so the Q3 2025 figures are the Q3 2026 figures minus those increases. The tax rate is provision for income taxes divided by income before income taxes. Source: Robinhood Q3 2026 results, Oct 27, 2026.
What The Market Believes vs. What The Data Actually Shows
The headline was a record quarter and an adjusted EPS beat ($0.60 vs $0.55). The shares still fell 7.36% after hours, and the GAAP and adjusted lines moved in opposite directions from Q2.
| Line | Q3 2025 | Q2 2026 | Q3 2026 |
|---|---|---|---|
| Diluted EPS (GAAP) | $0.61 | $0.62 | $0.51 |
| Adjusted EPS | $0.62 | $0.50 | $0.60 |
| Other income (expense), net | -$1M | +$135M | -$60M |
| Unrealized and realized losses (gains) removed from adjusted EBITDA | $0 | -$129M | +$67M |
| Effective tax rate (d) | 12.3% | 19.2% | 23.8% |
| Net margin | 44% | 44% | 33% |
| Adjusted EBITDA margin | 58% | 57% | 57% |
From Q2 to Q3, adjusted EPS rose 20% ($0.50 to $0.60) while GAAP EPS fell 18% ($0.62 to $0.51) (derived). Q2 GAAP profit included $129M of gains that adjusted figures removed; Q3 GAAP profit included $67M of losses, which the release says are $0.07 per diluted share, mainly from Robinhood Ventures Fund I. Adjusted EBITDA margin was steady at 57%, so the core earning power held; the gap between GAAP and adjusted comes from investment marks and tax.
Why the shares fell: Investing.com's summary of the call reports a slight revenue miss against consensus. On the call, management also said early Q4 spreads are a little tighter, which could pressure crypto and equity take rates. The sources I read do not give a single stated reason for the move.
(d) = derived. Sources: Robinhood Q3 2026 results; Investing.com call summary.
Forensic #1: Event Contracts Replaced Crypto, Dollar For Dollar
Transaction revenue rose $137M year over year, but event contracts added roughly $145M and crypto lost roughly $147M, so one speculative product offset the other.
| Transaction revenue line | Q3 2026 | YoY | Implied Q3 2025 (d) | Implied $ change (d) |
|---|---|---|---|---|
| Options | $399M | +31% | about $305M | about +$94M |
| Equities | $121M | +41% | about $86M | about +$35M |
| Event contracts | $173M | over 6x | under $29M | over +$144M |
| Cryptocurrencies | $120M | -55% | about $267M | about -$147M |
| All transaction-based revenue | $867M | +19% | $730M | +$137M |
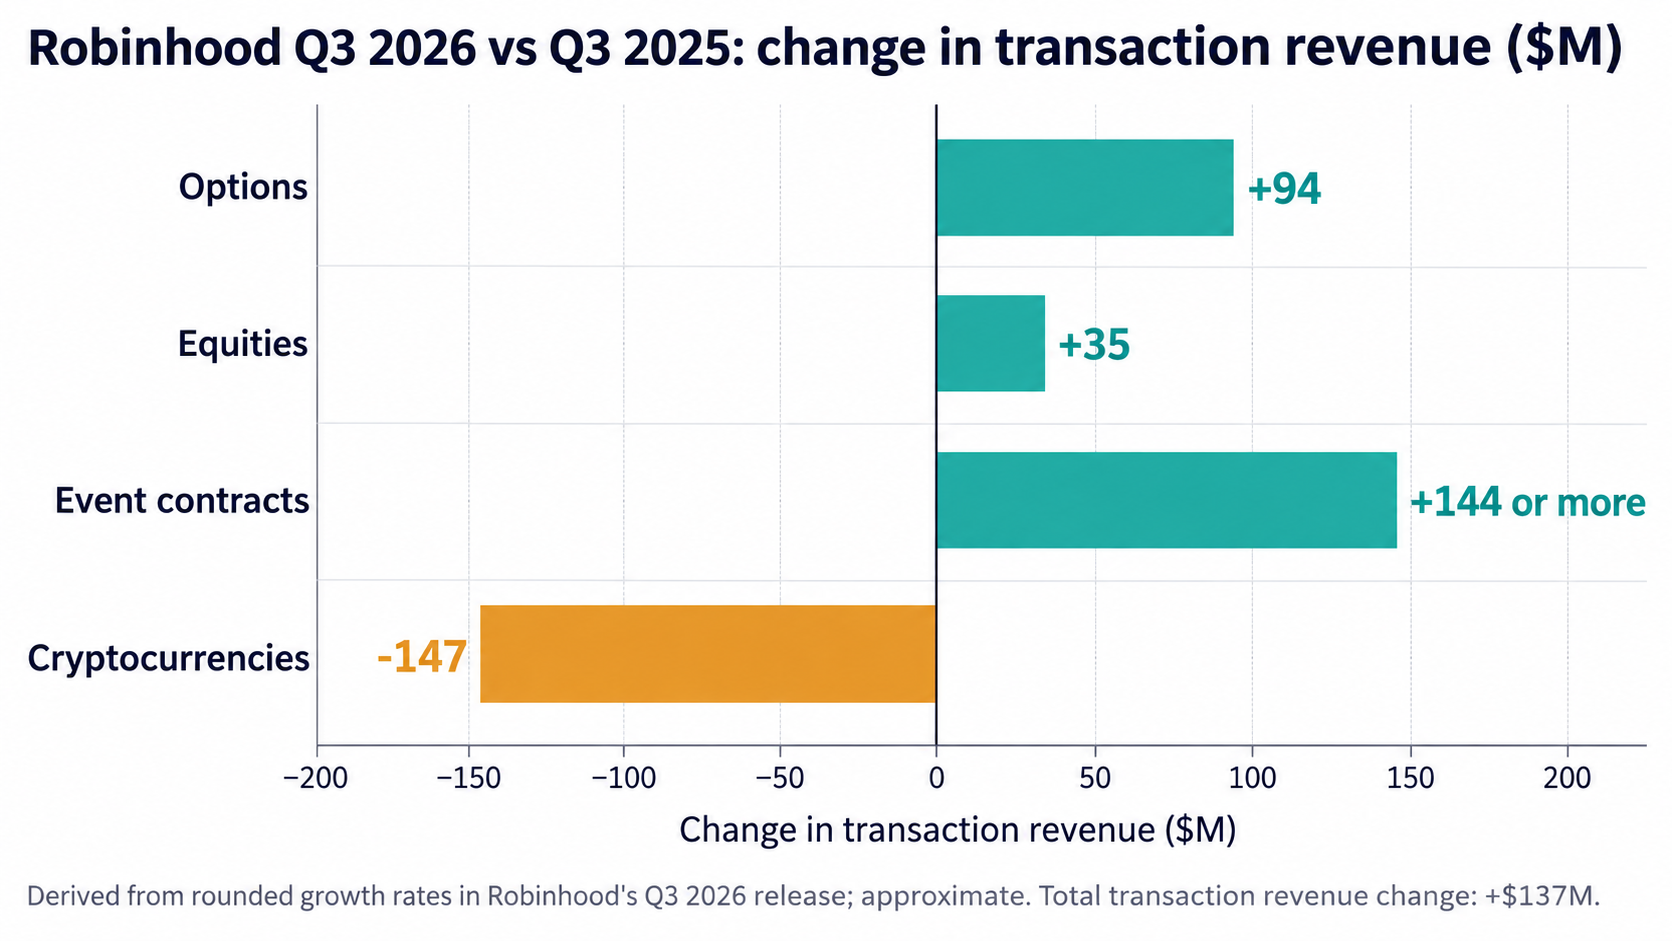
Q3 2026 Transaction Revenue Change vs Q3 2025 by Product (Self-Made)
Event contracts were 12.1% of Q3 revenue and crypto 8.4% (derived). Volumes tell the same story: 16.4B event contracts traded (over 7x), crypto notional volume of $50B (-38%), equity notional volume of $992B (+53%) and 905M options contracts (+48%).
What management said about take rates: CFO Shiv Verma attributed the crypto revenue drag mainly to the Robinhood Earn stablecoin product (over $500M in assets, lower monetization) and said that excluding it, crypto was similar to the prior quarter. Early in Q4, equities, options and crypto average daily volumes were about 5% below Q3, event-contract volumes were up about 10%, and spreads were slightly tighter, which management flagged as a possible take-rate headwind.
(d) = my arithmetic from the release's rounded growth rates, so each implied figure is approximate to within a few $M. "Over 6x" gives an upper bound for Q3 2025 event-contract revenue of $173M / 6 = $28.8M. Sources: Robinhood Q3 2026 results; Motley Fool call transcript.
Forensic #2: Costs Grew Faster Than Revenue, And The Tax Rate Doubled
Operating expenses rose 16% against revenue growth of 12%, and a 12% to 24% jump in the tax rate explains most of the GAAP EPS decline.
| Expense line ($M) | Q3 2026 | Q3 2025 | YoY | % of Q3 2026 revenue (d) |
|---|---|---|---|---|
| Brokerage and transaction | 68 | 56 | +21% | 4.8% |
| Technology and development | 254 | 237 | +7% | 17.8% |
| Operations | 79 | 33 | +139% | 5.5% |
| Provision for credit losses | 71 | 26 | +173% | 5.0% |
| Marketing | 104 | 102 | +2% | 7.3% |
| General and administrative | 163 | 185 | -12% | 11.4% |
| Total operating expenses | 739 | 639 | +16% | 51.9% |
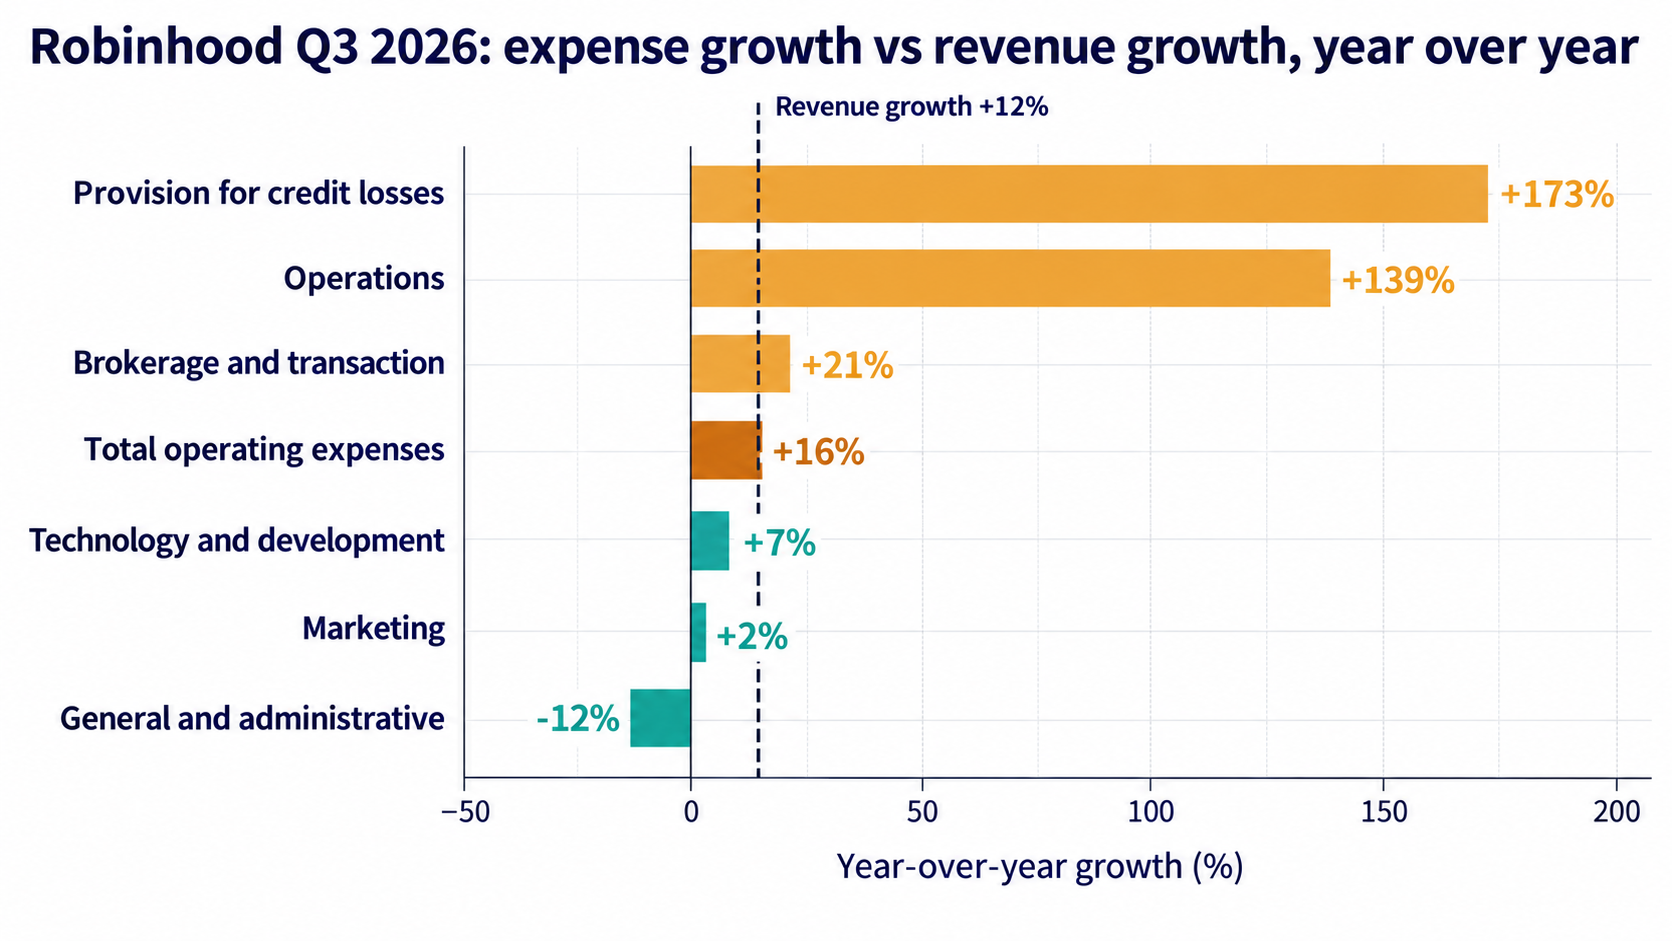
Q3 2026 Expense Line Growth vs Revenue Growth of 12% (Self-Made)
Provision for credit losses was 5.0% of revenue against 2.0% a year ago (derived), alongside growth in the credit card book: Gold Card customers reached 1.3M with over $19B of annualised payment volume, and the Credit Card Funding Trust borrowed $757M in the nine months. G&A was the one line that fell, and was $36M below Q2's $199M.
The tax effect. Pre-tax income fell only 1%, yet net income attributable fell 16%. The effective tax rate was 23.8% against 12.3% a year earlier. Applying last year's rate to this quarter's $625M of pre-tax income gives about $548M of net income, or roughly $0.59 of diluted EPS after non-controlling interests, against the reported $0.51 (derived, illustrative). That means about $0.08 of the $0.10 GAAP EPS decline comes from the tax rate. The release excerpt I read does not explain the change in the rate; the Form 10-Q should.
Sources: Robinhood Q3 2026 results; Motley Fool call transcript. Percentages of revenue and the tax illustration are my arithmetic.
Forensic #3: Net Interest Fell 9% While The Balance Sheet Grew 53%
The margin book grew 59% and total assets grew 53% in nine months, yet net interest revenue fell 9%, and equity grew only 10%.
| Balance sheet ($M) | Dec 31, 2025 | Sep 30, 2026 | Change |
|---|---|---|---|
| Cash and cash equivalents | 4,261 | 5,829 | +37% |
| Receivables from users, net | 17,994 | 23,598 | +31% |
| Securities loaned | 11,626 | 19,480 | +68% |
| Payables to users | 11,986 | 18,473 | +54% |
| Long-term borrowings | 0 | 2,660 | new |
| Total assets | 38,137 | 58,271 | +53% |
| Total stockholders' equity | 9,151 | 10,078 | +10% |
| Total assets / equity (d) | 4.2x | 5.8x | +1.6x |
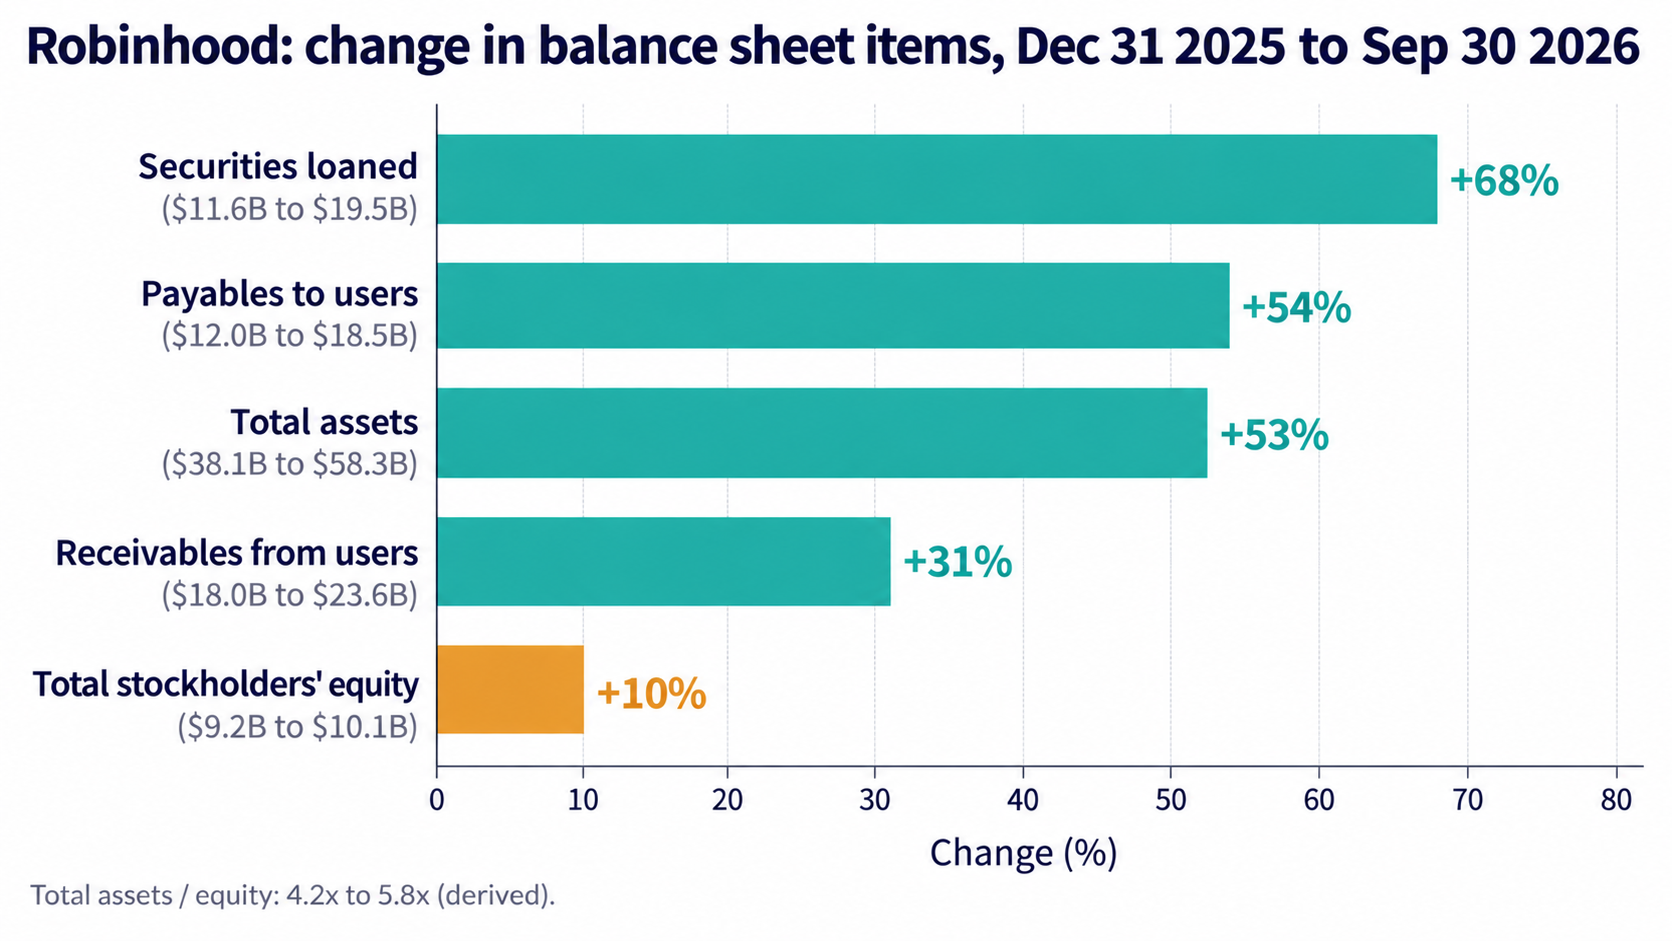
Robinhood Balance Sheet Growth vs Equity Growth, Dec 2025 to Sep 2026 (Self-Made)
Net interest revenue was $415M (-9%). The release attributes the decline mainly to lower securities lending activity and lower short-term interest rates, even as the margin book reached $22.1B (+59%), cash and deposits $20.4B (+43%) and total interest-earning assets hit new highs. Cash sweep balances fell 9% to $32.3B. The release does not give a dollar figure for securities lending revenue.
Rate sensitivity. Verma said each 25-basis-point move in rates changes revenue by about 1.5%, with roughly $80B of interest-earning assets and about half of them interest-sensitive, and that a rate hike would be a tailwind. Lower rates are the reverse.
Cash flow, read with care. Operating cash flow was +$1,225M in Q3 against -$1,576M a year earlier. For a broker, this line moves with customer balances, such as payables to users and securities loaned, so it is not a clean measure of earnings. Capital spending is small: $10M of property and equipment and $11M of capitalised software in Q3.
Buybacks. Robinhood repurchased $25M of stock in Q3 (about 0.2M shares at about $105) against $107M a year earlier, and $689M in nine months. Diluted shares were 911M vs 918M (-0.8%, derived). Nine-month stock-based compensation was $277M (+21%). At the after-hours $87.60 the shares trade below the Q3 buyback price.
Long-term borrowings are $2,660M in the release; the portion I read does not itemise them, so check the Form 10-Q for the lenders and terms. (d) = my arithmetic. Source: Robinhood Q3 2026 results; Motley Fool call transcript.
Forensic #4: The Q4 Cost Guide Implies A 15% To 26% Step-Up
Subtracting nine-month actuals from Robinhood's full-year expense guidance shows what the fourth quarter has to contain.
| Adjusted operating expenses and SBC ($M) | Amount |
|---|---|
| FY2026 guidance (top end cut by $25M) | 2,675 to 2,750 |
| Nine-month 2026 actual | 1,912 |
| Implied Q4 (d) | 763 to 838 |
| Q3 2026 actual | 664 |
| Q2 2026 actual | 641 |
| Q1 2026 (d: nine months minus Q2 minus Q3) | 607 |
| Implied Q4 vs Q3 (d) | +15% to +26% |
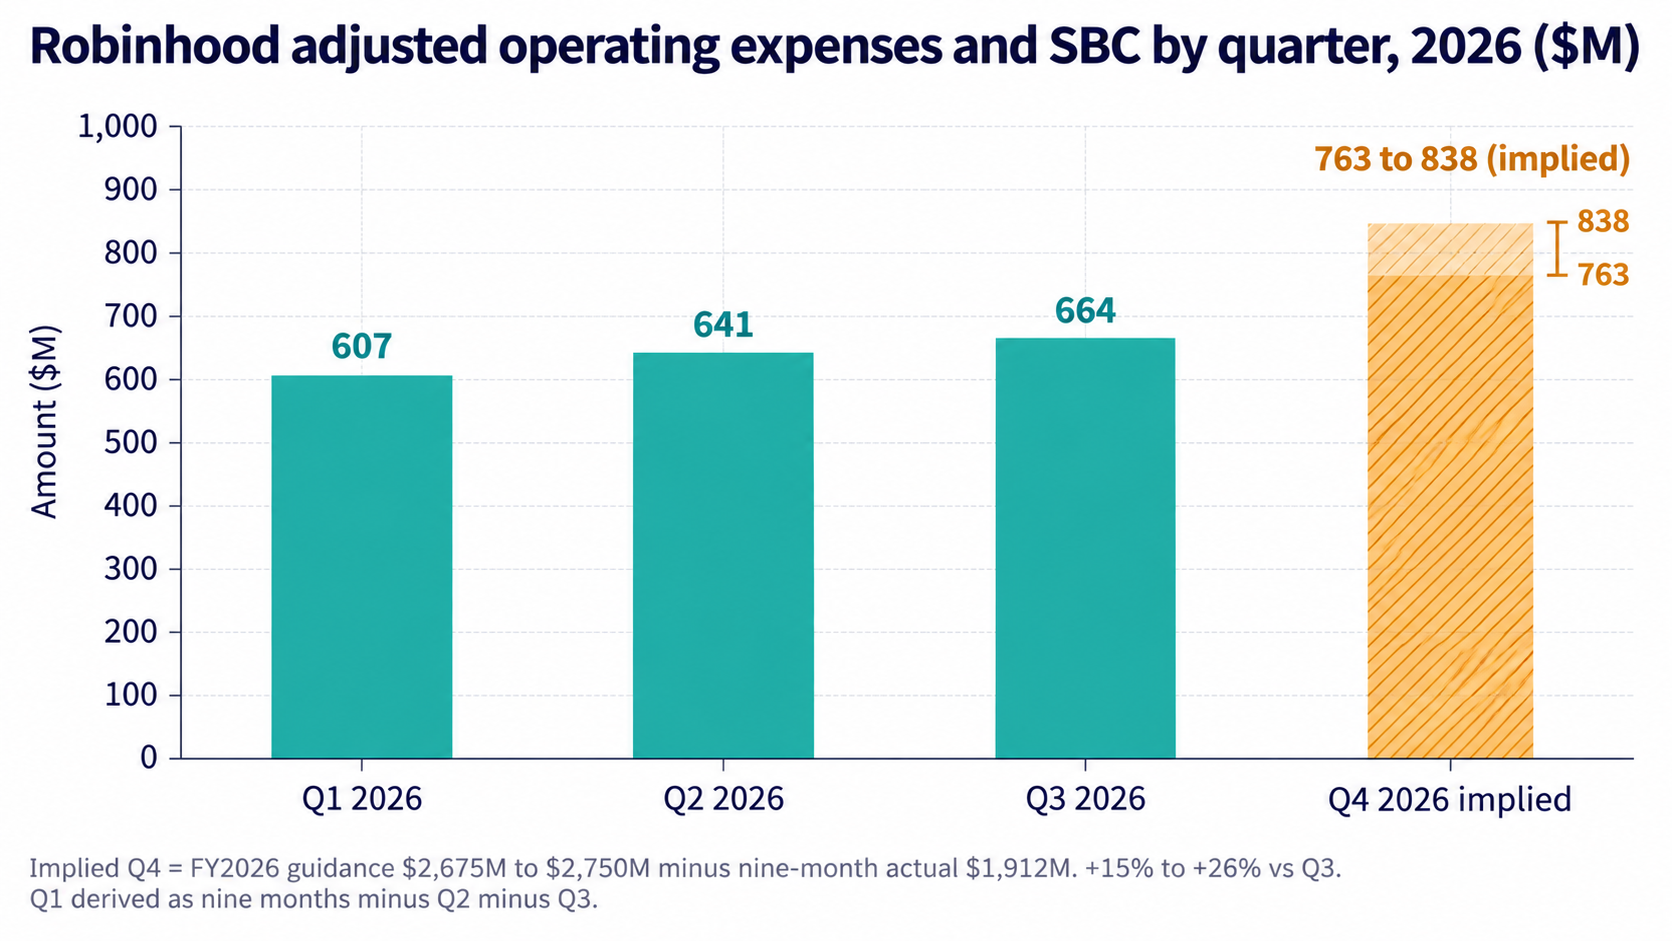
Adjusted Operating Expenses and SBC by Quarter, Q1 to Q4 2026 (Self-Made)
The guide excludes provision for credit losses, pending acquisition costs, CFO-transition equity modification costs, operating-classified interest, and potential significant regulatory matters, so total expenses can be higher. The release gives no GAAP expense outlook and no revenue outlook. Management said about $100M of Trump Accounts spending is expected for the full year, and that 2027 guidance will come with the full plan in January or February.
Against this cost step-up, early Q4 trading volumes were about 5% below Q3, spreads were a little tighter, and October net deposits topped $13B month to date, including $6B from the Dell family's Trump Accounts contribution, or about $7B excluding it (derived). On the call, Verma said recent deposit growth has come more from existing customers, and that monthly active users were "a little weaker this quarter," citing timing and seasonality.
(d) = my arithmetic: guidance minus nine-month actuals as defined in the release's reconciliation. Sources: Robinhood Q3 2026 results; Investing.com call summary; BigGo Finance call summary.
Risks: What Would Break The Thesis
The data points to five places where the Q3 numbers could prove less durable than the revenue headline suggests.
| Risk | What the data shows |
|---|---|
| Crypto take rate | Revenue -55% on volume -38%; management expects Q4 pressure from tighter spreads and a mix shift toward lower-rate Robinhood Earn |
| Event-contract concentration | 12.1% of Q3 revenue, against under 2.3% a year ago (both d). The release's guidance exclusions mention "potential significant regulatory matters"; the release does not size them |
| Credit costs | Provision of $71M vs $26M; 5.0% of revenue vs 2.0% (d), with the card book still scaling |
| Rate sensitivity | About 1.5% of revenue per 25 basis points; net interest revenue already fell 9% in Q3 |
| Cost step-up | Implied Q4 adjusted opex and SBC +15% to +26% on Q3 (d), with no revenue guide to match |
On users: funded customers rose 7%, Gold subscribers 34% and platform assets 19%. The call also acknowledged weaker monthly active users, and the release gives no monthly active user count.
(d) = my arithmetic. Sources: Robinhood Q3 2026 results; Motley Fool call transcript; BigGo Finance.
Valuation Snapshot
At the after-hours price of $87.60, Robinhood's market value is about $78.9B, roughly 37x annualised Q3 adjusted EPS.
| Measure | At $94.56 (Oct 27 close) | At $87.60 (after hours) |
|---|---|---|
| Share price move | +1.85% on the day | -7.36% after hours |
| Market value (d) | $85.2B | $78.9B |
| Position in 52-week range ($63.52 to $150.47) (d) | 37.2% below high | 41.8% below high; 37.9% above low |
| Q3 adjusted EPS annualised ($2.40) (d) | 39.4x | 36.5x |
| Q3 GAAP EPS annualised ($2.04) (d) | 46.4x | 42.9x |
| Q3 revenue annualised ($5.70B) (d) | 15.0x | 13.9x |
| Q3 adjusted EBITDA annualised ($3.23B) (d) | 26.4x | 24.4x |
Method: 793M Class A plus 108M Class B shares outstanding at Sept 30, 2026 (901M) times the share price. These are market-value multiples, not enterprise-value multiples, because a brokerage balance sheet holds large customer-related assets and liabilities that make enterprise value hard to read. Two cautions on the multiples: they annualise a single quarter, and they ignore both the guided Q4 cost step-up and the tighter early-Q4 spreads.
Consensus context: Investing.com reports adjusted EPS of $0.60 against a $0.55 consensus. It also reports revenue against a $1.43B consensus while describing the miss as about $30M, which does not reconcile with a $1,424M result, so I do not rely on a revenue-miss figure here.
This article gives no price target. Any target depends on Q4 take rates, event-contract regulation, credit losses and the 2027 expense plan, none of which Robinhood has yet provided.
(d) = my arithmetic. Sources: Investing.com (closing and after-hours prices, 52-week range, consensus); Stock Titan (share counts, release figures).
What To Watch Next
Robinhood's Q4 report, expected around February 2027 (the sources I read do not give a date), will test most of these at once.
| Check | Where the data stands | The test |
|---|---|---|
| Q4 adjusted opex and SBC | Q3 $664M; implied Q4 $763M to $838M | Whether the print lands in the implied range or below it |
| Crypto take rate | Revenue $120M on $50B notional volume | Whether tighter spreads and Robinhood Earn push revenue lower again |
| Event contracts | $173M, 12.1% of revenue (d); Q4 volumes about +10% early | Whether the line holds above $150M as comparisons toughen |
| Tax rate | 23.8% in Q3 vs 12.3% a year ago (d) | The 10-Q's explanation, and whether the rate returns toward 19% (Q2) |
| Net interest revenue | $415M (-9%) with margin book +59% | Whether it stabilises as lending balances keep growing |
| Credit provision | $71M, 5.0% of revenue (d) | Provision as a share of revenue as the card book grows |
| 2027 plan | Guidance due January or February | Expense growth against revenue growth |
Also worth tracking: Robinhood's Form 10-Q for the quarter, which should explain the tax rate, itemise long-term borrowings and detail credit losses; monthly metrics Robinhood publishes between earnings; and net deposits excluding the $6B Trump Accounts contribution.
Sources And Data Notes
Financial statement figures come from Robinhood's Q3 2026 results release, which I opened in full through the company's investor site. Q3 2026 is the three months ended September 30, 2026. The earnings call and results were on Oct 27, 2026; prices are as of the Oct 27 close and after-hours session, written before the Oct 28 regular session, and will have moved.
Primary source
- Robinhood Reports Third Quarter 2026 Results, Oct 27, 2026
Secondary sources
- Investing.com, Oct 27: after-hours move, consensus, call summary
- Motley Fool call transcript: take rates, rate sensitivity, Q4 trends
- Stock Titan: release figures, share counts
- BigGo Finance: call summary and analyst questions
Marked, not independently confirmed
- Call commentary (take rates, rate sensitivity, Q4 trends, monthly active users) comes from transcripts and summaries, not from the filed release.
- Consensus figures come from Investing.com. Its revenue consensus and miss size do not reconcile, so only the adjusted EPS comparison is used.
Left out
- A securities-lending dollar swing that I had seen mentioned in earlier research. I could not find it in the release or the call summaries, so it is excluded.
- I did not open the Form 10-Q, so the tax-rate change, borrowing details and credit-loss detail are not confirmed from the filing.
Derived figures are my arithmetic from the release and are marked (d), "derived" or "my arithmetic".

Sandeep Gupta
Independent equity research analyst publishing forensic theses on US-listed stocks. MBA, Politecnico di Milano School of Management (Milan, Italy).
Get new research in your inbox
Subscribe to receive forensic equity research the moment it's published. Free, no spam.

Discussion
Be the first to comment.