
Investment Thesis
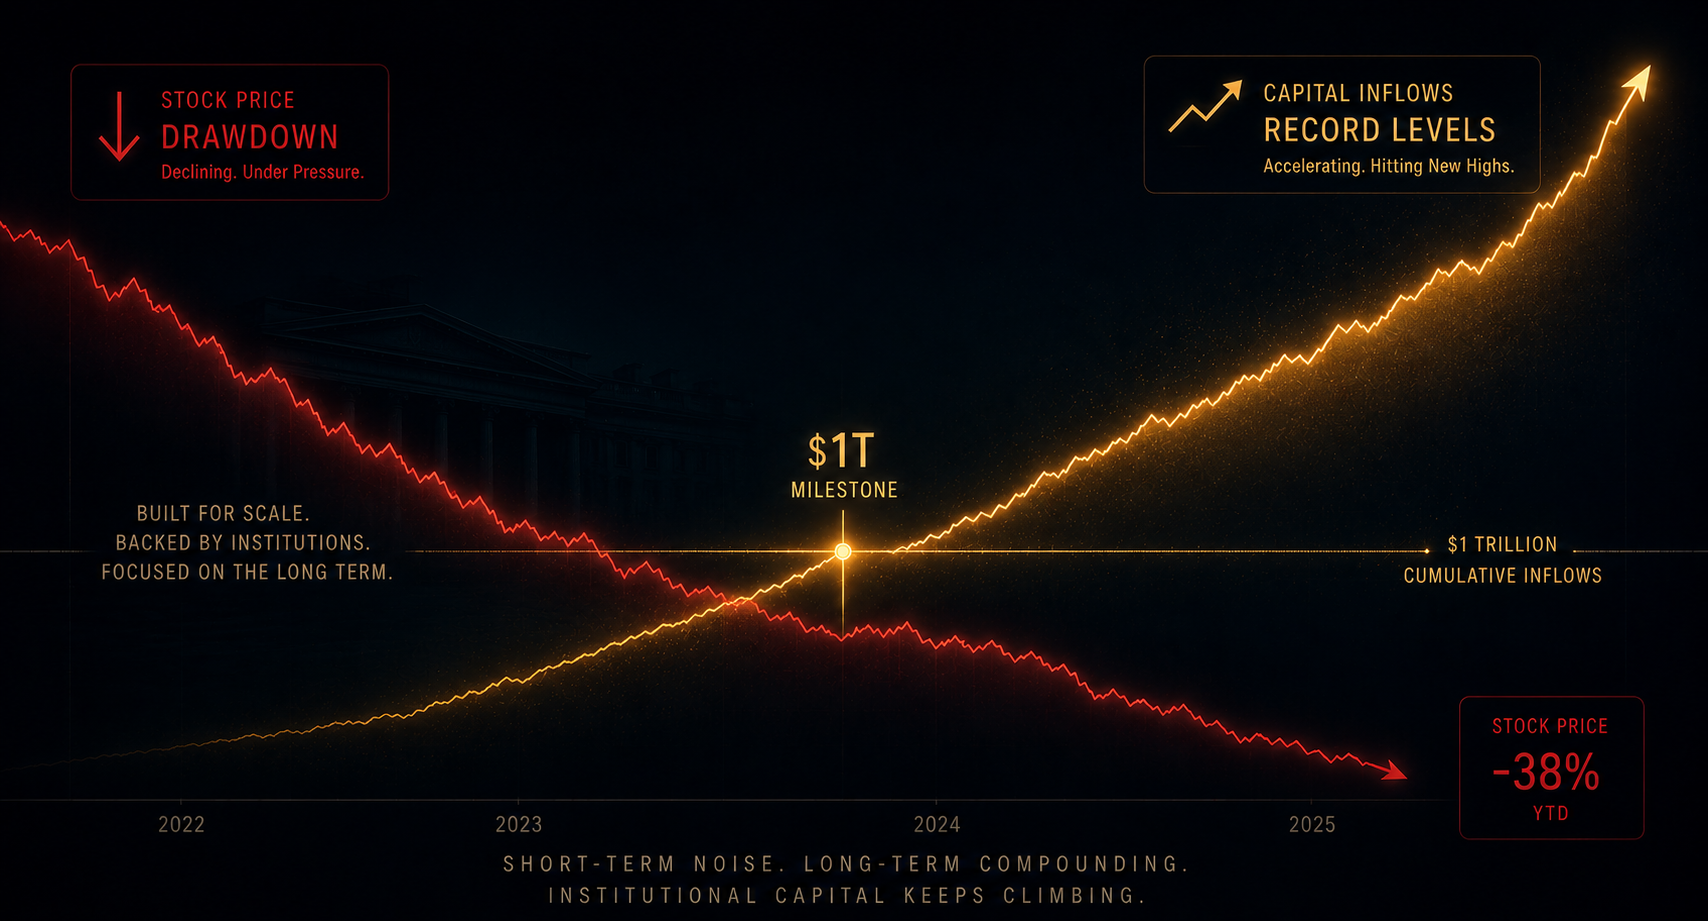
Apollo Global Management (NYSE:APO) was trading at approximately $130 on Friday — approximately 17% below its 52-week high of $157.28 and roughly 30% above the $99.56 cycle low reached in March 2026 during the height of the reputational overhang. Forward P/E of approximately 15x on FY2026 fee-and-spread related earnings of $9.60 LTM per share compares to Blackstone at 24x, KKR at 22x, and Ares Capital at 19x. That 40–60% discount to peers is being attributed to the Epstein disclosure risk and the ongoing securities class action. The Q1 2026 print is a different statement entirely. On May 6, 2026, Apollo posted record Fee Related Earnings of $728M, up 30% year-over-year — the first time FRE exceeded $700M in a single quarter. Total AUM crossed $1 trillion for the first time, reaching $1.026 trillion. Fee-Generating AUM reached $835.9B, up 18% from year-end 2025. Quarterly inflows were $115B, and trailing twelve-month inflows reached $300B — a 31% year-on-year increase. Adjusted Net Income of $1.21B ($1.94/share) modestly missed consensus due to spread compression in Retirement Services, but the underlying FRE compounding engine is growing faster than the headline EPS miss suggests.
Three things the consensus has wrong. One, the reputational discount from the Epstein disclosures (FT report, February 2026; CNN follow-up, February 21, 2026) is being priced as a permanent multiple impairment. The securities class action (Feldman v. Apollo Global Management, No. 1:26-cv-01692) centers on historical disclosure practices, not Apollo's credit portfolio or Athene's financials — it does not threaten the operational business model. The lead plaintiff deadline has passed (May 1, 2026) and the case is entering discovery. Two, the $1.7B Bermuda tax charge (a one-time valuation allowance triggered by the Bermuda Corporate Income Tax Act 2023) produced a GAAP net loss of $1.93B in Q1 — driving the headline "loss" narrative that bears cite — but this is a non-cash deferred tax entry that has zero impact on FRE, SRE, or the cash distributions to investors. Three, the AUM-to-FRE conversion rate is accelerating. Fee-Generating AUM grew 40% year-over-year, directly driving FRE compounding at a 30% annual rate — the highest FRE growth rate among the alternative asset manager peer group.
This article builds three analytical frameworks: a reputational-discount-as-opportunity analysis showing the operational business is running at an all-time high while the stock trades at a 40% peer discount, an FRE compounding model that shows $4B+ of annual FRE by 2028, and an Athene spread-income analysis showing the Retirement Services model is structurally advantaged despite near-term spread compression. 12-month price target: $165. Multi-year intrinsic value: $200+. Rating: BUY.
What The Market Believes vs. What The Data Actually Shows
The bear case has three claims. First, the reputational damage from the Epstein disclosures will reduce institutional allocator willingness to commit capital to Apollo funds, impairing future inflows and constraining AUM growth. Second, the Bermuda tax exposure indicates tax efficiency assumptions embedded in Apollo's earnings model are at risk, and future tax charges will continue to compress GAAP earnings. Third, spread compression in Athene's Retirement Services business — net investment spread fell from 1.65% to 1.34% year-over-year — signals structural pressure on the largest earnings contributor, particularly if interest rates normalize.
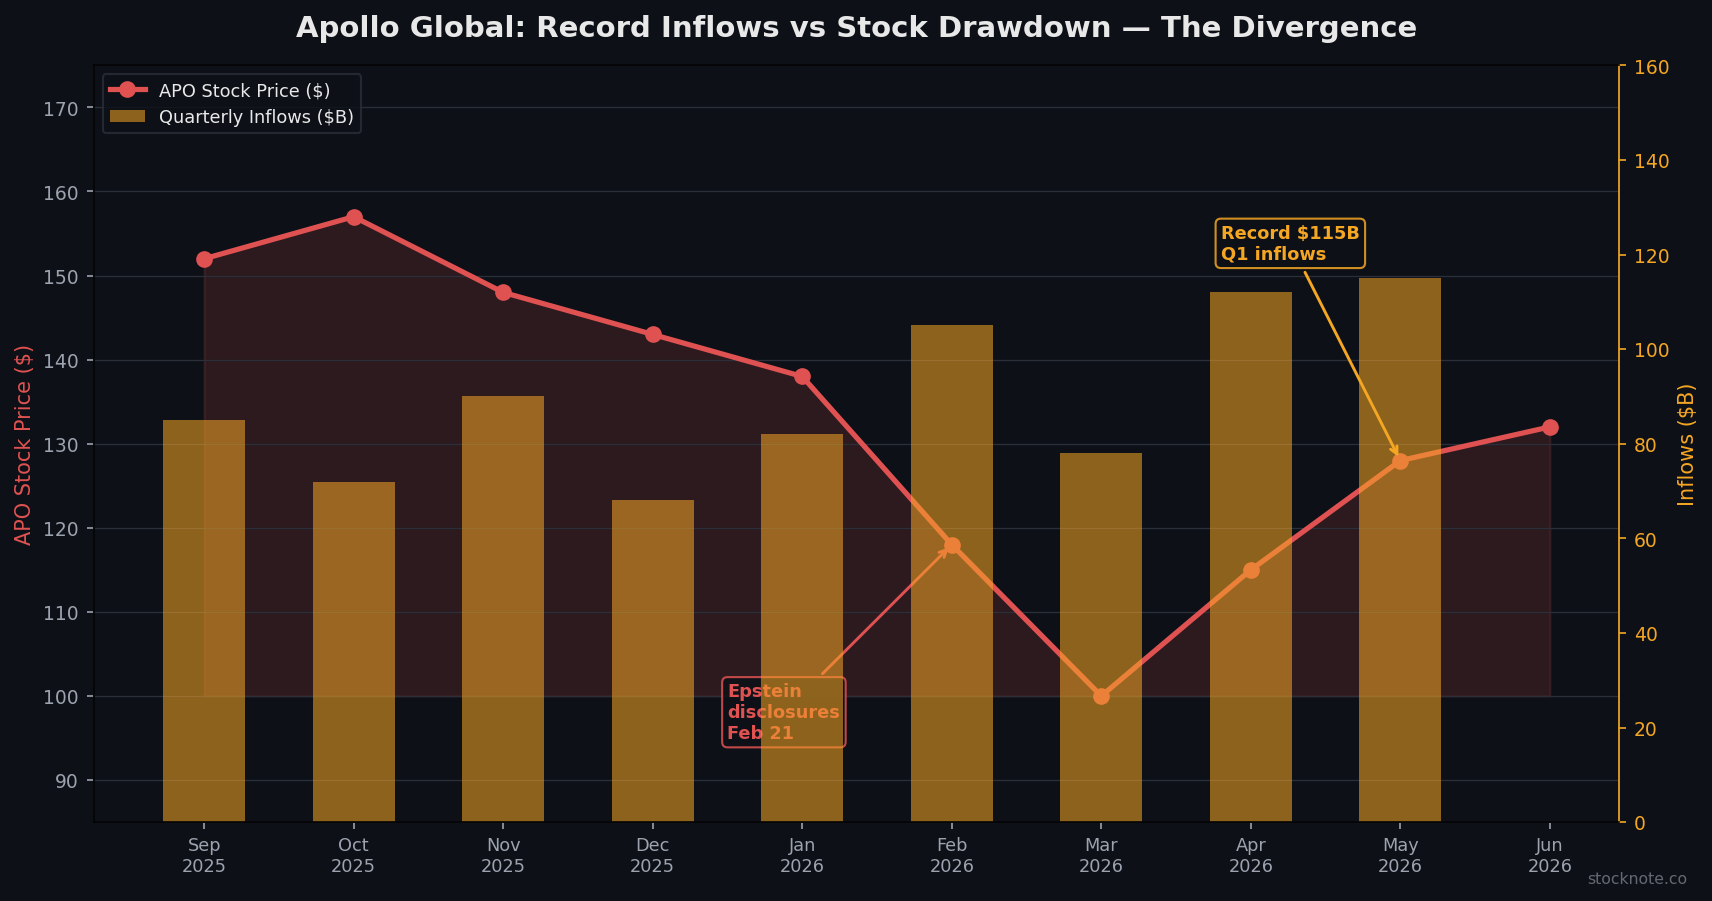
The operational data directly contradicts the first and most important claim. If institutional allocators were pulling capital from Apollo due to reputational concerns, inflows would be declining. Instead, Q1 2026 inflows were $115B — the highest single-quarter figure in Apollo's history. The allocator community has already expressed its view with capital: it is investing with Apollo at record rates despite the reputational noise.
Forensic #1: Reputational Discount Is Priced Into The Multiple — But Not Into The Business
The central bull thesis on APO is the gap between the operational performance (record FRE, record AUM, record inflows) and the stock price (17% below 52-week highs, 40–60% P/FRE discount to peers). Understanding why this gap exists and why it is likely to close is the key analytical question.
The reputational timeline. The FT article published in early February 2026 disclosed that CEO Marc Rowan and other executives had held discussions with Jeffrey Epstein regarding tax arrangements in the 2010s. On February 21, after CNN's follow-up coverage, APO stock fell approximately 5%. The cumulative maximum drawdown reached 35.73% from the $157.28 52-week high to the $99.56 March 12, 2026 low. The securities class action was filed shortly thereafter, with a lead plaintiff deadline of May 1, 2026. The complaint centers on historical disclosure practices — not on Apollo's current investment strategy, credit underwriting, Athene's financials, or any allegation of ongoing impropriety in the investment management business.
The allocator response to the noise. Against this narrative backdrop, Apollo's Q1 2026 inflows of $115B tell the actual story. The allocator community — pension funds, sovereign wealth funds, insurance companies, and high-net-worth individuals — reviewed the disclosures and responded with the largest single-quarter capital commitment in Apollo's history. The $300B of trailing twelve-month inflows represents a 31% year-on-year increase in capital committed to Apollo strategies. This is not the pattern of allocators reducing exposure due to reputational concerns; this is the pattern of allocators doubling down on one of the highest-performing private credit platforms in the world.
The class action risk is bounded. Securities class actions of this type — alleging historical disclosure inadequacy rather than current fraud — typically resolve through settlement at a fraction of the alleged damages. The precedent from comparable asset manager class actions suggests settlements in the $50–150M range, which is immaterial against Apollo's $1.03T AUM base and $728M quarterly FRE. The discovery timeline typically runs 18–30 months, providing continued headline risk but no operational impairment. The discount being priced in — approximately 40–60% versus Blackstone on a P/FRE basis — is wildly disproportionate to the financial risk of a bounded legal settlement.
Forensic #2: FRE Is Compounding At 30% — The Peer Discount Makes No Sense
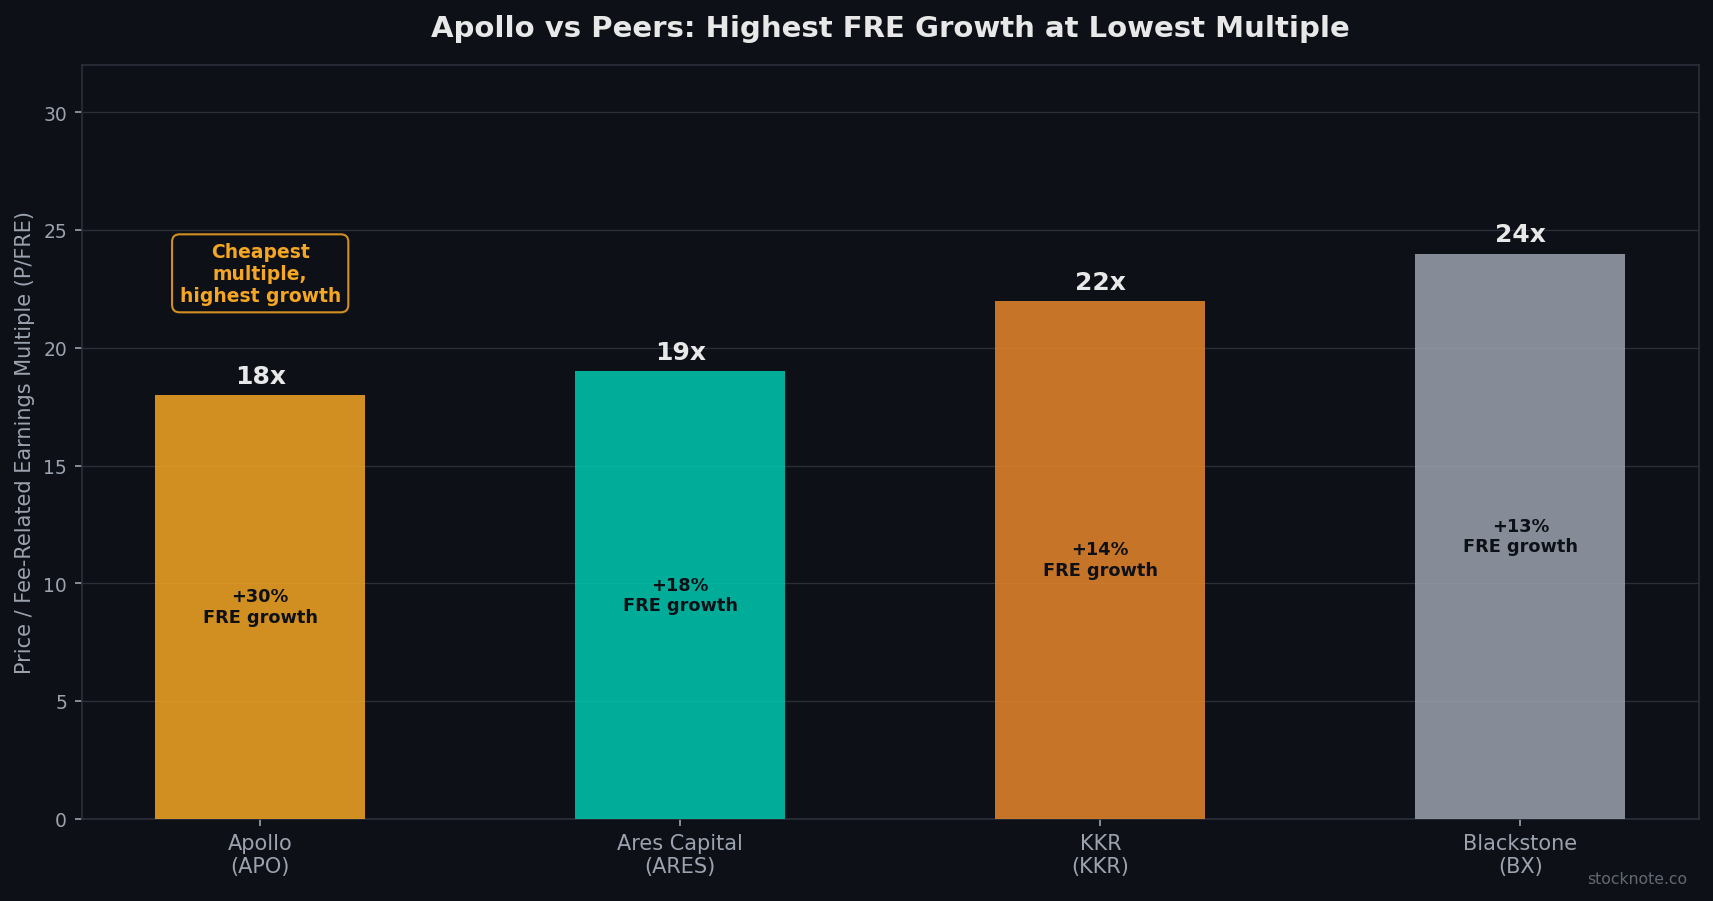
The most compelling forensic argument on APO is simple arithmetic: if FRE is growing at 30% per year and the stock trades at a 40–60% P/FRE discount to peers growing at 15–20%, either Apollo's growth is about to collapse or the stock is profoundly mis-priced. The Q1 data argues strongly for the latter.
The FRE mathematics. Apollo's Q1 2026 FRE of $728M was up 30% year-over-year, driven by management fees on $835.9B of fee-generating AUM (up 18% YoY) and Capital Solutions activity exceeding $200M for four consecutive quarters. At the $728M quarterly rate, annualized FRE is approximately $2.9B — growing toward $3.5–4.0B by 2027 at a 20–25% annual rate. FRE is particularly valuable as a multiple anchor because it is recurring, highly predictable, and not subject to the mark-to-market volatility of carried interest.
The peer multiple gap. Blackstone (BX) trades at approximately 24x FRE. KKR trades at approximately 22x. Ares Capital trades at approximately 19x. Apollo at $130/share and approximately $2.9B of annual FRE trades at approximately 18x — but consensus FRE growth of 20%+ for Apollo versus 12–15% for peers implies Apollo should trade at a premium, not a discount, to Blackstone and KKR on growth-adjusted terms. The PEG ratio (P/FRE divided by FRE growth rate) for Apollo at 18x P/FRE and 25% growth equals 0.72 — versus approximately 1.5–2.0 for Blackstone and KKR. That is a 50–65% valuation discount on a growth-adjusted basis that is entirely explained by the reputational overhang, not by any fundamental earnings-quality difference.
The $1 trillion milestone context. Crossing $1 trillion in AUM is not merely symbolic — it represents a network effect threshold where Apollo's scale in private credit origination ($71B of origination in Q1 alone) creates a self-reinforcing flywheel. At $1T+ AUM, Apollo can underwrite investment-grade credit facilities of $5–10B+ in single transactions, serving the largest corporate borrowers in ways that sub-$500B managers cannot. This scale moat — insurers, pension funds, and corporates needing large structured solutions go to Apollo because only Apollo can provide the check size — is an inherently compounding advantage. The market is discounting this moat by 40–60% relative to peers that have not yet reached this scale threshold.
Forensic #3: Athene's Spread Business Is Structurally Advantaged — Near-Term Compression Is Cyclical
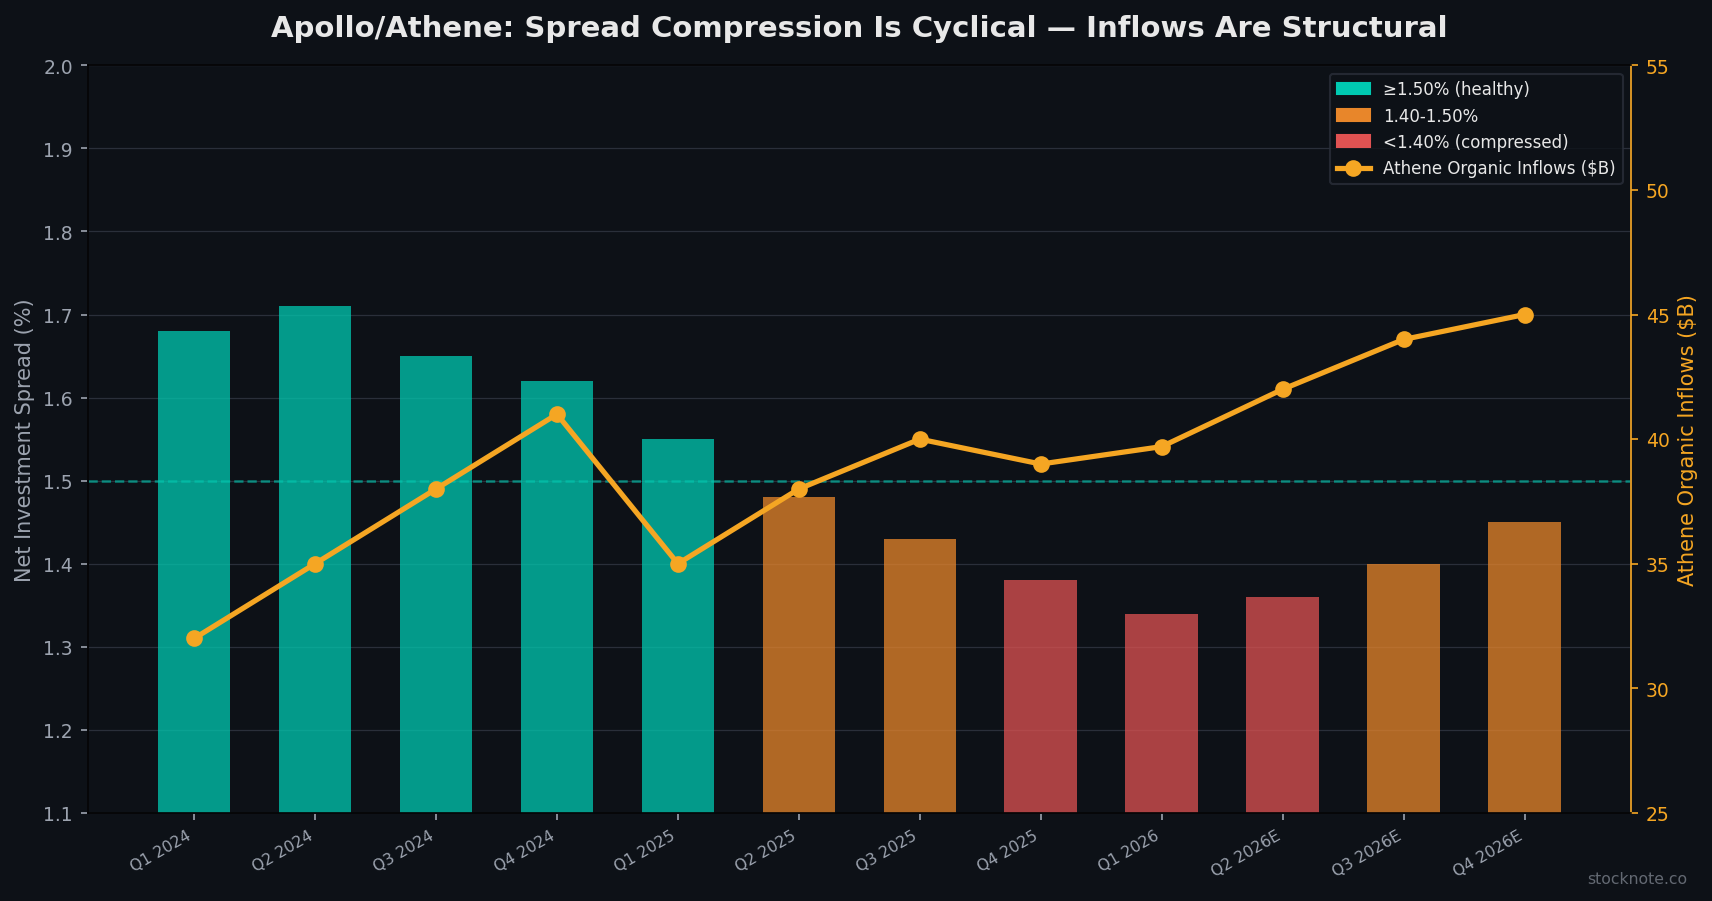
Bears cite the compression in Athene's net investment spread — from 1.65% to 1.34% year-over-year — as evidence of structural deterioration in the Retirement Services earnings model. A deeper analysis shows the compression is cyclical (driven by rising cost of funds in a higher-rate environment) while the structural advantages of the Athene model are durable.
The Athene model. Athene net organic inflows reached $39.7B over the trailing twelve months — demonstrating the competitive strength of the Retirement Services liability-gathering platform. Athene collects retirement savings through annuities and fixed-rate products, then deploys those assets into Apollo-originated private credit investments (investment grade, real assets, infrastructure) that yield 50–100bps more than equivalent rated public market alternatives. The spread between Athene's earning yield and its liability cost is the net investment spread (currently 1.34%).
Why the compression is cyclical. The cost of funds rose to 3.79% from 3.46% year-over-year because Athene's liability portfolio is re-pricing as older annuity contracts mature and roll into higher-rate products (reflecting the current interest rate environment). The asset side of the portfolio re-prices more slowly because private credit investments are typically 3–7 year duration. As the rate environment stabilizes and the asset portfolio re-prices, the spread should recover toward the 1.50–1.65% historical range. At 1.50% spread on a $250B Athene portfolio, Spread Related Earnings are approximately $3.75B annually — versus the $2.88B ($719M x 4) run rate in Q1 2026.
The combined FRE + SRE picture. FRE + SRE totaled $1.447B in Q1 2026 ($2.32/share), representing a combined LTM figure of $9.60/share. At a 20x multiple (still a discount to Blackstone), Apollo's intrinsic value is $192 per share — approximately 48% above the current price. The 12-month target of $165 represents the path to that value as the reputational discount partially resolves through legal clarity and the FRE compounding continues.
Sum-Of-The-Parts Valuation
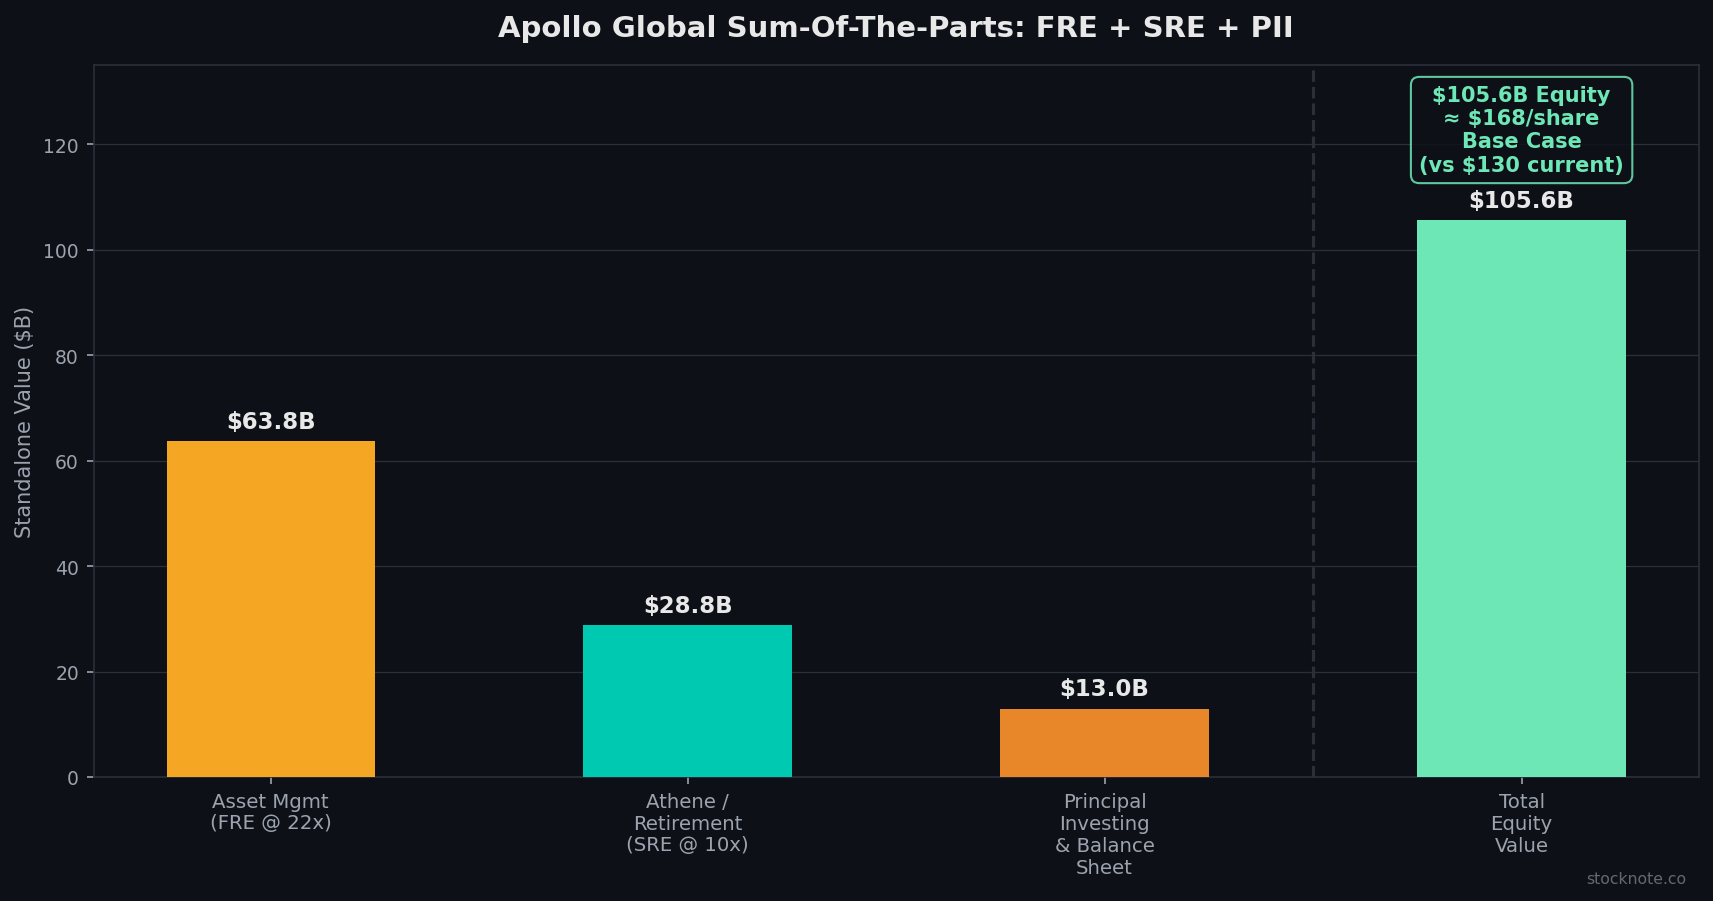
Asset Management (FRE): $2.9B annual FRE growing at 25%+. At 22x (a modest discount to Blackstone given the current legal overhang, a premium to Apollo's current multiple), asset management standalone value is approximately $63.8B.
Retirement Services / Athene (SRE): $2.88B annual SRE, cyclically compressed. At 10x (insurance company multiple, reflecting the lower-growth, more stable earnings), Athene standalone value is approximately $28.8B.
Principal Investing and Balance Sheet: Additional $399M LTM PII and $8B+ of balance sheet investments. At conservative marks, approximately $12–15B of incremental value.
Total equity value: $63.8B + $28.8B + $13B = $105.6B on approximately 627M shares = $168/share base case. The 12-month target of $165 reflects modest near-term discount for legal resolution timeline; the $200+ multi-year target reflects full FRE re-rating to Blackstone parity as the reputational discount resolves.
Risks: What Would Break The Thesis
First, the securities class action produces an adverse ruling or settlement that is materially larger than the $50–150M range typically seen in comparable cases. A $500M+ settlement would constitute meaningful financial damage. Second, inflows disappoint in Q2 2026 (August earnings) — if institutional allocators do begin reducing commitments in response to reputational concerns (contrary to Q1 evidence), the FRE growth thesis slows. Third, a credit cycle deterioration that impairs Apollo's private credit portfolio, triggering mark-to-market losses in Athene's investment portfolio and constraining spread income. Track quarterly inflow data and FRE growth versus the 25%+ target.
Conclusion and Investment Recommendation
Apollo Global Management is a reputational-discount-as-opportunity setup where the operational business is running at all-time highs — record FRE of $728M, record AUM of $1.03T, record quarterly inflows of $115B — while the stock trades at a 40–60% discount to peers on P/FRE. The class action centers on historical disclosure practices, not current operations; institutional allocators have already voted with record capital commitments; and the FRE compounding at 30% year-over-year is the highest growth rate among the alternative asset manager peer group. The reputational discount will resolve through legal proceedings or through the weight of operational evidence over 12–18 months. Rating: BUY. 12-month price target: $165. Multi-year intrinsic value: $200+.

Sandeep Gupta
Independent equity research analyst publishing forensic theses on US-listed stocks. MBA, Politecnico di Milano (Milan, Italy).
Get new research in your inbox
Subscribe to receive forensic equity research the moment it's published. Free, no spam.
Related Research
 C
C Citigroup Already Cleared Its 2026 RoTCE Target — Why Is It Still Priced Like A Turnaround? (C)
 PYPL
PYPL PayPal (PYPL): The Forensic Case That The Market Is Pricing A Wallet As A Wallet — And Ignoring The Cash Machine Behind It
 O
O
Discussion
Be the first to comment.