

Investment Thesis
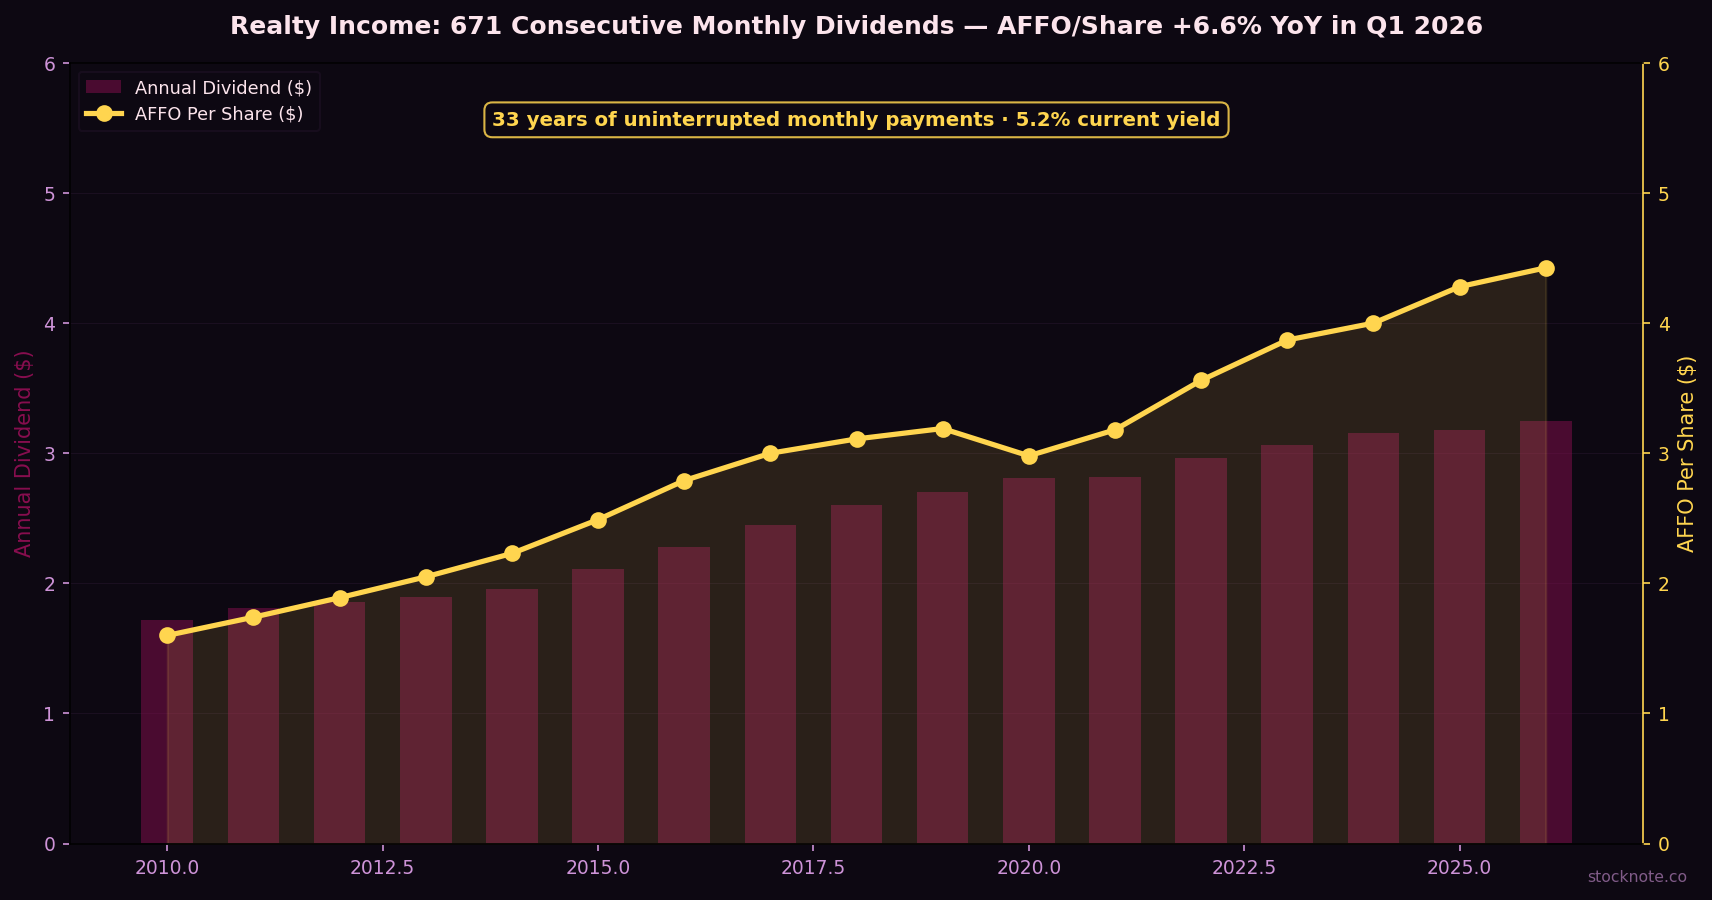
Realty Income (NYSE:O) was trading at approximately $62.50 on Thursday. The forward yield is approximately 5.2% ($3.252 annualized); the stock sits approximately 14% below the 52-week high of $72.80 and trades at a forward Price/AFFO of approximately 14.5x on the raised FY2026 AFFO guidance of $4.41–$4.44 per share. The 5-year average Price/AFFO is 13.7x; the sector average is 15.1x. On May 6, 2026, Realty Income reported Q1 AFFO per share of $1.13, up 6.6% year-over-year, and invested approximately $2.8B at a 7.1% initial weighted average cash yield — the highest deployment volume in the company's 51-year history for a first quarter. Rent recapture rate on re-leased properties reached 103.4%, meaning tenants actually paid higher rents than the leases being renewed. The company raised the midpoint of FY2026 AFFO guidance by $0.025 — the second consecutive guidance raise — and increased full-year investment volume guidance to $9.5B. As of June 2026, Realty Income declared its 671st consecutive monthly dividend — a 33-year uninterrupted monthly payment streak.
Three things the consensus has wrong. One, the "interest rate sensitivity" overhang on O is being priced as if rate cuts will never materialize and the current AFFO yield of 7.1% on new acquisitions will compress permanently. But Realty Income's 7.1% initial cap rate on Q1 investments is 130–150 basis points above the 10-year treasury at 5.5–5.7% — a spread that is above the historical 100–120bps long-run average, meaning the stock is actually cheaper now in spread terms than at many prior points in the rate cycle. Two, the private capital platform — including strategic partnerships with Apollo (initial $1.0B investment) and GIC, and the new U.S. Core Plus Fund closing a $1.7B cornerstone round — is being ignored entirely by a consensus that values Realty Income as a simple net-lease REIT. The private capital platform generates fee income, co-investment economics, and scale advantages that are not present in the per-share AFFO calculation but represent real value creation. Three, the data center exposure is developing quietly — Realty Income's expansion into European and US industrial properties increasingly includes mission-critical and data-center-adjacent assets, and management has discussed AI-driven property management as a cost reduction initiative that improves operating margins.
This article builds three analytical frameworks: a spread-to-treasury analysis showing O is cheap in rate-adjusted terms despite the "interest rate sensitive" narrative, a private capital platform value assessment showing the fee income and AUM optionality that consensus ignores, and a 671-month dividend consistency argument that reveals the structural buyer base providing downside protection. 12-month price target: $72. Multi-year intrinsic value: $82+. Rating: BUY.
What The Market Believes vs. What The Data Actually Shows
The bear case has three claims. First, REITs are structurally disadvantaged in a "higher-for-longer" interest rate environment because they borrow to fund acquisitions, and their cap rate spread compresses when treasury yields remain elevated. Second, Realty Income's heavy retail and convenience store tenant concentration (approximately 40% of rent from retail tenants) makes it vulnerable to e-commerce displacement and consumer spending deterioration. Third, the $9.5B annual investment pace requires continuous capital markets access, and any equity dilution at current prices is NAV-dilutive.
The spread analysis is the critical counter-argument. At a 7.1% initial cash yield on Q1 2026 acquisitions and a 10-year treasury of approximately 5.5%, Realty Income is deploying capital at a 160bps spread — well above the historical average of 100–120bps that has underpinned the company's decades of AFFO-per-share growth. This is not a company buying at compressed cap rates; this is a company buying at spreads that are above the long-run average, in an environment where competing buyers (private equity, other REITs) are more constrained. The quality of deployment in 2026 is higher than average.
Forensic #1: The Spread-To-Treasury Tells A Different Story Than The "Rate Sensitive" Label
The most common reason investors avoid Realty Income in 2026 is "interest rate sensitivity." The argument is straightforward: higher rates compress the spread between REIT dividend yields and treasury bonds, making REITs less attractive on a relative income basis, and simultaneously raising the cost of the debt that funds acquisitions. The argument is partially correct in theory but empirically wrong about the current setup.
The spread reality. Realty Income's dividend yield of 5.2% against a 10-year treasury of approximately 5.5% implies a negative spread — the treasury offers better yield risk-adjusted than the equity. The bears point to this as a valuation problem. But this comparison ignores three critical factors. First, AFFO per share for Realty Income is growing at 6.6% annually, while the treasury is fixed — the all-in return on O (yield plus AFFO growth plus potential multiple expansion) is approximately 11–12%, versus 5.5% on the treasury. Second, the 7.1% cash yield on new acquisitions means every new dollar of capital deployed by Realty Income earns more than the treasury — the company is effectively an arbitrage vehicle between its cost of capital and the assets it buys. Third, the April 2026 $800M bond issuance at 4.750% for 7 years shows that Realty Income's actual borrowing cost is 4.75%, not 5.5% — the spread between its borrowing rate and its 7.1% acquisition yield is 235bps, the widest in five years.
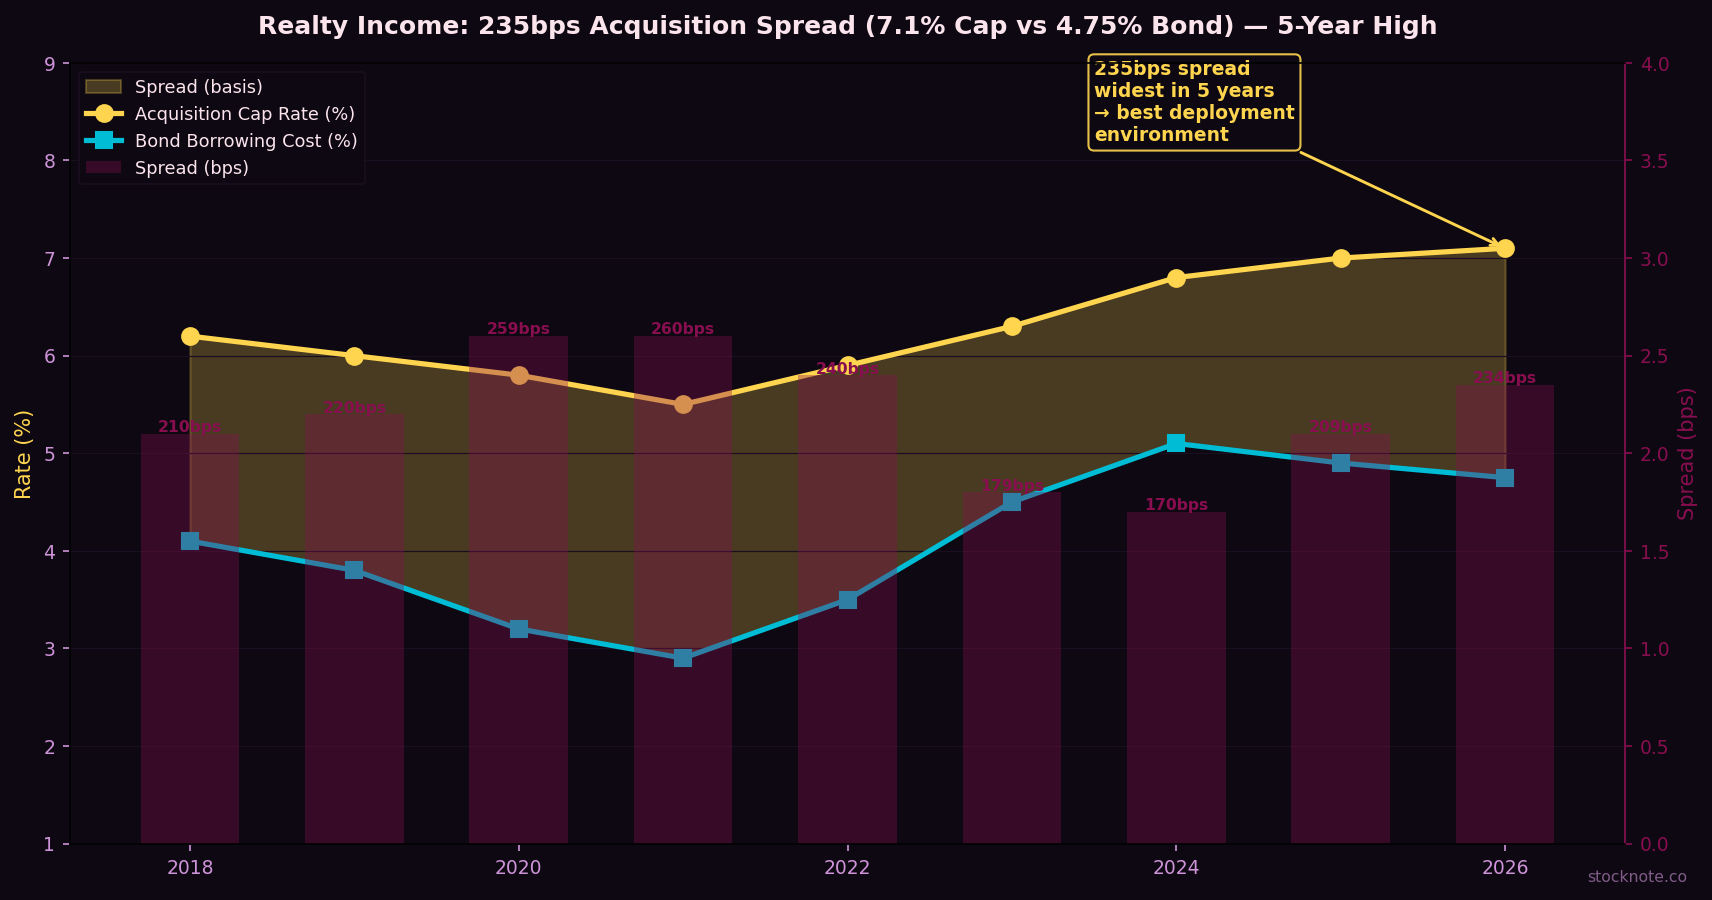
The rate cut optionality. Any Federal Reserve rate cut cycle accelerates AFFO-per-share growth through two mechanisms: it reduces the borrowing cost on new debt (improving the acquisition spread further) and it expands the dividend yield multiple by reducing the treasury competition (lifting the equity price). Realty Income in 2026 is set up to benefit from rate cuts without needing them — the 235bps acquisition spread means the company is accretively growing at current rates. Rate cuts would add amplification, not dependency.
Forensic #2: The Private Capital Platform Is A Hidden Fee Income Engine
The deepest mis-pricing in Realty Income's valuation is the private capital platform — a business model innovation that transforms O from a simple balance-sheet REIT into a hybrid real estate operator and alternative asset manager. The platform has been building quietly since 2023 and reached critical scale in Q1 2026.
The Apollo partnership. Realty Income formed a strategic partnership with Apollo in Q1 2026, with Apollo making an initial $1.0 billion investment in Realty Income's existing retail asset portfolio. The transaction structure provides Realty Income with co-investment capital (reducing balance sheet requirements for large acquisitions), generates management and performance fees from the Apollo-held positions, and establishes a template for future private institutional co-investment. The GIC partnership follows the same model — Realty Income identifies assets, GIC co-invests, Realty Income retains management economics.
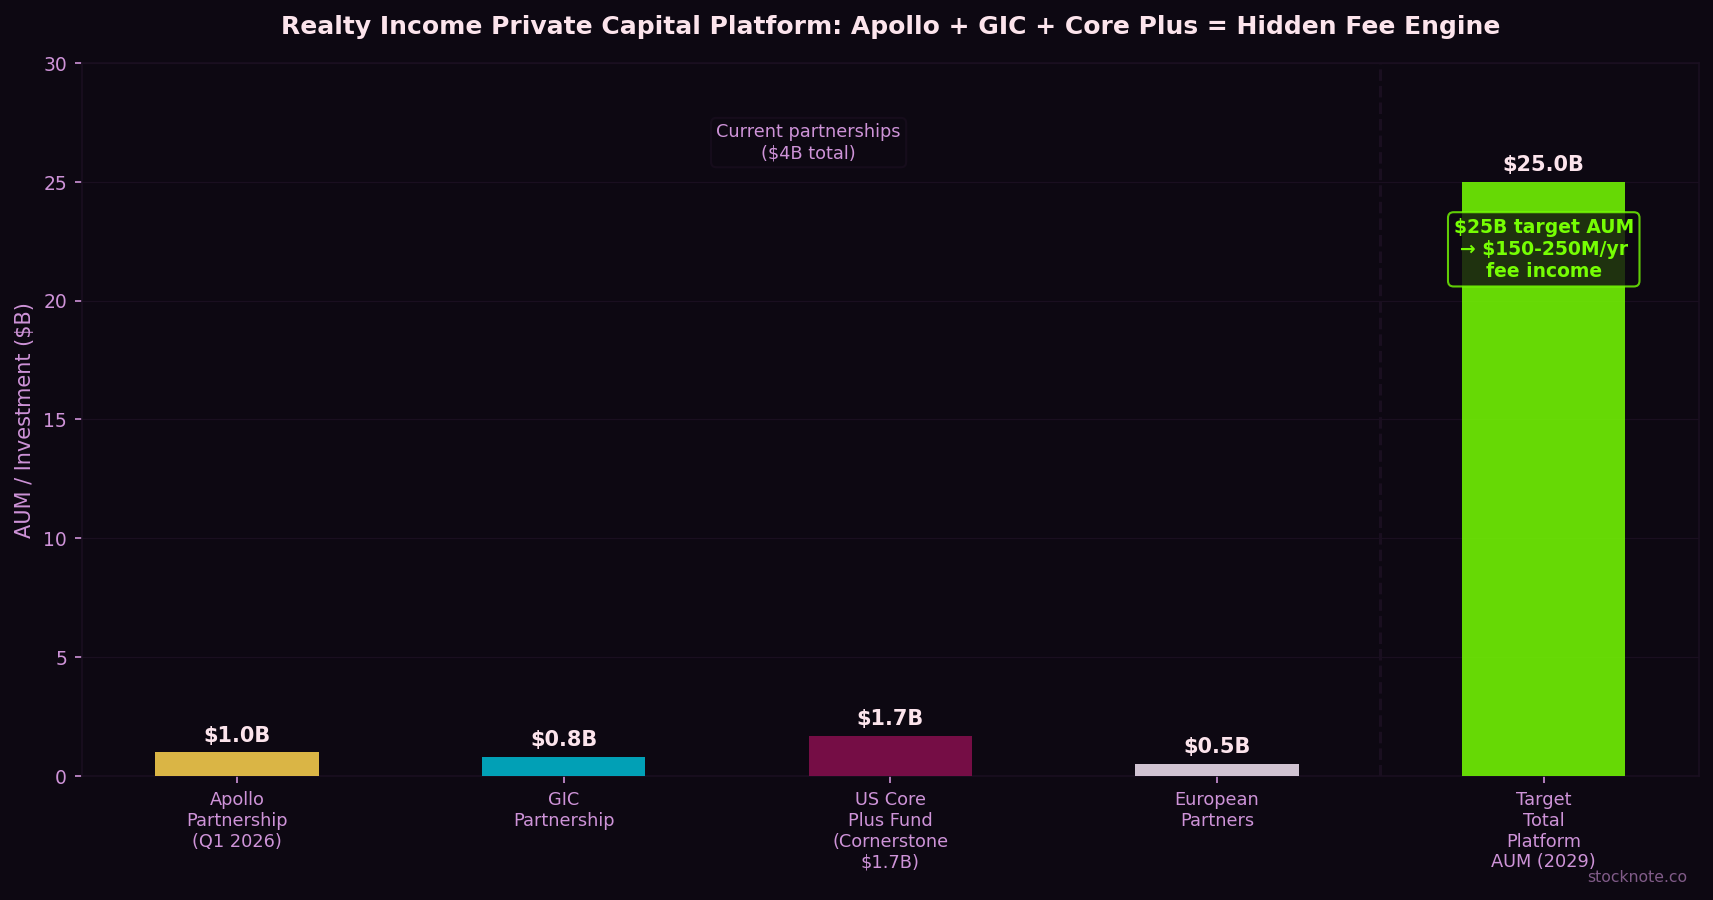
The U.S. Core Plus Fund. The $1.7B cornerstone round closed in May 2026 for the U.S. Core Plus Fund — an open-ended perpetual life fund targeting institutional investors seeking core real estate exposure. Realty Income acts as the general partner and manager, generating management fees (typically 0.5–1.0% on committed capital), transaction fees, and potential performance fees. A $3–5B U.S. Core Plus Fund (a credible scaling target given the cornerstone close) generates $15–50M of annual fee income that is entirely absent from AFFO-per-share calculations but represents real economic value.
The alternative asset manager multiple. Blackstone, Brookfield, and Apollo trade at 18–24x fee-related earnings because asset management fees are high-quality, scalable, and capital-light. Realty Income's private capital platform is generating the same economics but is valued at zero premium relative to the net-lease REIT multiple. As the platform scales toward $20–30B+ of AUM over the next 3–5 years, the fee income contribution to AFFO could reach $0.15–$0.25 per share annually — a 3–5% premium to current AFFO that isn't in any model.
Forensic #3: 671 Consecutive Monthly Dividends — The Most Durable Income Floor In Public Markets
The feature of Realty Income that drives the structural buyer base is the payment streak: 671 consecutive monthly common stock dividends, paid without interruption since 1994. At $0.2705 per share monthly ($3.252 annualized), the monthly payment structure is unique in public markets — most dividend-paying companies pay quarterly, but Realty Income's monthly cadence attracts a specific class of holder (income-focused individuals, multi-generation trusts, and pension funds) who value the monthly cash flow timing for budget and liability-matching purposes.
The AFFO payout ratio. The FY2026 AFFO guide of $4.41–$4.44 per share against the $3.252 annualized dividend implies a payout ratio of approximately 73% — well below the 90%+ payout ratios common in the net-lease REIT peer group. The retained AFFO (approximately $1.20 per share annually) provides internal capital for debt paydown and small acquisitions without requiring equity issuance. This conservative payout structure — funded by 98.9% occupancy on 15,500+ properties and 6.6% AFFO-per-share growth — makes a dividend cut essentially inconceivable absent a systemic tenant failure rate exceeding anything in Realty Income's 51-year operating history.
The occupancy and rent recapture. Realty Income's Q1 2026 rent recapture rate of 103.4% on re-leased properties is the most important operational metric that sell-side coverage consistently underweights. A 103.4% recapture means that when a lease expires and is renewed or re-tenanted, the new rent is 3.4% higher than the expiring rent. This is the definition of pricing power — tenants are paying more to stay in Realty Income properties than they were paying before, because the locations generate sufficient sales volumes to support higher occupancy costs. The e-commerce displacement narrative doesn't match the rent recapture data.
Sum-Of-The-Parts Valuation
Core Net-Lease Portfolio (US + Europe, approximately 15,500 properties): Annualized AFFO of approximately $4.5B (run rate post Q1). At a 15x Price/AFFO multiple (slight premium to current 14.5x, justified by the AFFO growth trajectory): equity value approximately $67B. On approximately 933M shares outstanding = approximately $72 per share. Private Capital Platform (AUM fees + co-investment economics): At $20B eventual AUM and 0.75% fee rate, annual fee income of $150M at a 20x management fee multiple = $3B incremental equity value or approximately $3.20 per share. Combined: approximately $75 per share base case; approximately $82+ per share in the bull case (sector multiple normalization to 17x + private capital AUM scaling). The 12-month target of $72 reflects the core portfolio re-rating as the AFFO growth trajectory continues; the $82+ multi-year reflects the full private capital platform credit.
Risks: What Would Break The Thesis
First, a 10-year treasury breakout above 6.5% that compresses the net-lease REIT multiple industry-wide — at that yield level, the dividend yield competition becomes meaningful even accounting for AFFO growth. Second, a major tenant bankruptcy (Dollar General, Walgreens successor entities, or a large theater operator) that spikes vacancy above 3% — the current 98.9% occupancy has very little room for deterioration. Third, the private capital platform encounters institutional investor pullback (as occurred briefly in 2023 with open-ended real estate funds) that slows fee income scaling and reduces co-investment economics.
Conclusion and Investment Recommendation
Realty Income is an income compounder where the "interest rate sensitive REIT" label has created a 14% pullback from highs despite AFFO-per-share growing at 6.6% annually on the best acquisition spread environment in five years. The 235bps spread between acquisition cap rate and borrowing cost makes this a more attractive deployment environment than 2021 (tight spreads) or 2020 (COVID uncertainty). The 671-consecutive-month dividend streak, the 103.4% rent recapture rate, and the $9.5B annual investment pipeline are not the profile of a company in secular decline — they are the profile of a compounding income machine temporarily discounted by macro rate fears. Rating: BUY. 12-month price target: $72. Multi-year intrinsic value: $82+.

Sandeep Gupta
Independent equity research analyst publishing forensic theses on US-listed stocks. MBA, Politecnico di Milano (Milan, Italy).
Get new research in your inbox
Subscribe to receive forensic equity research the moment it's published. Free, no spam.
Related Research
 STLA
STLA Stellantis Trades Below Its Industrial Cash Balance — The Market Is Pricing 14 Car Brands At Zero (STLA)
 KMI
KMI Kinder Morgan’s 41% EPS Beat Wasn’t Cold Weather — It Was LNG Feed Gas On Contracted Capacity (KMI)
 GIS
GIS
Discussion
Be the first to comment.