

Investment Thesis
Shares of PayPal Holdings (NASDAQ:PYPL) trade near $44.75, only about 16% above a 52-week low of $38.46 and roughly 44% below the 52-week high of $79.50. That makes this a strange moment for a bull case — except the de-rating has overshot the fundamentals so far that the stock now changes hands at roughly 8.4x trailing non-GAAP EPS of $5.31, against a payments-peer cohort generally north of 18–25x, while it sits on a net-cash balance sheet. Strip out the ~$1.9B of net cash and the operating business is priced at about 8.0x. And the gap exists because consensus is still working off of a terminal-share-loss model on a business whose own Q1 2026 print refutes it.
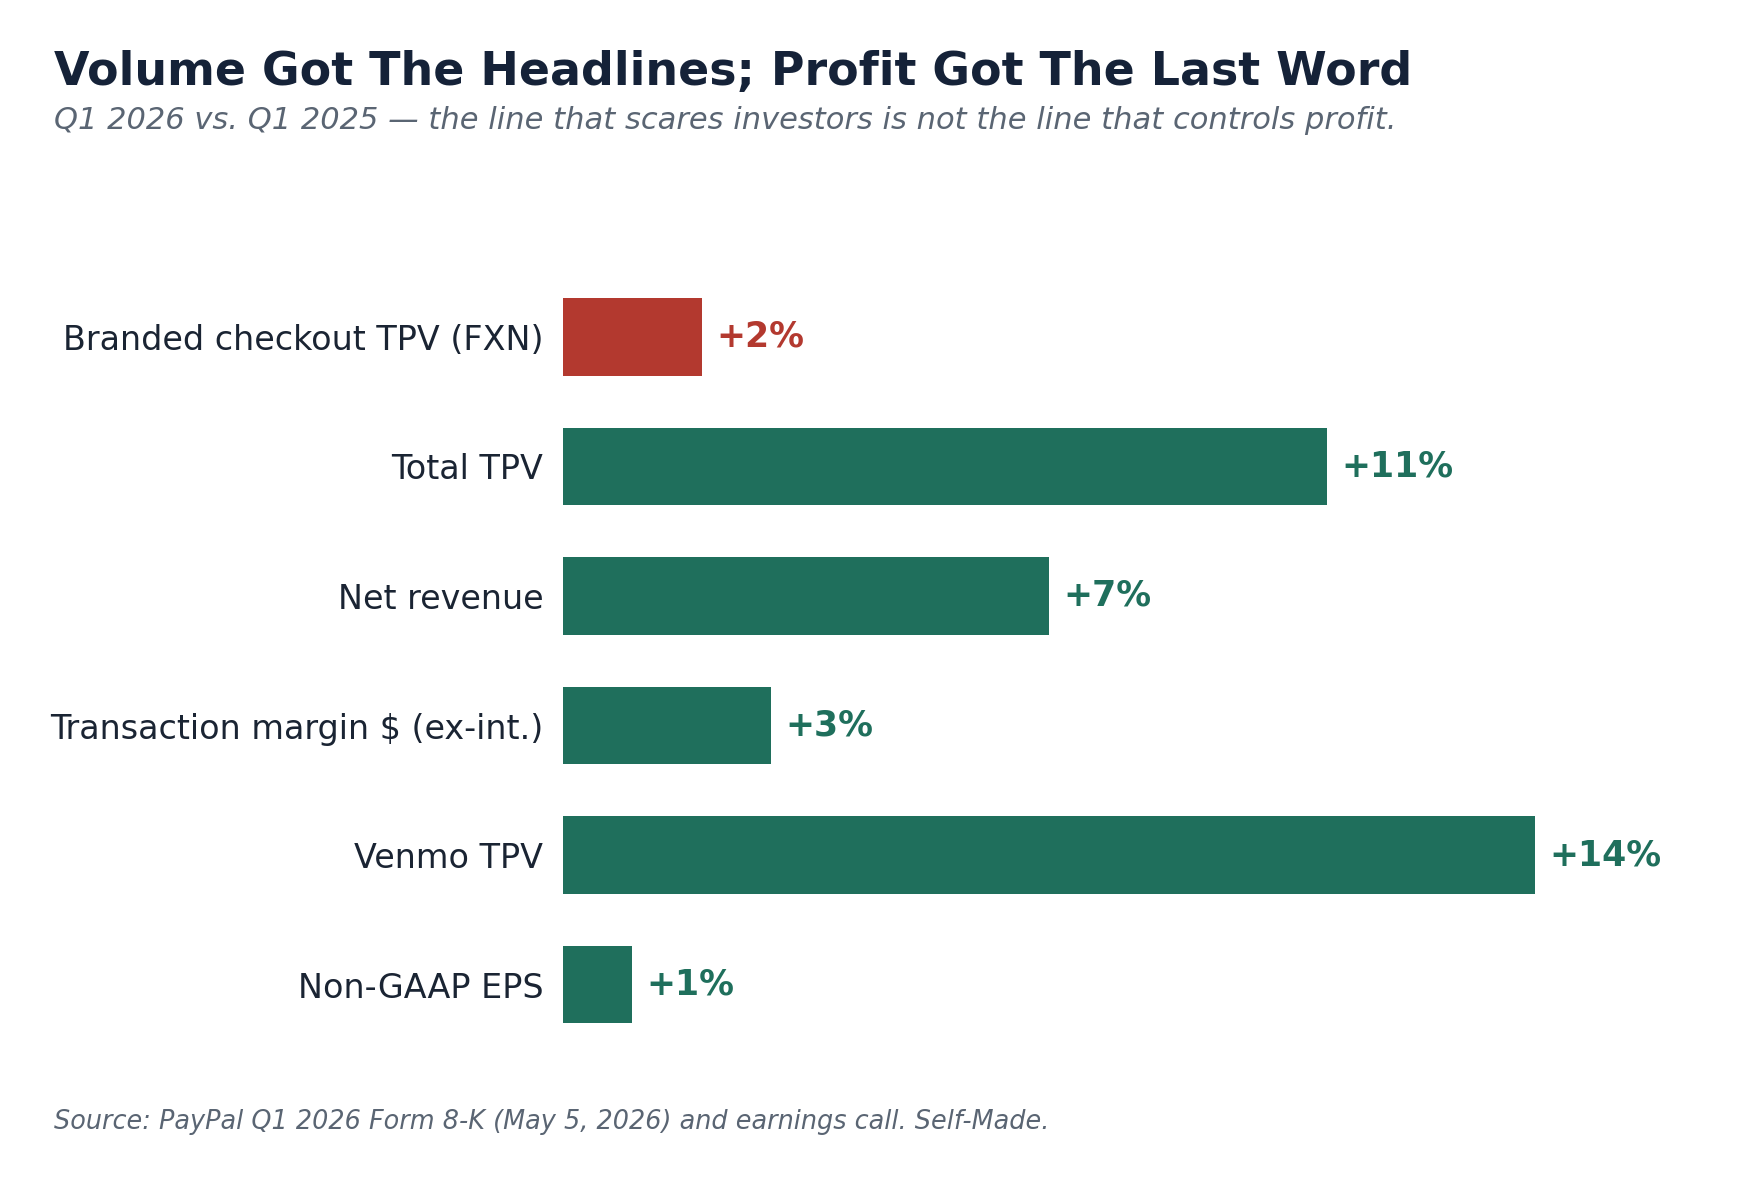
The numbers that matter. For the quarter ending March 31, 2026, the company reported net revenues up 7% to $8.4B and total payment volume up 11% to $464.0B — non-GAAP EPS rose 1% to $1.34, ahead of the ~$1.32 consensus, while GAAP EPS fell 6% to $1.21. That GAAP-vs-non-GAAP gap is the first tell: it was driven almost entirely by a ~$0.08 mark-to-market hit on strategic investments and crypto, not by operations. Transaction margin dollars excluding interest on customer balances — the company's own preferred measure of economic value — increased 3% to $3.54B. The branded-checkout volume line is the headline that bears watch, and it did roughly what every bear feared: branded-checkout TPV grew just 2% on a currency-neutral basis. At the same time, transaction margin dollars grew, Venmo TPV accelerated to 14%, and PSP volume re-accelerated to 11%. This is your one-line thesis: checkout soft, transaction profit up.
Three falsehoods promoted by the consensus. One, the "checkout cliff" is modeled as a profit cliff, but net transaction margin on a two-sided payments network grew 3% in Q1 even with the checkout drag, as Venmo, the payment-service-provider (PSP) book, and credit more than made up for it. Two, the Venmo and PSP growth engines — compounding in the mid-teens and now reported as distinct businesses — were effectively written to a no-growth multiple, while the Street pays full price for the checkout decline and nothing for the growth optionality. Three, the ~$6B-a-year self-funded buyback retiring roughly a tenth of the float annually is a structural per-share tailwind that consolidated-P/E models bury in the blob. Our work is built around three highly needed — but almost entirely unutilized in sell-side work — analytical frames (a profit-vs-volume mechanism inside checkout; an option frame on the Venmo/PSP growth engines; a free-cash-flow yield and buyback floor), closes with that buyback floor, and falsifiable risks. Price Target: 12-month $62; multi-year intrinsic value of $80+. Rating: BUY.
What The Market Believes vs. What The Data Actually Shows
This bear case boils down to five statements. Branded checkout is in structural decline to Apple Pay, Google Pay and Shop Pay. Management is hiding behind "macro" to explain share loss. Transaction margin is being propped up only by interest income that fades as rates fall. The new-CEO reorganization is a rearranging of deck chairs. And fintech disruption is a permanent overhang. The strongest version of this case is well argued — see, for instance, this piece arguing checkout is bleeding share while management blames macro. All of these are easily verifiable against PayPal SEC filings rather than narrative; and the first two — the ones that actually drive the multiple — are those most directly negated by a Q1 2026 print.
I do it the bottom up, using a sum-of-the-parts basis first, and take on the three most important pieces in order — the profit-vs-volume mechanism inside checkout, the mispriced Venmo/PSP growth engine, and the buried free-cash-flow yield. The single-multiple analysis lumps a stabilizing branded-checkout franchise, two mid-teens growers, and a 17%-FCF-yield capital-return machine into one number. This conflation is by itself an important source of wrong pricing.
Forensic #1: The Checkout Cliff Is A Profit Engine in a Disguise
In PYPL models branded-checkout volume is the single biggest proxy for the profit of the company. It is not. What pays the bills is transaction margin dollars — net revenue minus transaction expense and transaction and credit losses — and that figure grew in Q1 2026 despite the soft checkout line. PayPal still operates one of the largest two-sided checkout networks in digital commerce, and at that scale incremental profit comes from monetization and loss control as much as from raw volume, historically outpacing the rate of volume softness in any single product line.
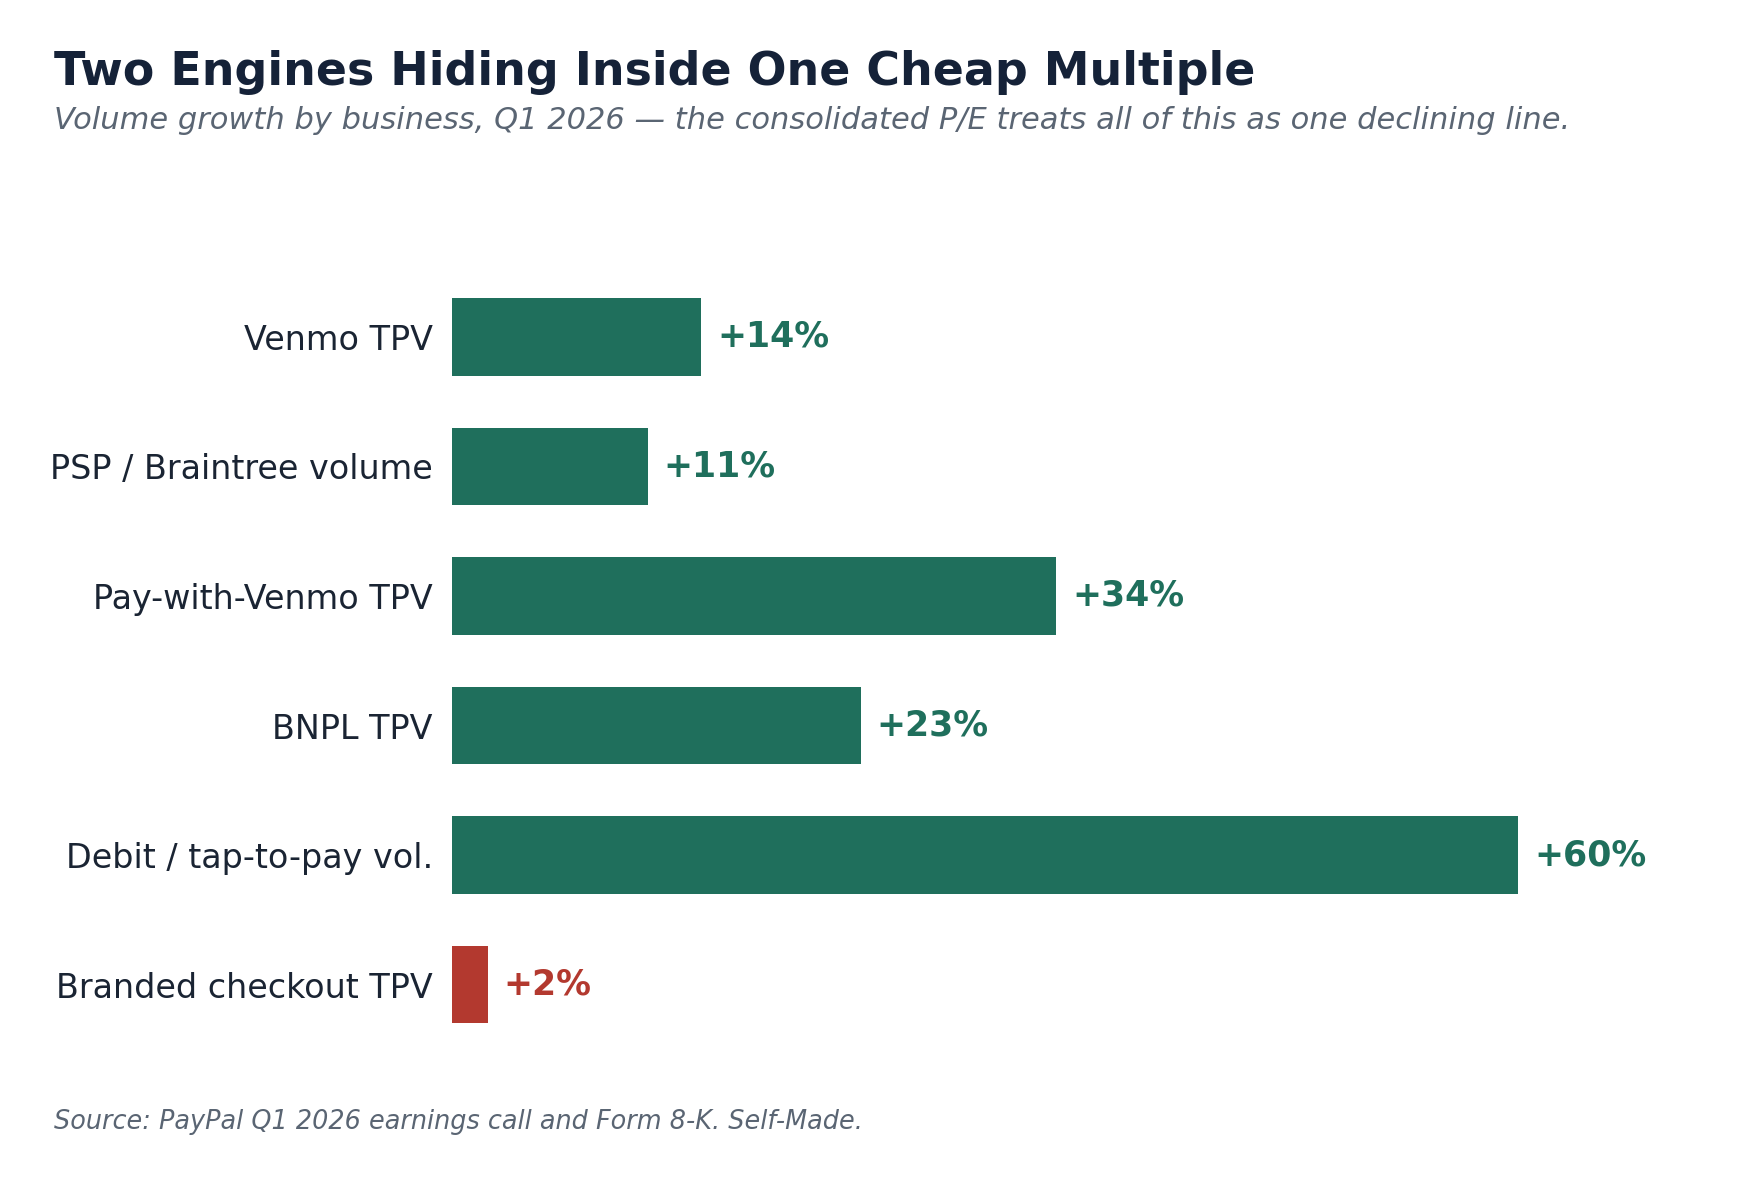
The mechanism, in three steps. First, branded checkout is stabilizing rather than collapsing: branded-checkout TPV grew 2% on a currency-neutral basis, up from 1% the prior quarter, and adjacent in-store products are inflecting — debit-card and tap-to-pay volume rose ~60% year over year, while Buy Now Pay Later and Pay-with-Venmo TPV grew 23% and 34% respectively. Second, the profit mix is shifting toward higher-quality dollars: transaction margin dollars ex-interest grew 3% in Q1, with management attributing the growth to credit performance, Venmo monetization, PSP profitability, and loss improvement across products. Third, the margin management is not only about revenues — a $1.5B cost-savings program supports margins underneath the revenue line during this transition, which is why the company can guide EPS flat-to-positive for the year while still funding heavy reinvestment in checkout.
The arithmetic. Q1 2026 branded-checkout TPV grew just 2% currency-neutral, total TPV grew 11%, net revenue grew 7%, and transaction margin dollars ex-interest grew 3%. Extrapolate that dynamic to the full year: even on management's reaffirmed guidance of transaction margin dollars roughly flat-to-slightly-down ex-interest, the profit trend holds while the buyback compounds per-share value, because realized profit per active relationship outran the checkout-volume headline. It is the same insight that justifies higher-quality network theses elsewhere — in other words the market looks at the checkout-volume headline and prices a profit collapse which is then mechanically prevented by Venmo, PSP and credit. The honest caveat — this works until it does not work. The model breaks the day branded checkout turns outright negative and the offsets stop offsetting, pushing transaction margin dollars into sustained decline. But Q1 2026 was not the day, the trend in checkout is improving (1%→2%), and management's recent reaffirmed guidance says that 2026 will also not be the year — at least, in any economically meaningful capacity.
The forensic finding: consensus is buying the checkout-volume line and neglecting the transaction-profit line. The PayPal franchise is not a burning platform — it is a high-margin network with a self-funded buyback escalator, and the 3% Q1 transaction-margin growth demonstrates that the escalator still works.
Forensic #2: The Venmo & PSP Engine The Market Marked To Zero
The market did what markets do with one ugly headline: it applied a low-growth multiple to the whole company. That is the mispricing. A soft branded-checkout line and a no-growth company are not the same, while Venmo and contract-style payment processing have quietly been working.
What is actually printing. Venmo TPV for Q1 2026 accelerated to 14% year over year — its sixth consecutive quarter of double-digit growth — monetized through Pay-with-Venmo, the Venmo debit card, and instant transfers. The PSP business (largely Braintree, the unbranded rails behind enterprises) re-accelerated to 11% volume growth, with enterprise volume up in the mid-teens, after management deliberately repriced low-margin volume to make it profitable. On a separate note, PayPal's April 2026 reorganization makes this legible for the first time: the company is now run as three businesses — Checkout Solutions & PayPal, Consumer Financial Services & Venmo, and Payment Services & Crypto — so a sum-of-the-parts is no longer an analyst's abstraction but the company's own operating structure.
The honest other side. This is where the thesis has to be looked out for, because the bear actually has real bullets in their gun. Branded checkout — still the largest profit pool — has lost engagement share to Apple Pay, Google Pay and Shop Pay in lower-friction online flows, and trailing-twelve-month transactions per active account ex-PSP, while positive, mask a maturing core. The Venmo/PSP "option" here is not about "PayPal wins the checkout-button war" — that fight is genuinely contested. Your range is smaller and more defense-ready: two double-digit growers sitting inside a company valued as if nothing grows, with the FY2026 reorganization and a new CEO creating a credible path to surfacing that value. The market is pricing the whole company as a declining wallet; the results are for two profitable, expanding engines bolted to that wallet. The space in between those two is the free option.
Frame it conservatively. Even if Venmo and PSP are only credited fractionally for the growth they are printing — collectively worth a re-rating of even a few turns of multiple versus the no-growth label a pure checkout-runoff model implies — that roughly represents meaningful per-share value consensus is leaving on the table.
Forensic #3: The Free-Cash-Flow Yield Hidden Behind A "No-Growth" Label
The third mistake is not analytical, but rather structural: a no-growth label gets attached to a business throwing off a free-cash-flow yield that is anything but a no-growth yield. PayPal generated $6.8B of free cash flow in 2024 and, on a trailing-twelve-month basis through Q1 2026, returned roughly $6.0B to shareholders by repurchasing about 100 million shares. That amounts to a free-cash-flow yield near 17% against a ~$39.5B market cap, with a buyback alone equal to roughly 15% of the market cap.
Why this matters for the multiple. Share count fell from 920 million at year-end 2025 to 892 million at March 31, 2026 — a ~3% reduction in a single quarter, and a trailing pace closer to a 10% annual reduction of the float. At a flat business that mechanically grows EPS ~10% a year; at a business where transaction profit is also rising low-single-digits, it compounds. The balance sheet supports it: $13.5B in cash and investments against $11.6B in debt, i.e. a net-cash position, with a $15B authorization still in place. The dividend, initiated recently at $0.14 per quarter, is a rounding error against the buyback — and, no, the cash is not stuck; it is a source of per-share accretion and balance-sheet flexibility that the consolidated multiple does not give credit.
PayPal's Actual Value: Sum-Of-The-Parts
The multiple applied tends to be one multiple, to consolidated EPS. This mixes a stabilizing checkout franchise, two mid-teens growers, and a 17%-FCF-yield capital machine into one number, systematically underestimating the cash engine. A free-cash-flow-based sum-of-the-parts provides an answer that is materially different.
| Component | Basis | Value |
|---|---|---|
| Operating business (whole) | ~$6.0B run-rate FCF, 10–12x | $60–72B |
| Plus: net cash | $13.5B cash & inv. − $11.6B debt | $1.9B |
| Equity value | ≈ 882M shares | $62–74B |
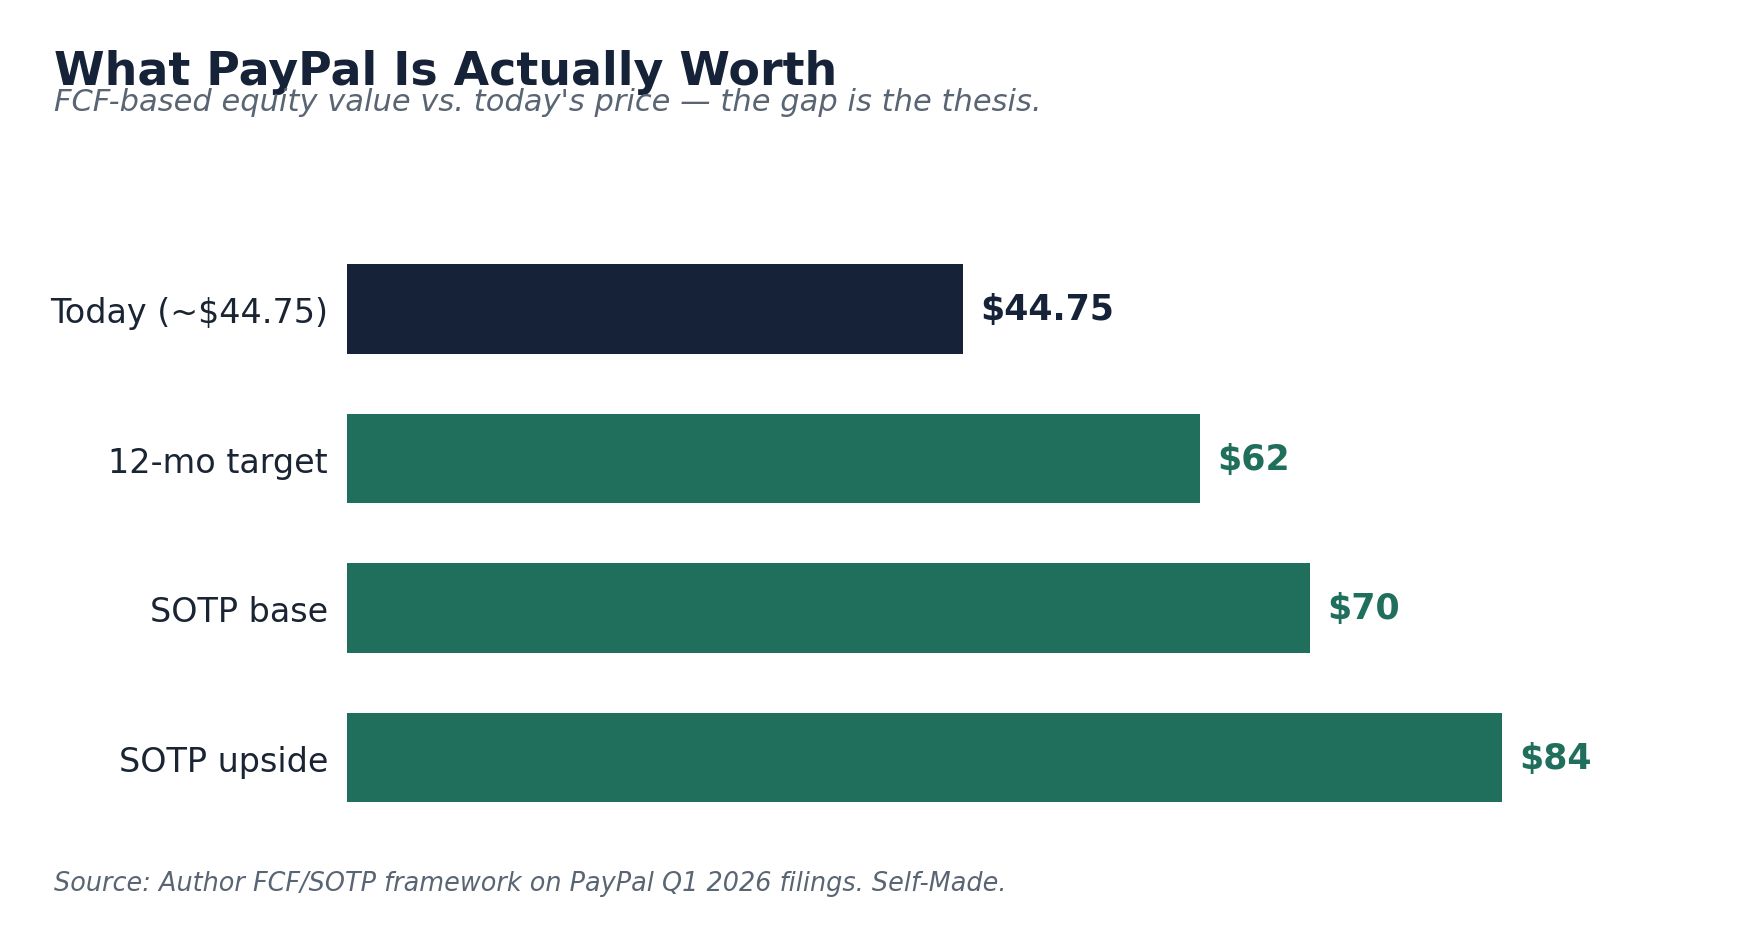
| Per share | Base → upside | $70–$84 |
Source: PayPal Q1 2026 Form 8-K (May 5, 2026) for FCF, balance sheet and share count; FY2024 DEF 14A for $6.8B FCF; author FCF/SOTP framework. A 10–12x FCF multiple is conservative for a net-cash business with two double-digit growth engines, reflecting genuine checkout-share risk. Self-made.
The arithmetic. A 10–12x multiple on ~$6.0B of run-rate free cash flow yields a $60–72B enterprise value; adding ~$1.9B of net cash gives $62–74B of equity, or roughly $70–$87/shr on a ~882M share count. The current ~$44.75 is below even the low end of that range, ahead of any re-rating in the growth engines toward network multiples. The $62 12-month target reflects the shrinking SOTP gap as Q2/Q3 prints remain consistent with transaction-margin growth on soft checkout volume; the multi-year $80+ figure assumes the Venmo/PSP engines get separately credited and the buyback continues to grind down share count.
The Buyback Floor — A Self-Perpetuating Demand Source
The primary moat that mitigates PYPL's biggest downside risk is actually the cash-return machine itself. At roughly $6.0B of annual buyback against a ~$39.5B market cap, PayPal is retiring close to a tenth of its own float every year — a structurally price-insensitive bid that does not care about the checkout-share news cycle. The company carries a $15B repurchase authorization behind a net-cash balance sheet, and the dividend initiated at $0.14 per quarter is incidental against the repurchase — this is a buyback story, and the buyback is self-funded by ~$6.8B of free cash flow.
What this means in plain English: a lower price simply means more shares retired per dollar, which accelerates per-share value creation precisely when sentiment is worst. That is the fintech equivalent of a dividend-growth floor: as long as free cash flow holds near recent levels, the share count falls fast enough to grow EPS even if transaction profit merely treads water. It gives you a self-reinforcing floor — the buyback mechanically raises EPS even as the market argues about the checkout button — and this is why a business the market has labeled "ex-growth" has a credible path to double-digit EPS growth.
Risks: What Would Break The Thesis
First, checkout share loss turns into profit loss. That nags the whole Forensic #1, which is predicated on Venmo, PSP and credit offsetting checkout softness. But if any quarter post the report shows branded-checkout TPV growth rolling back toward zero or negative while the offsets fade — pushing transaction margin dollars ex-interest negative — this network framing is less compelling and we would factor in a target cut. Keep an eye on the quarterly transaction-margin and per-active-account lines and any commentary from mgmt on engagement. The likely accelerants are Apple Pay and Shop Pay in mobile flows.
Second, the interest tailwind reverses faster than the engines scale. A chunk of recent revenue is interest earned on customer balances, which falls with rates. The company reports transaction margin excluding interest precisely so this can be tracked; if rates fall and Venmo/PSP do not scale into the gap, near-term EPS compresses. Management already guides a ~9% Q2 EPS decline partly for this reason — the thesis tolerates a soft Q2; it does not tolerate a soft Q2 that becomes a soft year.
Third, execution under new leadership disappoints. The thesis leans on a credible turn under CEO Enrique Lores (effective March 2026) and the three-business reorganization. A reorg that adds cost without surfacing the Venmo/PSP value would leave the consolidated discount intact. The counter is that even a no-execution PayPal is a ~17% FCF yield retiring 10% of its float a year — the downside is buffered by the buyback while you wait.
The stock has absorbed two events without imperilling the thesis: the leadership transition to Enrique Lores as of March 2026 (a board-chair-to-CEO appointment, a continuity move rather than a strategic rupture); and the April 2026 reorganization into three businesses (already announced and largely behind the company). And each of the three core claims is independently testable and will print evidence over the next 2–4 quarters.
Conclusion and Investment Recommendation
PayPal Holdings (PYPL) is one of those rare stocks in which the headline that terrifies investors — branded checkout losing share — is also the same headline shown by the data that does not, by itself, drive profits. After all, Q1 2026 settled the central question: branded-checkout TPV grew just 2%, yet transaction margin dollars grew 3%, Venmo grew 14%, and PSP grew 11%. The profit engine still works. Adding to that mechanical reality are two mispriced add-ons — two double-digit growth businesses the market has buried inside a single low-growth multiple, and a self-funded ~$6B buyback retiring roughly a tenth of the float annually at a ~17% free-cash-flow yield.
The $70–$84 sum-of-the-parts is also conservative to some degree compared to today at ~$44.75, while the capital-return case is a solid standalone: a net-cash balance sheet, a $15B authorization, and a buyback that mechanically compounds per-share value while the market argues about the checkout button. This isn't a thesis of "broken fintech left for dead" — it is that the consolidated multiple is mispricing the company's own newly disclosed structure, reading three distinct businesses as one declining wallet. Rating: BUY. 12-month price target: $62. Multi-year intrinsic value: $80+.
Disclaimer: This is not investment advice; this article is intended for informational purposes only. The author may have positions in any securities discussed. Readers should do their own research and due diligence. Source: All figures derived from PayPal SEC filings (Q1 2026 Form 8-K dated May 5, 2026; Form 10-Q for the period ended March 31, 2026; FY2024 DEF 14A) and public market prices as of late May 2026.

Sandeep Gupta
Independent equity research analyst publishing forensic theses on US-listed stocks. MBA, Politecnico di Milano (Milan, Italy).
Get new research in your inbox
Subscribe to receive forensic equity research the moment it's published. Free, no spam.
Related Research
 APO
APO Apollo Hit $1 Trillion In AUM With Record FRE — The Epstein Discount Is Wildly Mispriced (APO)
 C
C Citigroup Already Cleared Its 2026 RoTCE Target — Why Is It Still Priced Like A Turnaround? (C)
 O
O
Discussion
Be the first to comment.