
Investment Thesis
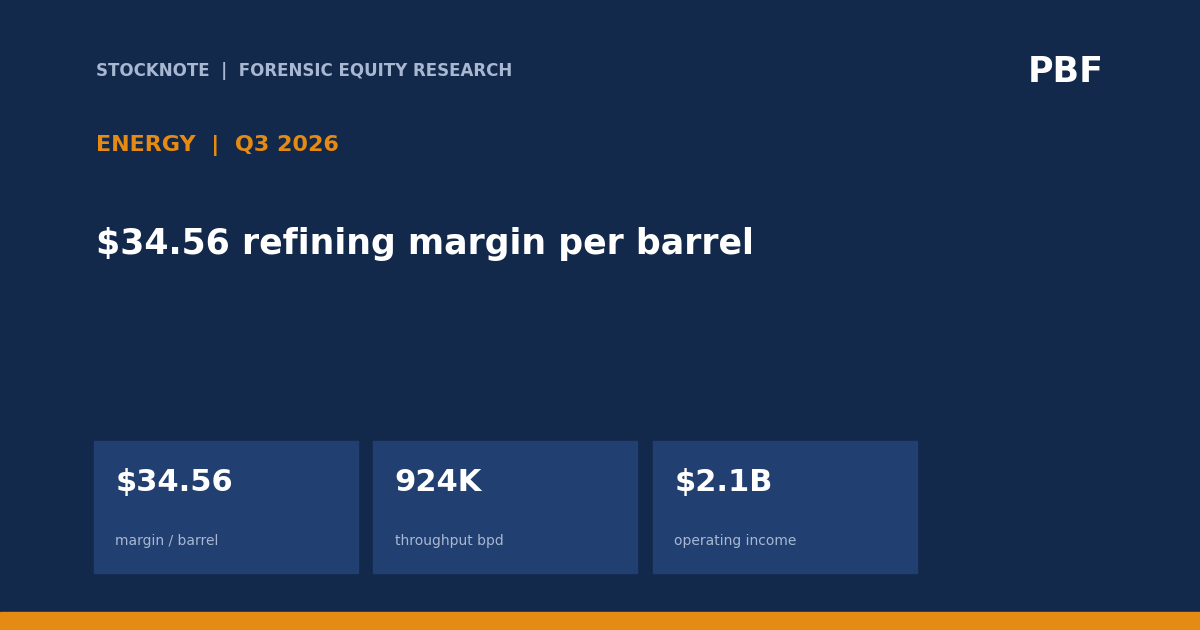
PBF Energy reported Q3 2026 revenue of $12,132.8M and operating income of $2,100.9M, versus $285.9M a year earlier. The operating engine was unit margin: adjusted gross refining margin rose to $34.56 per barrel from $9.00, while throughput rose only 6.1% (d). This extends the same refining-led pattern discussed in “Oil Majors Q3 2026: Refining Margins, Not Crude, Drove ExxonMobil And Chevron Profit,” but PBF is a pure refiner and therefore shows the effect with much higher sensitivity.
- Revenue. $12,132.8M versus $7,651.1M, +58.6% (d).
- Unit margin. Adjusted gross refining margin $34.56/barrel versus $9.00.
- Throughput. 923.8K barrels/day versus 871.0K, +6.1% (d).
- Profit. Operating income $2,100.9M versus $285.9M; adjusted fully converted EPS $12.78.
- Balance sheet. Quarter-end cash $2.5B versus debt $2.1B; dividend raised 18% to $0.325.
- This article contains no rating, price target or investment advice. Derived figures are marked (d).
Bottom line. The quarter is mostly a spread story. More barrels helped, but the $25.56 per-barrel increase (d) in adjusted refining margin was far larger than the 6% throughput gain. The risk is mean reversion, not execution.
Source: PBF Energy Q3 2026 earnings release (8-K Ex. 99.1).
Q3 2026 At A Glance
| Measure | Q3 2026 | Q3 2025 |
|---|---|---|
| Revenue | $12,132.8M | $7,651.1M |
| Operating income | $2,100.9M | $285.9M |
| Adjusted EPS | $12.78 | -$0.52 |
| Throughput | 923.8K bpd | 871.0K bpd |
| Adjusted refining margin | $34.56/bbl | $9.00/bbl |
| Refining opex | $7.80/bbl | $7.35/bbl |
Source: PBF Energy Q3 2026 earnings release (8-K Ex. 99.1). Derived figures are marked (d).
What The Market Believes vs. What The Data Actually Shows
| Belief | What the data show |
|---|---|
| Profit growth came from higher refinery utilization | Throughput rose 6.1% (d), while adjusted margin per barrel rose 284% (d). |
| Higher crude prices hurt the refiner | WTI rose to $86.08 from $65.07, but product spreads expanded enough to lift refining margin sharply. |
| The accounting adjustments created the profit | Adjusted operating income was $2,111.9M, only $11.0M (d) above GAAP operating income. |
| The dividend increase signals a permanent earnings base | The dividend rose 18%, but refining margins are cyclical and can reverse much faster than fixed payouts. |
Forensic #1: Volume Versus Unit Margin
Refining profit is approximately barrels processed multiplied by margin per barrel, less fixed and corporate costs. Separating volume from margin shows which input did the work.
| Driver | Q3 2025 | Q3 2026 | Change |
|---|---|---|---|
| Throughput (K bpd) | 871.0 | 923.8 | +6.1% (d) |
| Adjusted refining margin/bbl | $9.00 | $34.56 | +284% (d) |
| Refining opex/bbl | $7.35 | $7.80 | +6.1% (d) |
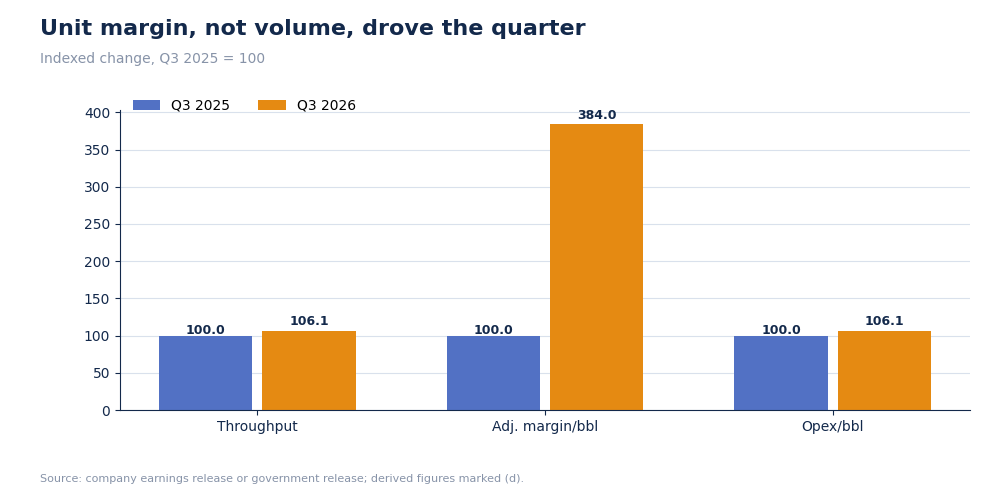
PBF throughput, adjusted refining margin and operating cost
Throughput and operating cost per barrel both rose about 6%, but adjusted unit margin nearly quadrupled. That makes the quarter a commodity-spread windfall rather than a volume-leverage quarter.
Why it matters. Unit margin is the variable most likely to mean-revert, so current EPS should not be annualized mechanically.
Source: PBF Energy Q3 2026 earnings release (8-K Ex. 99.1)
Forensic #2: Regional Refining Margins
Different refinery systems see different crude slates, transport economics and product markets. Regional margin dispersion identifies where the windfall was strongest.
| System | Q3 2025 | Q3 2026 | Change (d) |
|---|---|---|---|
| East Coast | $8.14 | $33.54 | +$25.40 |
| Gulf Coast | $10.18 | $27.61 | +$17.43 |
| Mid-Continent | $11.03 | $36.86 | +$25.83 |
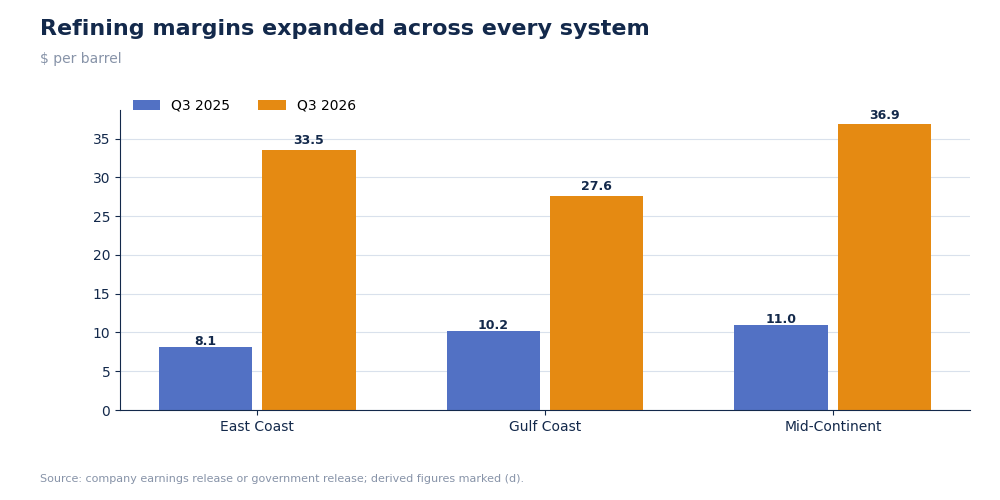
PBF adjusted refining margin per barrel by region
Mid-Continent had the highest absolute margin at $36.86 per barrel, while East Coast showed almost as much year-over-year expansion. Gulf Coast improved but lagged both.
Why it matters. A consolidated average can hide where feedstock and product logistics create the economic advantage.
Source: PBF Energy Q3 2026 earnings release (8-K Ex. 99.1)
Forensic #3: Profit Bridge And Adjustment Size
When GAAP and adjusted profit are close, the earnings surge is less dependent on management exclusions.
| Measure | Q3 2025 | Q3 2026 |
|---|---|---|
| GAAP operating income | $285.9M | $2,100.9M |
| Adjusted operating income | -$27.1M | $2,111.9M |
| GAAP EPS | $1.45 | $12.54 |
| Adjusted EPS | -$0.52 | $12.78 |
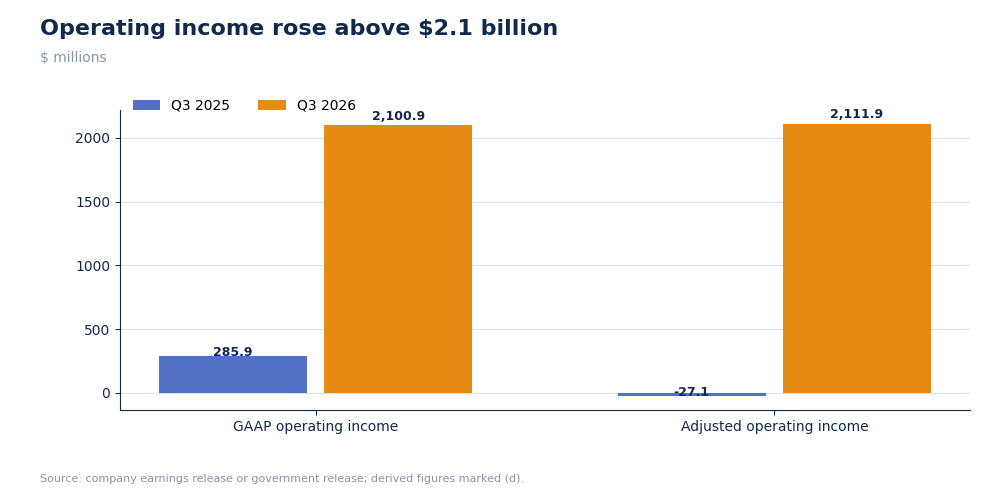
PBF GAAP operating income and adjusted fully converted result
The Q3 2026 operating adjustment was only $11.0M (d), about 0.5% of adjusted operating income (d). The prior-year adjusted loss despite GAAP profit shows that the 2025 period contained larger favorable special items.
Why it matters. The 2026 profit is economically broad in the release, but its cyclicality remains the central quality issue.
Source: PBF Energy Q3 2026 earnings release (8-K Ex. 99.1)
Forensic #4: Capital, Debt And The Dividend
Cyclical companies should return capital only after funding maintenance and protecting liquidity. Net cash is a better anchor than a single-quarter payout ratio.
| Item | Q3 2026 |
|---|---|
| Cash | $2.5B |
| Total debt | $2.1B |
| Net cash | $0.4B (d) |
| Quarterly dividend | $0.325/share |
| Dividend increase | 18% |
| Capital expenditures | $176.5M |
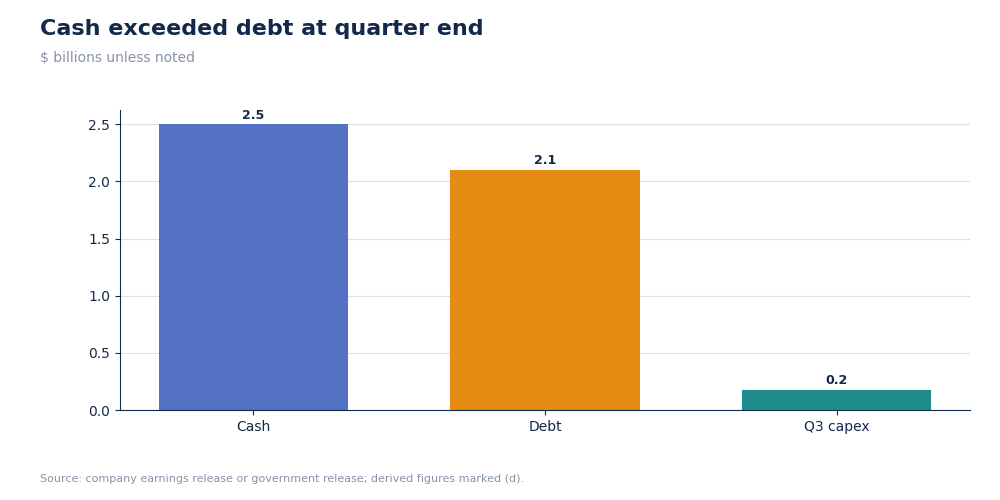
PBF quarter-end cash, debt and Q3 capital expenditures
Cash exceeded debt by about $0.4B (d), giving PBF room to raise the dividend. Still, one quarter of high margins can reverse, and a recurring dividend creates a fixed claim on future cash.
Why it matters. A strong balance sheet makes the payout safer, but it does not make the refining cycle permanent.
Source: PBF Energy Q3 2026 earnings release (8-K Ex. 99.1)
Valuation Snapshot
At $75.08 per share, PBF had a market capitalization of $9.22B and a reported trailing P/E of 3.34x. After subtracting $0.4B of net cash (d), enterprise value is about $8.82B (d). Annualizing Q3 produces superficially extreme multiples because refinery margins were near a cyclical peak.
| Measure | Value |
|---|---|
| Share price | $75.08 |
| Market capitalization | $9.22B |
| Enterprise value | $8.82B (d) |
| Reported trailing P/E | 3.34x |
| EV / annualized Q3 revenue | 0.18x (d) |
| EV / annualized Q3 operating income | 1.05x (d) |
| Annualized dividend yield | 1.73% (d) |
Investment read-through. A 1.5x P/E on annualized Q3 GAAP EPS (d) is not evidence of permanent cheapness; it is evidence that the market expects refining margins to normalize. If operating income fell 60% from the Q3 annualized rate, EV/operating income would rise from 1.05x to 2.62x (d). The valuation debate is almost entirely about the sustainable margin per barrel.
What has to be true. Product cracks must remain structurally above the 2025 base and PBF must convert the current net-cash position into through-cycle shareholder returns.
Source: Market quote, market capitalization and trailing P/E from the in-session U.S. equity market feed; balance-sheet and operating data from PBF's Q3 2026 release. Market data: latest quote retrieved after the November 2, 2026 U.S. trading session.
Risks: What Would Break The Thesis
- Crack-spread reversal. Unit margin can fall quickly.
- Higher opex. Refining expense rose to $7.80 per barrel.
- Operational outages. Throughput and margin depend on refinery availability.
- Capital intensity. Q3 capex was $176.5M, excluding insured Martinez rebuild costs.
The thesis would be too cautious if structural capacity constraints keep product spreads elevated for several years.
What To Watch Next
- Adjusted refining margin against $34.56 per barrel.
- Throughput against 923.8K barrels per day.
- Refining opex against $7.80 per barrel.
- Cash and debt after capital returns.
- Regional margin dispersion, especially Mid-Continent.

Sandeep Gupta
Independent equity research analyst publishing forensic theses on US-listed stocks. MBA, Politecnico di Milano School of Management (Milan, Italy).
Get new research in your inbox
Subscribe to receive forensic equity research the moment it's published. Free, no spam.
Discussion
Be the first to comment.