

SECTORS TODAY
Tech XLK -2.95%
Financials XLF +1.86%
Healthcare XLV -0.15%
Energy XLE -3.96%
Industrials XLI +1.38%
Cons. Disc. XLY +2.41%
Cons. Staples XLP +1.58%
Utilities XLU +0.55%
Materials XLB +1.76%
Real Estate XLRE +1.09%
Comm. Svcs XLC +0.36%

Company · PBF

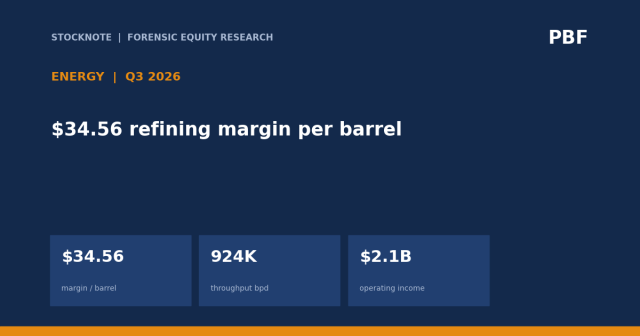
refining margin

Energy · 1 research article

Compare with KMI Screener

1Articles
0Earnings releases
6Topics
Nov 3, 2026Latest research
PBF
PBF Energy Inc. · NEW YORK STOCK EXCHANGE, INC.
Energy · US · IPO 2012
$75.08
▼ -2.92 (-3.74%)
Day range
$74.74$79.00
52-week range
$25.62$92.46
Open$76.69
Prev close$78.00
Day low$74.74
Day high$79.00
52-week high$92.46
52-week low$25.62
Market cap$9.2B
Avg volume2.8M
P/E (TTM)6.83
EPS (TTM)$11.26
Div. yield2.22%
Beta0.11
Revenue growth+13.54%
Net margin3.9%
ROE24.1%
Shares out.121.3M

Delayed up to 15 min · Source: Finnhub · Not investment advice

Our research on PBF

Compared with similar companies

Screener →
CompanyViewRevenue YoYEPS YoYGuidanceLast report
PBF refining margin LONG — — — —
KMI Kinder Morgan LONG +9% +21% — Oct 21, 2026 Compare
XOM ExxonMobil LONG — — — Oct 30, 2026 Compare

Growth figures are year-over-year changes extracted automatically from each company's latest earnings release and can contain errors.

Market data

Widgets by TradingView. They load only when you click, so the page stays fast.

Get new research in your inbox

Forensic equity research on US stocks. No spam, unsubscribe anytime.