
Investment Thesis
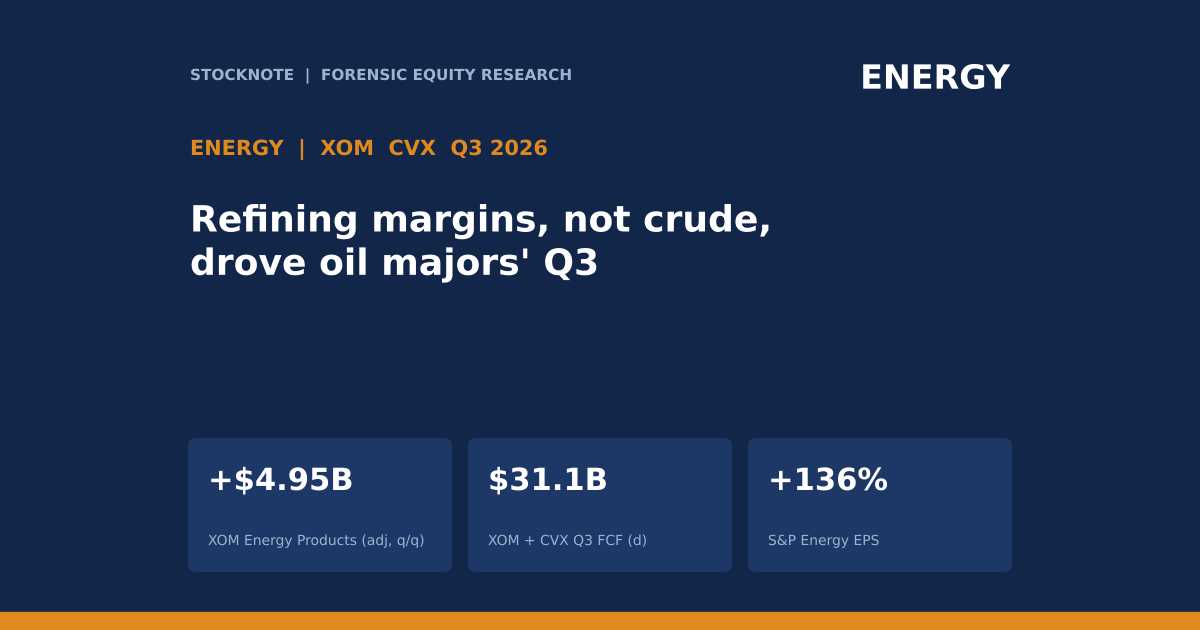
Energy is the fastest-growing sector in the S&P 500 this earnings season, with blended EPS up 136.0% according to FactSet. The two largest US oil companies show where it came from. ExxonMobil's third-quarter adjusted earnings rose $2.8 billion from the second quarter to $17.5 billion, but its upstream (oil and gas production) earnings fell $1.9 billion and the whole increase came from Energy Products (refining and fuels), up $5.0 billion. Chevron's picture is similar: realised crude prices fell from the second quarter, upstream earnings fell from $8.2B to $5.7B, and downstream held at $4.9B. This article uses the integrated-oil structure to explain which part of the energy windfall is a crude price effect and which is a refining margin effect, and why that distinction matters for what comes next.
- ExxonMobil. 3Q26 earnings $15.4B GAAP and $17.5B adjusted (EPS $3.72 and $4.23); cash flow from operations $25.65B; free cash flow $19.1B; capex $7.0B; distributions $9.4B ($4.3B dividends, $5.1B buybacks); net debt $22.1B. Production 4,496 thousand oil-equivalent barrels a day (4,514 in 2Q26).
- Chevron. 3Q26 earnings $9.9B GAAP and $10.4B adjusted (EPS $5.06 and $5.28); cash flow from operations $16.0B; free cash flow $12.0B; capex $4.0B; net debt fell $7.8B in the quarter. Production 3,980 thousand barrels of oil equivalent a day (4,070 in 2Q26).
- Prices. Brent averaged $97 in Q3 against $104 in Q2 and $69 a year earlier (Chevron). WTI was near $99.99 and Brent near $109.46 on October 27 (Kiplinger).
- Sector. FactSet: Energy EPS +136.0%; Valero had the largest positive EPS surprise ($23.90 against $21.17).
- This article contains no rating, price target or investment advice. Every figure comes from a named source and anything I calculated is marked (d).
Bottom line. Crude prices were lower in the third quarter than in the second (Brent $97 against $104, Chevron), yet both companies reported more downstream profit than a year earlier, and ExxonMobil reported more total profit than in Q2. The windfall is increasingly in refining margins, which are more volatile and more exposed to product-price and capacity conditions than crude realisations. Both companies are also returning cash: ExxonMobil is paying out about half of its free cash flow (49%, d), and ExxonMobil plans $20B of buybacks in 2027.
Sources: ExxonMobil 3Q26 results; Chevron Q3 2026 results (Business Wire text via Finviz); FactSet, Oct 23, 2026; Kiplinger.
Q3 2026 At A Glance
| Metric | ExxonMobil 3Q26 | Chevron 3Q26 |
|---|---|---|
| Earnings (GAAP) | $15,413M | $9,924M |
| Adjusted earnings | $17,505M | $10,361M |
| Adjusted EPS | $4.23 | $5.28 |
| Cash flow from operations | $25,650M | $16.0B |
| Free cash flow | $19,109M | $12.0B (adjusted $14.2B) |
| Capex | $7,002M | $4.0B |
| Production | 4,496 koebd | 3,980 MBOED |
| Net debt | $22.1B | fell $7.8B in the quarter |
| Timing effects (non-cash) | -$2,541M | -$1,580M |
Sources: ExxonMobil; Chevron. Chevron's release reproduces timing effects of $(1,580)M; ExxonMobil's are described as estimates.
What The Market Believes vs. What The Data Actually Shows
| Belief | What the data show |
|---|---|
| Oil company profit tracks the crude price | Brent fell from $104 to $97 between Q2 and Q3 (Chevron), and both companies' upstream earnings fell (Exxon adjusted -$1.9B; Chevron -$2.5B, d), while consolidated profit rose at Exxon. |
| Higher production drives the gain | ExxonMobil's production was 4,496 against 4,514 in Q2 and Chevron's 3,980 against 4,070; volumes were lower, not higher. |
| The earnings are all cash | Both companies report timing effects (-$2.5B at Exxon, -$1.6B at Chevron) that reduced GAAP earnings relative to adjusted earnings in Q3; the extracts I read do not define them, and I treat them as timing differences that reverse, as the Q2 figures of opposite sign suggest. |
| The cash goes to buybacks | ExxonMobil distributed $9.4B against $19.1B of free cash flow (49%, d), and its net debt fell by almost $11B year to date; Chevron's net debt fell $7.8B in the quarter. |
Chevron's production was 3,980 against 4,086 a year earlier (-2.6%, d), although its nine-month production of 3,970 is 9.9% above the 3,614 of the same period of 2025 (d). The release extract does not explain the difference, so I draw no conclusion from it.
Forensic #1: Where ExxonMobil's Increase Came From
| Segment, adjusted earnings ($M) | 2Q26 | 3Q26 | Change |
|---|---|---|---|
| Upstream | 9,189 | 7,308 | -1,881 |
| Energy Products | 4,099 | 9,053 | +4,954 |
| Chemical Products | 1,214 | 725 | -489 |
| Specialty Products | 969 | 1,283 | +314 |
| Corporate and Financing | -791 | -864 | -73 |
| Total | 14,680 | 17,505 | +2,825 |
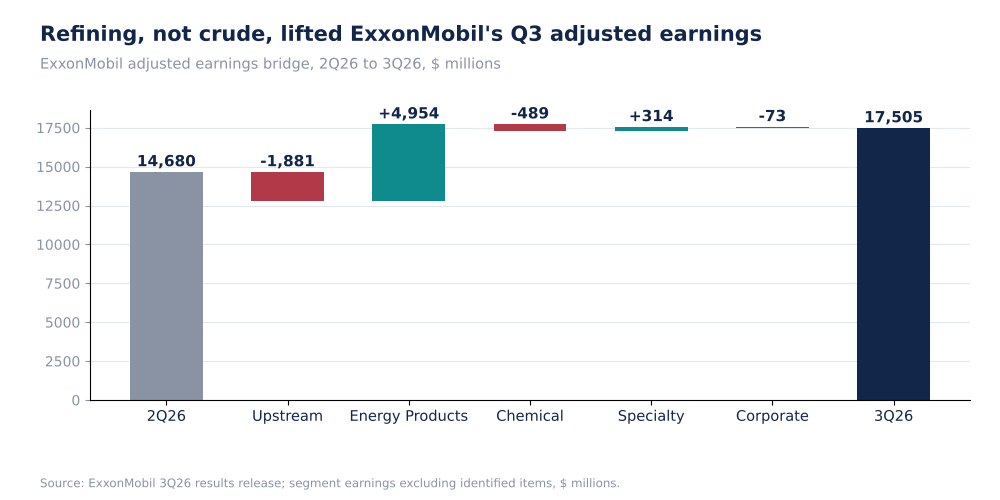
ExxonMobil Adjusted Earnings Bridge, 2Q26 To 3Q26, $ Millions (Self-Made)
Energy Products earned $9.05B in the quarter on a quarter-on-quarter increase of $4.95B, which is 175% of the total increase of $2.83B (d). In other words, if Energy Products had been flat, ExxonMobil's total adjusted earnings would have fallen by about $2.1B (d). The release describes the Energy Products gain as due to higher margins and the Upstream decline as due to lower prices and an accelerated Guyana entitlement effect, without dollar splits.
Why it matters. A refining margin is the spread between product prices and crude cost, so it can widen when product supply is tight, which Kaplan's comments on diesel and damaged Russian refineries (reported by Mitrade) suggest may have been the case, although the company releases do not say so. That is a different risk from the crude price: it depends on the supply of fuels and could narrow quickly if supply returns.
Source: ExxonMobil 3Q26 results. Percentages are my arithmetic (d).
Forensic #2: Upstream Versus Downstream At Chevron
| Segment earnings ($M) | 3Q25 | 2Q26 | 3Q26 | 3Q26 vs 3Q25 (d) |
|---|---|---|---|---|
| Upstream | 3,302 | 8,182 | 5,698 | +73% |
| U.S. upstream | 1,282 | 3,541 | 3,293 | +157% |
| International upstream | 2,020 | 4,641 | 2,405 | +19% |
| Downstream | 1,137 | 4,868 | 4,931 | +334% |
| U.S. downstream | 638 | 2,411 | 3,585 | +462% |
| International downstream | 499 | 2,457 | 1,346 | +170% |
| All other | -900 | -978 | -705 | n/a |
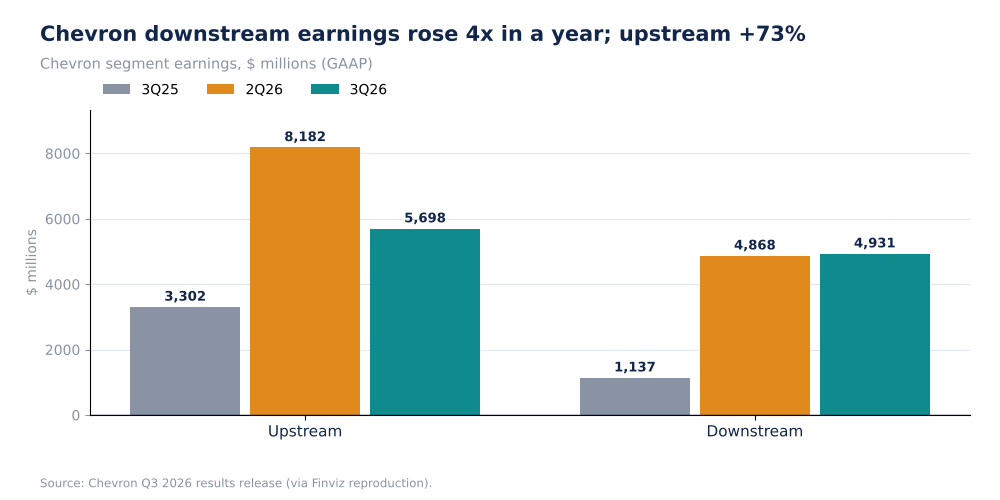
Chevron Segment Earnings, $ Millions (Self-Made)
Downstream earnings were $4.93B against $1.14B a year earlier, more than four times (d), with U.S. downstream up from $0.64B to $3.59B. Downstream was 46% of segment earnings before all-other (d: 4,931 / (5,698 + 4,931)), compared with 26% a year earlier (d: 1,137 / (3,302 + 1,137)). Chevron's U.S. refinery crude inputs were 1,093 thousand barrels a day, up 2.7% from 1,064 a year ago (d), so the gain is overwhelmingly margin, not throughput.
Why it matters. The two companies show the same pattern: an integrated company's refining arm acts as a hedge against lower crude prices (and the reverse), which is why the combined result is less volatile than either piece. Investors in a pure upstream company would have seen only the decline in crude realisations.
Source: Chevron Q3 2026 results. Percentages are my arithmetic (d).
Forensic #3: Prices, Volumes And Timing Effects
| Chevron realizations and Brent | 3Q25 | 2Q26 | 3Q26 |
|---|---|---|---|
| Brent average ($/bbl) | 69 | 104 | 97 |
| U.S. liquids ($/bbl) | 48.12 | 70.80 | 62.72 |
| International liquids ($/bbl) | 63.16 | 96.41 | 86.09 |
| U.S. natural gas ($/MCF) | 1.77 | 0.91 | 1.88 |
| International natural gas ($/MCF) | 6.88 | 7.84 | 9.44 |
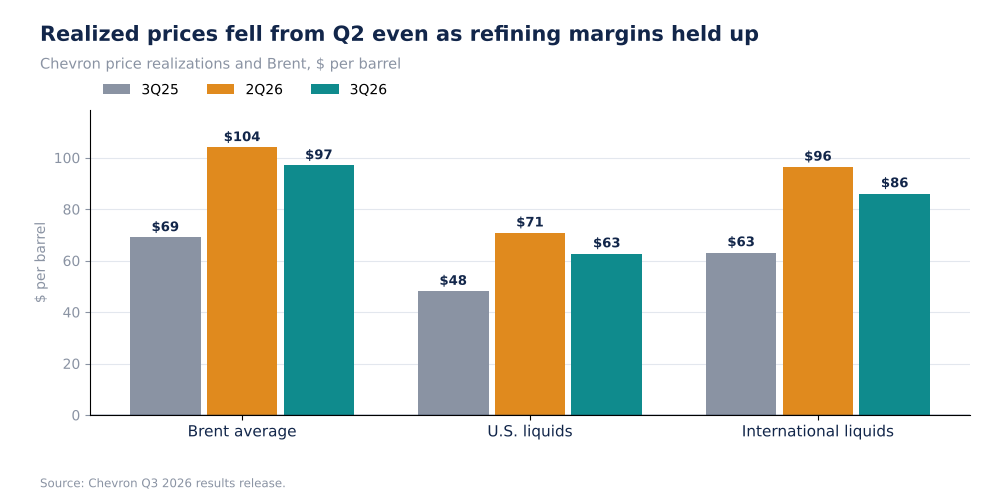
Brent And Chevron Liquids Realizations, $ Per Barrel (Self-Made)
Brent was 40% above a year earlier (d: 97 / 69) but 6.7% below the second quarter (d). Chevron's U.S. liquids realisation was 30% above the year-ago level (d) and 11% below Q2 (d). Timing effects, which the releases show as a separate reconciling item between GAAP and adjusted earnings (the extracts do not define them), were negative in Q3 at both companies (Exxon -$2,541M, Chevron -$1,580M) and positive in Q2 (+$2,483M and +$1,540M). GAAP earnings for ExxonMobil therefore rose by only $0.9B between Q2 and Q3 while adjusted earnings rose $2.8B (d).
Why it matters. Timing effects reverse. The $2.5B headwind at Exxon in Q3 and the $2.5B tailwind in Q2 net to almost zero over the half year (d), so the better measure of underlying performance is the adjusted figure or the average of the two quarters. GAAP earnings are the number that will be reported against estimates in some data sets.
Sources: Chevron; ExxonMobil. Changes are my arithmetic (d).
Forensic #4: Cash Generation And Distribution
| Item (3Q26) | ExxonMobil | Chevron |
|---|---|---|
| Cash flow from operations | $25.65B | $16.0B |
| Capex | $7.0B | $4.0B |
| Free cash flow | $19.1B | $12.0B |
| Capex / cash flow from operations (d) | 27% | 25% |
| Dividends + buybacks | $9.4B ($4.3B + $5.1B) | dividend $1.78/share; buybacks not disclosed in release |
| Net debt | $22.1B | down $7.8B in the quarter |
| Planned buybacks | $20B in 2027 | n/a |
| Combined free cash flow (d) | $31.1B | $31.1B |
The two companies generated $31.1B of free cash flow in the quarter (d: 19.1 + 12.0). Capex consumed only about a quarter of operating cash flow at each (27% and 25%, d), in contrast to the 38% to 54% at the technology hyperscalers in Stocknote's capex article. Chevron's net debt-to-operating cash flow is reported as 0.4 times, and ExxonMobil's net debt of $22.1B is equal to 0.86 times one quarter's operating cash flow (d). Chevron's share count fell from 1,980 million at the end of 2025 to 1,951 million (down 1.5%, d), indicating buybacks.
Why it matters. Both are in a position of surplus: low capex relative to cash flow, falling debt and room for distributions. The question for investors is what the cash flow looks like when the refining margin normalises. A year-to-date view helps: ExxonMobil's 2026 nine-month free cash flow was $39.0B against $20.6B a year earlier (d: +90%).
Sources: ExxonMobil; Chevron. Ratios and sums are my arithmetic (d).
Valuation Snapshot
I did not retrieve share prices for this article, so no multiples are given. The relevant fundamentals are in the tables above; annualising the third-quarter adjusted earnings per share would give $16.92 for ExxonMobil and $21.12 for Chevron (d), but that assumes the refining margin persists and is not a forecast.
What has to be true. For profits to stay at the Q3 level, refining margins have to remain near the level that lifted Energy Products by $5.0B at Exxon and kept Chevron's downstream near $4.9B; Brent has to hold in the high $90s (it was near $109 on October 27, per Kiplinger); and production has to stop declining.
Risks: What Would Break The Thesis
- Margin reversal. A refining margin that mean-reverts would remove most of the quarter's increase at Exxon.
- Crude. Brent was down 6.7% from Q2 and the upstream segments at both companies fell.
- Volumes. Production fell at both from Q2 (Exxon -0.4%, Chevron -2.2%, d).
- Timing effects. They are large (-$2.5B at Exxon) and reverse.
- Geopolitics. Kaplan links diesel and yields to the Iran conflict and Russian refinery damage; a settlement could narrow margins.
- Data limits. I used a reproduction of Chevron's release and not the SEC filing, and no valuation data.
The analysis could be wrong if refining margins are structurally higher, for example because of lasting capacity loss, in which case the downstream contribution would persist.
What To Watch Next
- Refining margins and diesel prices, which carried the quarter.
- ExxonMobil's Energy Products earnings against $9.05B (adjusted).
- Chevron's downstream against $4.93B and its production after the 2Q26 to 3Q26 fall.
- Brent against $97 and the October 27 level near $109.
- The reversal of Q3 timing effects in Q4.
- Distribution policy, including the $20B 2027 buyback plan at ExxonMobil.

Sandeep Gupta
Independent equity research analyst publishing forensic theses on US-listed stocks. MBA, Politecnico di Milano School of Management (Milan, Italy).
Get new research in your inbox
Subscribe to receive forensic equity research the moment it's published. Free, no spam.
Discussion
Be the first to comment.