
Investment Thesis
American Express reported Q3 2026 revenue of $20,062M (+9%) and GAAP EPS of $5.42 (+31%). Adjusted EPS, which removes a $982M gain on the sale of its Global Business Travel Group stake and a $336M restructuring charge, was $4.68 (+13%). A third layer sits beneath that: adjusted pretax income grew only about 1.6% (d), and the gap between that and adjusted net income growth of 11% is mostly a lower tax rate and a smaller provision.
- Revenue and spending. Revenues net of interest expense $20,062M vs $18,426M (+8.9% (d)); billed business $454.0B vs $421.0B (+7.8% (d)).
- Earnings. GAAP net income $3,712M vs $2,902M; adjusted $3,214M (+11%); GAAP EPS $5.42 vs $4.14; adjusted EPS $4.68 (+13%); average diluted shares 674M vs 693M.
- Credit. Provisions $1.0B vs $1.3B (a reserve release against a prior-year build); principal net write-off rate 1.8% vs 1.9%.
- Taxes. Effective tax rate 18.1% vs 24.1%; adjusted-basis rate 17.3% (d).
- Guidance. GAAP EPS $18.30 to $18.60; adjusted EPS $17.60 to $17.90; roughly 10% revenue growth.
- This article contains no rating, price target or investment advice. Derived figures are marked (d).
Bottom line. The business is growing spending at 8% and revenue at 9%, which is healthy. The profit growth rate depends on which line is used: adjusted pretax income grew 1.6% (d), adjusted net income 11%, and GAAP net income 28%. Investors who extrapolate the headline are extrapolating a tax rate and a reserve release.
Source: American Express Q3 2026 earnings release.
Q3 2026 At A Glance
| Measure | Q3 2026 | Q3 2025 | Change |
|---|---|---|---|
| Revenues net of interest expense | $20,062M | $18,426M | +9% |
| Billed business | $454.0B | $421.0B | +8% |
| Pretax income (GAAP) | $4,531M | $3,825M | +18% |
| Net income (GAAP) | $3,712M | $2,902M | +28% |
| Net income (adjusted) | $3,214M | $2,902M | +11% |
| Diluted EPS (GAAP) | $5.42 | $4.14 | +31% |
| Diluted EPS (adjusted) | $4.68 | $4.14 | +13% |
| Effective tax rate | 18.1% | 24.1% | -6.0 pts |
Source: American Express Q3 2026 earnings release.
What The Market Believes vs. What The Data Actually Shows
| Belief | What the data show |
|---|---|
| EPS +31% shows accelerating profit | GAAP includes a $982M pretax gain. Adjusted EPS grew 13%, and adjusted pretax income only 1.6% (d). |
| Spending growth drives profit growth | Billed business grew 7.8% (d) but expenses grew 9% and the provision fell; the adjusted pretax margin was 19.4% (d) of reported revenue vs 20.8% (d). |
| Credit quality is improving | The write-off rate eased 0.1 point, but the provision fell $0.3B (d) mainly because of a reserve release against a prior-year build. |
| Buybacks add little | Average diluted shares fell 2.7% (d), worth roughly 3 points of EPS growth. |
| Q4 will slow | Guidance implies Q4 adjusted EPS of $4.11 to $4.41 (d), above the Q4 2025 base of about $3.53 (d). |
Forensic #1: From GAAP To Underlying Pretax Profit
Non-GAAP adjustments are best tested at the pretax level, before the tax line, because a tax rate change can otherwise masquerade as operating growth. Amex gives enough to rebuild the figure: GAAP pretax income less the gain plus the restructuring charge.
| $ millions | Q3 2025 | Q3 2026 | Change (d) |
|---|---|---|---|
| GAAP pretax income | 3,825 | 4,531 | +18.5% |
| Less: GBTG gain on sale | n/a | (982) | n/a |
| Plus: restructuring charge | n/a | 336 | n/a |
| Adjusted pretax income (d) | 3,825 | 3,885 | +1.6% |
| Adjusted net income | 2,902 | 3,214 | +10.8% |
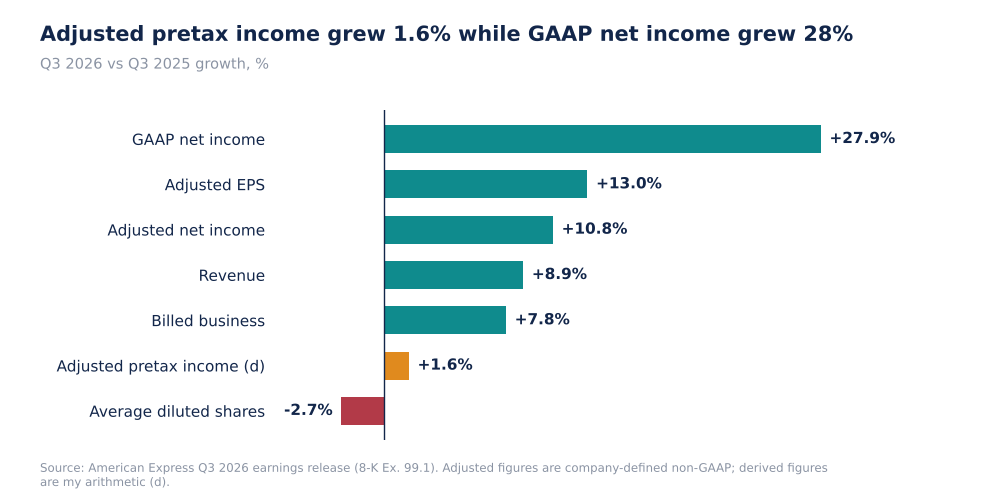
American Express growth rates, Q3 2026 vs Q3 2025
Adjusted pretax income of $3,885M (d) is 1.6% above last year's $3,825M, well below the 9% revenue growth. Whether the $982M gain was recorded within revenue is not stated in my extract; if it was, underlying revenue growth would be 3.5% (d) instead of 8.9%. Either way the adjustment is made at pretax level, so the 1.6% (d) conclusion does not change. A smaller provision (about $0.3B (d) lower) helped, which means that without it, adjusted pretax income would have been lower than last year.
Why it matters. The profit engine, measured before tax, was nearly flat. That is not the story the +31% EPS headline tells.
Source: American Express Q3 2026 earnings release (8-K Ex. 99.1). Adjusted figures are company-defined non-GAAP; derived figures are my arithmetic (d).
Forensic #2: The Tax Rate
| % of pretax income (d) | Q3 2025 | Q3 2026 | Change |
|---|---|---|---|
| GAAP effective rate | 24.1% | 18.1% | -6.1 pts |
| Adjusted-basis rate | 24.1% | 17.3% | -6.9 pts |
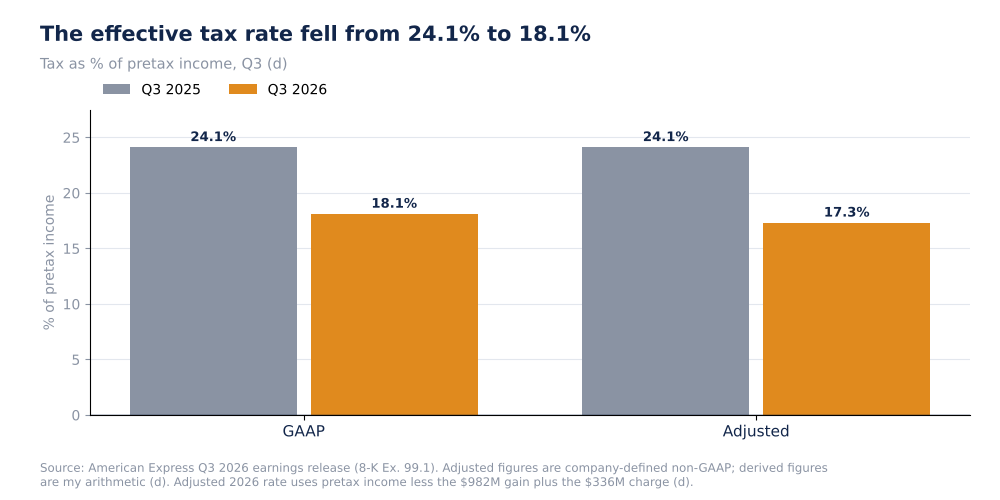
American Express effective tax rate, GAAP and adjusted, Q3 (d)
A drop in the tax rate from 24.1% to 17.3% (d) on the adjusted basis lifts net income by about 9% (d) with no change in pretax profit. That is the arithmetic gap between adjusted pretax growth of 1.6% and adjusted net income growth of 11%. The release extract does not explain the lower rate; a rate that low is normally tied to specific items and is less reliable as a base.
Why it matters. Of the 11% adjusted net income growth, roughly nine points (d) come from the tax rate.
Source: American Express Q3 2026 earnings release (8-K Ex. 99.1). Adjusted figures are company-defined non-GAAP; derived figures are my arithmetic (d).
Forensic #3: Share Count And EPS
| Item | Q3 2025 | Q3 2026 | Change (d) |
|---|---|---|---|
| Average diluted shares | 693M | 674M | -2.7% |
| Adjusted net income | $2,902M | $3,214M | +10.8% |
| Adjusted EPS | $4.14 | $4.68 | +13.0% |
Adjusted net income growth of 10.8% combined with a 2.7% lower share count gives about 14% (d) per-share growth, close to the reported 13% (the difference is a small amount that I attribute to the way earnings are allocated to common shares). The buyback therefore adds about three points to EPS growth, a meaningful and repeatable contribution because it comes from capital return and not from tax or reserve effects.
Why it matters. The repeatable parts of EPS growth are revenue growth and the lower share count; the tax rate and the reserve release are not guaranteed to recur.
Source: American Express Q3 2026 earnings release (8-K Ex. 99.1). Adjusted figures are company-defined non-GAAP; derived figures are my arithmetic (d).
Forensic #4: What Guidance Implies For Q4
| Adjusted EPS | Value | Basis |
|---|---|---|
| Nine months 2026 | $13.49 | Company |
| Full-year guidance | $17.60 to $17.90 | Company |
| Implied Q4 2026 (d) | $4.11 to $4.41 | Guide minus nine months |
| Q4 2025 (d) | $3.53 | FY2025 GAAP $15.38 minus nine months $11.85 |
| Implied Q4 growth (d) | 16% to 25% | Range |
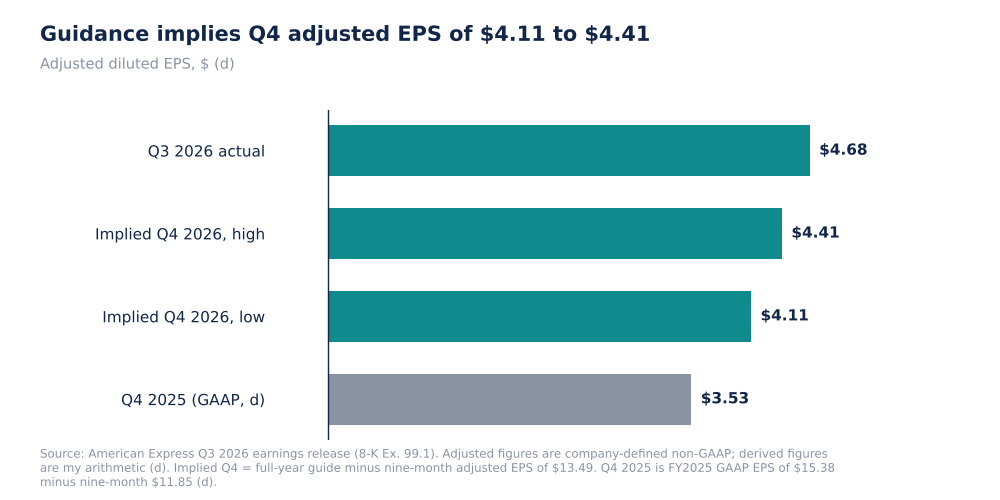
Implied Q4 2026 adjusted EPS from guidance, vs Q3 2026 and Q4 2025 (d)
The implied Q4 range of 16% to 25% growth (d) is above the Q3 adjusted growth of 13%, so management is guiding to faster growth in Q4. The comparison base is GAAP because the extract does not give a Q4 2025 adjusted figure, which slightly flatters the growth rate if there were adjustments in the base period. The guided range also sits below the Q3 level, which is normal seasonality and not a decline.
Why it matters. The guide requires Q4 to show a growth rate that Q3 underlying pretax income did not.
Source: American Express Q3 2026 earnings release (8-K Ex. 99.1). Adjusted figures are company-defined non-GAAP; derived figures are my arithmetic (d).
Valuation Snapshot
My source has no share price, so I cannot calculate multiples. The measures to track are below.
| Measure | Latest |
|---|---|
| Billed business growth | +7.8% (d) |
| Adjusted pretax income growth | +1.6% (d) |
| Adjusted-basis tax rate | 17.3% (d) |
| Principal net write-off rate | 1.8% |
| 2026 adjusted EPS guide | $17.60 to $17.90 |
What has to be true. Spending and revenue growth must convert to pretax profit growth in Q4 without help from the tax rate or reserve releases.
Risks: What Would Break The Thesis
- Tax rate. The 18.1% rate may not repeat.
- Reserve release. A build would reduce pretax income.
- Expense growth. Expenses grew 9%, in line with revenue.
- Location of the gain. Whether the $982M is in revenue is not stated in my extract.
- Data limits. No net interest income, card fee or segment figures in the extract.
The reading would be wrong if the filing shows that the lower tax rate and the provision were fully explained by items that recur.
What To Watch Next
- Adjusted pretax income growth against the 1.6% (d) in Q3.
- Effective tax rate against 18.1%.
- Provision for credit losses against $1.0B and the net write-off rate against 1.8%.
- Q4 adjusted EPS against the implied $4.11 to $4.41 (d).
- Billed business growth against +7.8% (d).
- Statistical tables for net interest income, card fees and segment results.

Sandeep Gupta
Independent equity research analyst publishing forensic theses on US-listed stocks. MBA, Politecnico di Milano School of Management (Milan, Italy).
Get new research in your inbox
Subscribe to receive forensic equity research the moment it's published. Free, no spam.
Related Research
Latest earnings releases: AXP
— AMERICAN EXPRESS RAISES FY 2026 EARNINGS PER SHARE GUIDANCE
Discussion
Be the first to comment.