
Investment Thesis
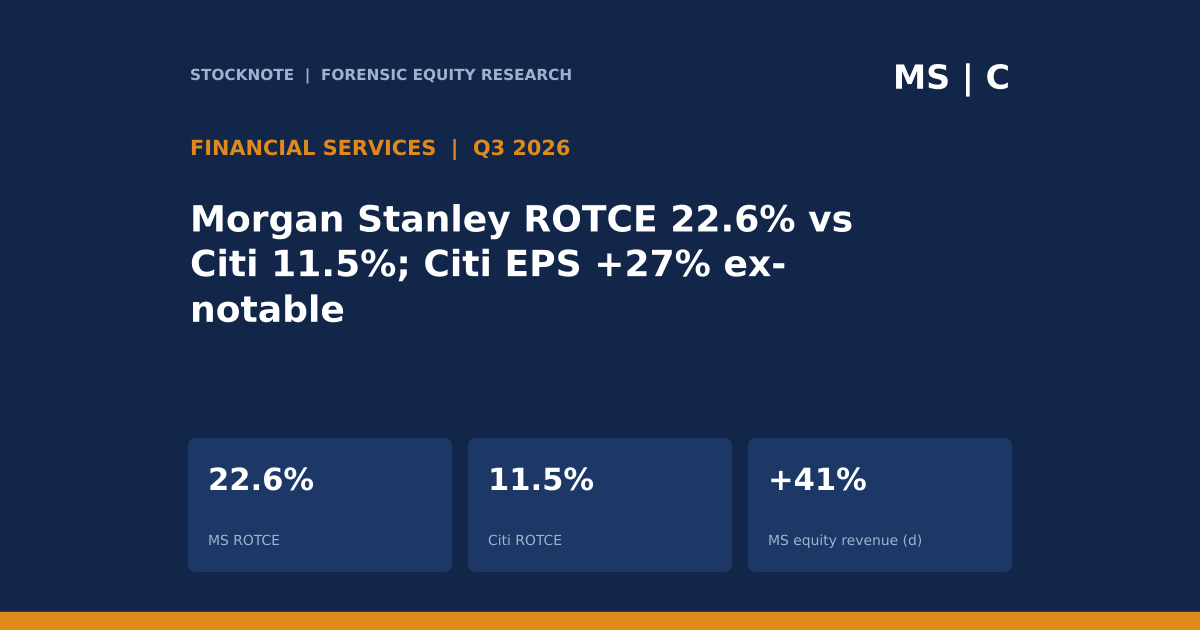
Morgan Stanley and Citigroup reported third-quarter 2026 results that show two different ways to earn money with a large securities and banking franchise. Morgan Stanley earned $4,909 million (EPS $3.03) on $20,338 million of net revenues, with a return on tangible common equity of 22.6%. Citigroup earned $5,245 million (EPS $2.85) on $23,845 million of revenues with a ROTCE of 11.5%, up from 8.0% a year earlier. Citi's net income rose 40%, but a $726 million goodwill impairment in the year-ago quarter flatters the comparison: excluding it, EPS rose 27% (the release gives $2.24 as the prior-year base). Morgan Stanley's growth came from equity trading (+41%) and asset management (+16%); Citi's came from cost reduction and its Services, Banking and Wealth segments.
- Morgan Stanley. Net revenues $20,338M (+11.6%); net income $4,909M ($4,610M); EPS $3.03 ($2.80); ROTCE 22.6% (23.5%); efficiency ratio 67% (67%); CET1 14.9% (15.1%); provision $148M ($0).
- Citigroup. Revenues $23,845M (+8%); expenses $13,952M (-2%); pre-tax income $7,307M ($5,350M); net income $5,245M ($3,752M); EPS $2.85 ($1.86); ROTCE 11.5% (8.0%); efficiency ratio 58.5% (64.7%); CET1 12.8% (13.3%).
- Capital return. Morgan Stanley repurchased $1,540M ($1,085M a year ago) and declared a $1.15 dividend; Citi returned $4.1B to common shareholders, an 85% payout.
- This article contains no rating, price target or investment advice. Derived figures are marked (d).
Bottom line. Morgan Stanley earns twice Citi's return on tangible equity (2.0x, d) while spending more of each revenue dollar (67% against 58.5%), so its advantage is revenue quality and capital efficiency, and not cost. Citi's improvement is real but smaller than it looks: net income grew 40%, pre-tax income about 20% (d) once the year-ago impairment is excluded, and EPS 27%.
Sources: Morgan Stanley Q3 2026 8-K; Citigroup Q3 2026 8-K.
Q3 2026 At A Glance
| Q3 2026 | Morgan Stanley | Citigroup |
|---|---|---|
| Net revenues ($M) | 20,338 (+11.6%, d) | 23,845 (+8%) |
| Pre-tax income ($M) | 6,478 (year-ago 6,028) | 7,307 (year-ago 5,350) |
| Net income ($M) | 4,909 (4,610) | 5,245 (3,752) |
| Diluted EPS | $3.03 ($2.80) | $2.85 ($1.86; $2.24 ex-notable) |
| ROTCE | 22.6% (23.5%) | 11.5% (8.0%) |
| Efficiency ratio | 67% (67%) | 58.5% (64.7%) |
| CET1 ratio | 14.9% (15.1%) | 12.8% (13.3%) |
| Provision for credit losses ($M) | 148 (0) | 2,586 (2,450) |
| Buybacks / total returned | $1,540M buybacks | $4.1B (85% payout) |
Sources: Morgan Stanley; Citigroup.
What The Market Believes vs. What The Data Actually Shows
| Belief | What the data show |
|---|---|
| Citi has caught up with peers | ROTCE of 11.5% is 2.0 times (d) smaller than Morgan Stanley's 22.6%, although it rose 3.5 points. |
| Citi's 40% profit growth is operating improvement | The year-ago quarter included a $726M goodwill impairment; pre-tax income excluding it rose about 20% (d), not 37%. |
| Morgan Stanley is a trading house | Equity trading was $5,799M, 29% (d) of net revenues; Wealth Management ($9,065M) is 45% (d). |
| Wealth is a stable fee business | Wealth transactional revenue fell 10.9% (d); asset management rose 15.8% (d); net interest rose 11.9% (d). |
| Lower expenses show efficiency | Citi's expenses fell 2% reported; excluding the impairment they rose 2.9% (d). |
Forensic #1: Returns, Efficiency And Capital
| Q3 2026 | Morgan Stanley | Citigroup | Ratio or gap (d) |
|---|---|---|---|
| ROTCE | 22.6% | 11.5% | 2.0x |
| Efficiency ratio | 67% | 58.5% | 8.5 pts higher at MS |
| CET1 | 14.9% | 12.8% | 2.1 pts higher at MS |
| Net income / revenues (d) | 24.1% | 22.0% | |
| Provision / revenues (d) | 0.7% | 10.8% |
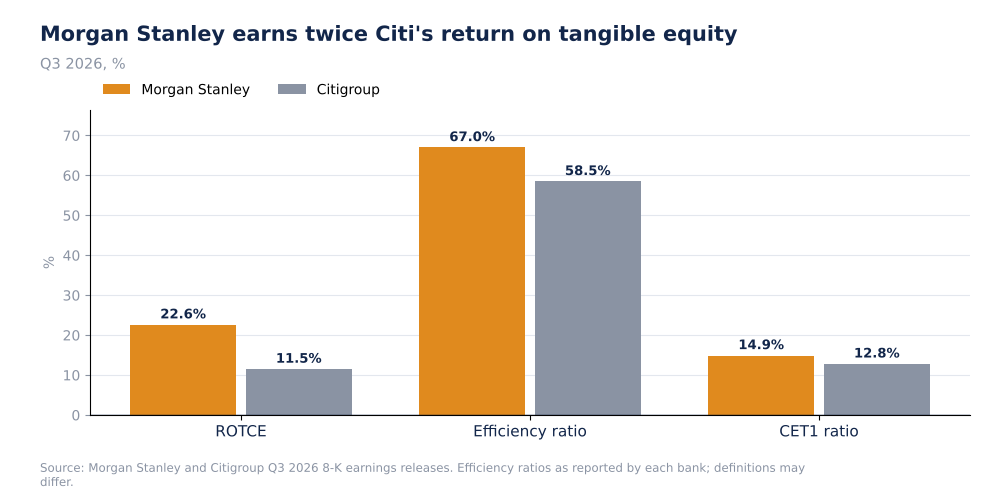
Morgan Stanley Vs Citigroup: ROTCE, Efficiency And Capital, Q3 2026 (Self-Made, Company Data)
Morgan Stanley's net income is a larger share of revenue (24.1% against 22.0%, d) despite a higher efficiency ratio, because it carries a much smaller provision (0.7% of revenue against 10.8% (d)). Citi's lending and card businesses require credit provisions of $2,586M. Higher capital at Morgan Stanley (CET1 14.9%) is combined with a higher return, which means the equity is deployed in lower-capital-intensity activities. The efficiency ratios are as reported by each bank and may not be defined identically.
Why it matters. ROTCE is the number that decides how much a dollar of equity is worth. A bank earning 22.6% on tangible equity and one earning 11.5% should not trade on the same multiple of book value, but the comparison needs each bank's cost of equity, which is not in my sources.
Sources: Morgan Stanley; Citigroup. Ratios are my arithmetic (d).
Forensic #2: Morgan Stanley's Revenue Lines
| $ millions | Q3 2026 | Q3 2025 | Change (d) |
|---|---|---|---|
| Equity trading | 5,799 | 4,116 | +40.9% |
| Asset management (Wealth) | 5,544 | 4,789 | +15.8% |
| Net interest (Wealth) | 2,228 | 1,991 | +11.9% |
| Investment banking | 2,159 | 2,108 | +2.4% |
| Fixed income | 2,011 | 2,169 | -7.3% |
| Transactional (Wealth) | 1,166 | 1,308 | -10.9% |
| Investment Management | 1,459 | 1,651 | -11.6% |
| Institutional Securities total | 10,029 | 8,523 | +17.7% |
| Wealth Management total | 9,065 | 8,234 | +10.1% |
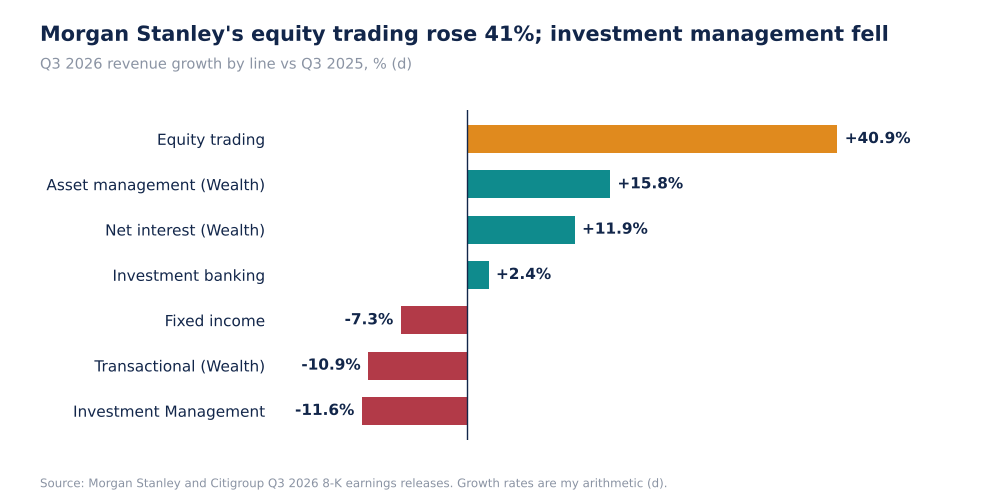
Morgan Stanley Revenue Growth By Line, Q3 2026 (Self-Made, d)
Equity trading rose $1,683M (d), more than the entire increase in Wealth Management revenue ($831M, d). Within Wealth, asset management (fee-based) is 61% (d) of the segment and grew 15.8% (d), while fee-based client assets rose 18.9% (d) to $3,155B and net new assets were $232.4B against $81.0B. Wealth pre-tax margin was 30.4% (the prior-year figure is not in the release). Investment Management fell 11.6% (d) to $1,459M.
Why it matters. The fee-based part of Wealth is the stable portion, and the 2.9 times (d) increase in net new assets suggests that fee base can keep growing. The part of revenue most exposed to markets is equity trading, which is now the largest single line.
Source: Morgan Stanley. Growth rates are my arithmetic (d).
Forensic #3: Citigroup's Segments
| Segment | Revenue ($M) Q3 2026 | Revenue growth (d) | Net income ($M) | Net income growth (d) | RoTCE (2026 vs 2025) |
|---|---|---|---|---|---|
| Services | 6,614 | +15% | 2,637 | +27% | 31.2% vs 25.0% |
| Markets | 6,113 | +6% | 1,743 | +2% | 12.3% vs 12.6% |
| Banking | 1,741 | +6% | 378 | +40% | 19.2% vs 11.6% |
| Wealth | 3,269 | +15% | 585 | +93% | 14.3% vs 7.8% |
| US Consumer Cards | 4,664 | +0% | 851 | -8% | 21.8% vs 18.2% |
| All Other (managed) | 1,432 | -3% | (955) | loss widened from (756) | n/a |
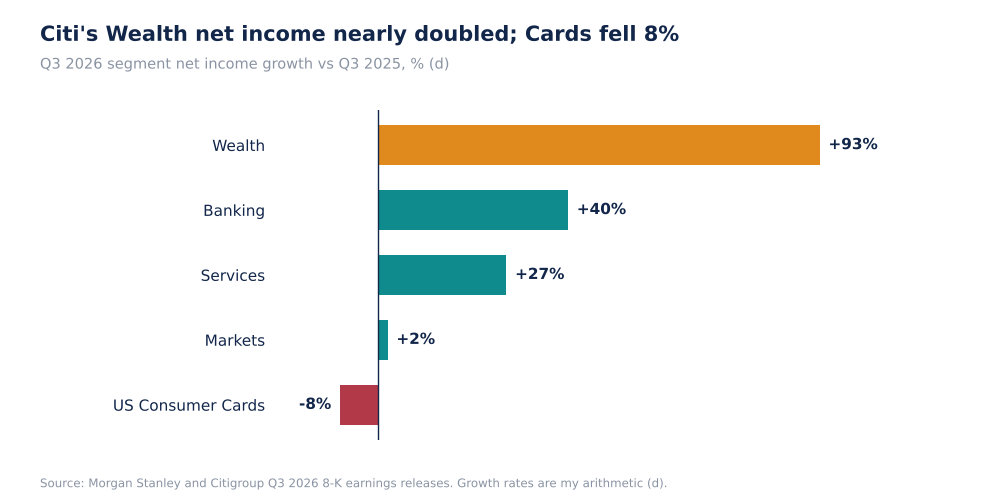
Citigroup Segment Net Income Growth, Q3 2026 Vs Q3 2025 (Self-Made, d)
Services (net income $2,637M, RoTCE 31.2%) is the highest-return segment and is 50% (d) of consolidated net income. Wealth almost doubled net income from a low base. US Consumer Cards, a lending business, declined 8.4% (d) on flat revenue. Markets earned the lowest return (12.3%) of the main segments. Segment net incomes, including the All Other loss, sum to $5,239M (d), within $6M of consolidated net income of $5,245M.
Why it matters. The consolidated 11.5% ROTCE blends a 31.2% fee business with 12% to 14% returns in Markets and Wealth. The mix shift toward the high-return segments is the path to a higher total; the loss in All Other holds it back.
Source: Citigroup. Growth rates and sums are my arithmetic (d).
Forensic #4: Citi's Cost Reduction And The Goodwill Item
| $ millions | Q3 2026 | Q3 2025 reported | Q3 2025 excl. $726M impairment (d) |
|---|---|---|---|
| Revenues | 23,845 | 22,090 | 22,090 |
| Operating expenses | 13,952 | 14,290 | 13,564 |
| Pre-tax income | 7,307 | 5,350 | 6,076 |
| Efficiency ratio | 58.5% | 64.7% | 61.4% |
| Expense growth (d) | -2.4% | +2.9% | |
| Pre-tax income growth (d) | +36.6% | +20.3% |
The release describes a $726M goodwill impairment ($714M after tax) in the prior-year quarter, tied to the agreement to sell a 25% stake in Banamex. If that charge is in operating expenses, as I assume (the extract does not say), then prior-year expenses excluding it were $13,564M and the year-on-year change is +2.9% (d), not -2%. Efficiency would then have improved from 61.4% to 58.5% (d), driven by revenue growth of 7.9% (d) and not by cost cuts. The release also gives EPS of $2.24 excluding the notable item, so the +27% adjusted growth is the company's own like-for-like figure.
Why it matters. Whether Citi's gain came from revenue or cost changes what is repeatable. On these figures revenue growth of about 8% with expenses growing about 3% is operating leverage that can continue, but the headline 40% net income growth cannot.
Source: Citigroup. Excluding the impairment is my arithmetic (d) and rests on the assumption stated.
Valuation Snapshot
I have no share prices for either bank in my sources, so no multiples are calculated. The returns and capital are the inputs.
| Measure | Morgan Stanley | Citigroup |
|---|---|---|
| ROTCE | 22.6% | 11.5% |
| CET1 | 14.9% | 12.8% |
| Quarterly dividend | $1.15 (declared) | n/a in extract |
| Capital returned | $1,540M buybacks | $4.1B (85% payout) |
What has to be true. A higher book multiple for Morgan Stanley is consistent with its higher ROTCE only if that return is sustainable through a market downturn; Citi's multiple depends on the return rising from 11.5% toward the 12% to 14% earned in its segments.
Risks: What Would Break The Thesis
- Definitions. Efficiency ratios and ROTCE are each bank's own measures.
- Assumption on the impairment. I assume the $726M sits in operating expenses.
- Trading dependence. Morgan Stanley's equity trading is 29% (d) of revenue.
- Credit. Citi's provision is $2,586M a quarter.
- One quarter. Trading revenue is volatile.
The reading would be wrong if Citi's impairment was booked outside expenses, or if Morgan Stanley's equity revenue reversed.
What To Watch Next
- Citi's ROTCE against 11.5% and its path toward segment returns.
- Morgan Stanley's equity trading revenue against $5,799M.
- Wealth net new assets against $232.4B.
- Citi's expense growth ex-notables against about 3%.
- CET1 against 14.9% and 12.8%.
- Provisions against $148M and $2,586M.

Sandeep Gupta
Independent equity research analyst publishing forensic theses on US-listed stocks. MBA, Politecnico di Milano School of Management (Milan, Italy).
Get new research in your inbox
Subscribe to receive forensic equity research the moment it's published. Free, no spam.
Discussion
Be the first to comment.