
Investment Thesis
Travelers and Chubb both reported strong Q3 2026 profits, with combined ratios of 86.8% and 84.1%, but the quality of the results differs from the headline in the same way: reserve releases and investment income are doing more work than underwriting. Premium growth was flat at Travelers (0%) and 1.9% at Chubb, and Chubb's North America commercial premiums fell 2.7%. This is the pattern expected late in a pricing cycle, where property rates fall while casualty rates keep rising.
- Travelers. Net written premiums $11,480M (flat); combined ratio 86.8% (87.3%); underlying 84.1% (83.9%); catastrophe losses $538M (4.8 points); favorable reserve development $234M (2.1 points) vs $22M; core EPS $9.18 (+13%); core ROE 22.1%.
- Chubb. Net premiums written $15,143M (+1.9%); P&C combined ratio 84.1% (81.8%); current-accident-year ex-catastrophe 82.6% (82.5%); catastrophe losses $705M ($285M); favorable development $511M ($361M); P&C underwriting income $2,061M (-8.8%); core operating EPS $7.66 (+0.8%); core operating ROE 14.9%.
- Investment income. Travelers $1,098M pretax (+6%), Chubb $1,791M pretax (+8.6%). Travelers' after-tax investment income was 47% (d) of core income.
- Share count. Implied diluted shares fell 7.5% at Travelers (d) and 3.0% at Chubb (d).
- This article contains no rating, price target or investment advice. Derived figures are marked (d).
Bottom line. Before reserve releases, Travelers' combined ratio rose to 88.9% (d) from 87.5% (d), and Chubb's underwriting income fell 18% (d). Both companies are being held up by favorable prior-year development, investment income and buybacks.
Sources: Travelers Q3 2026 release; Chubb Q3 2026 release.
Q3 2026 At A Glance
| Measure | Travelers | Chubb |
|---|---|---|
| Net premiums written | $11,480M (0%) | $15,143M (+1.9%) |
| Combined ratio | 86.8% (87.3%) | 84.1% P&C (81.8%) |
| Underlying / current-year ex-cat | 84.1% (83.9%) | 82.6% (82.5%) |
| Catastrophe losses | $538M ($402M) | $705M ($285M) |
| Favorable reserve development | $234M ($22M) | $511M ($361M) |
| Pretax net investment income | $1,098M (+6%) | $1,791M (+8.6%) |
| Core EPS | $9.18 (+13%) | $7.66 (+0.8%) |
| Core ROE | 22.1% (22.6%) | 14.9% (16.6%) |
Sources: Travelers; Chubb. Prior-year figures in brackets.
What The Market Believes vs. What The Data Actually Shows
| Belief | What the data show |
|---|---|
| Record underwriting profit means pricing is strong | Chubb's North America commercial premiums fell 2.7% and Travelers' premiums were flat; Travelers' renewal premium change was 4.1% overall but 7.0% excluding property, so property is well below average. |
| A lower combined ratio means better underwriting | Travelers' ratio improved 0.5 point only because reserve releases rose from 0.2 to 2.1 points; before releases it worsened by 1.4 points (d). |
| Catastrophes were benign | Catastrophe losses rose at both companies (Travelers $538M vs $402M, Chubb $705M vs $285M). |
| EPS growth shows earnings growth | Travelers core income grew 4% but core EPS 13%; Chubb core operating income fell 2.2% while EPS rose 0.8% (share count, d). |
| Book value tracks earnings | Travelers' book value per share was $141.48 vs $141.72 a year earlier, while the adjusted figure was up 15%. |
Forensic #1: The Combined Ratio Without Reserve Releases
A combined ratio is losses and expenses divided by premiums; below 100% is an underwriting profit. It can be decomposed into the underlying (current-year, ex-catastrophe) ratio, catastrophes and prior-year reserve development. Releases of reserves set aside in earlier years lower the combined ratio now without describing current business, so the cleanest read is to remove them.
| Travelers, points of premium | Q3 2025 | Q3 2026 | Change |
|---|---|---|---|
| Underlying combined ratio | 83.9 | 84.1 | +0.2 |
| Catastrophe losses | 3.6 | 4.8 | +1.2 |
| Prior-year development (favorable) | (0.2) | (2.1) | -1.9 |
| Combined ratio | 87.3 | 86.8 | -0.5 |
| Combined ratio before reserve releases (d) | 87.5 | 88.9 | +1.4 |
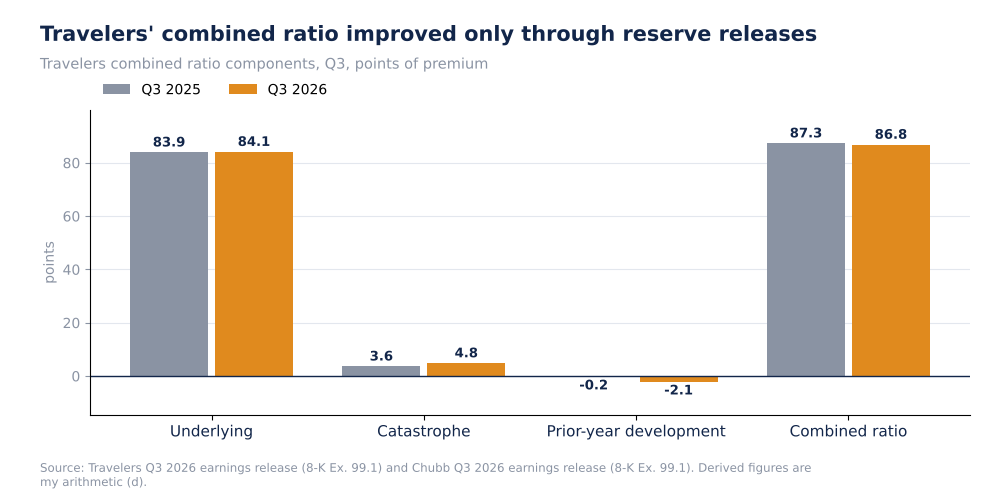
Travelers combined ratio components, Q3 2025 vs Q3 2026
The combined ratio fell 0.5 point, but the move is more than explained by the 1.9-point larger reserve release; the underlying ratio rose 0.2 point and catastrophes added 1.2 points. By segment, Business Insurance's underlying combined ratio rose to 88.9% (88.3%), Bond & Specialty held at 85.8% and Personal Insurance improved to 76.7% (77.7%). Business Insurance also swung from $125M of unfavorable development a year ago to $41M favorable.
Why it matters. The ratio before releases deteriorated by 1.4 points (d). That is the underwriting trend; the headline improvement is accounting for earlier years.
Source: Travelers Q3 2026 release. Derived figures marked (d).
Forensic #2: Premium Growth And The Pricing Cycle
| Segment | Premium change | Comment |
|---|---|---|
| Travelers Business Insurance | +3% (+4% excl. Canada sale) | Renewal premium change 4.1%; 7.0% excluding property; retention 86% |
| Travelers Bond & Specialty | +12% | Renewal premium change 3.8%; retention 89% |
| Travelers Personal Insurance | -7% (-3% excl. Canada sale) | No renewal change reported |
| Chubb North America Commercial | -2.7% | |
| Chubb North America Personal | +5.3% | |
| Chubb Overseas General | +6.7% | |
| Chubb Life | +1.4% |
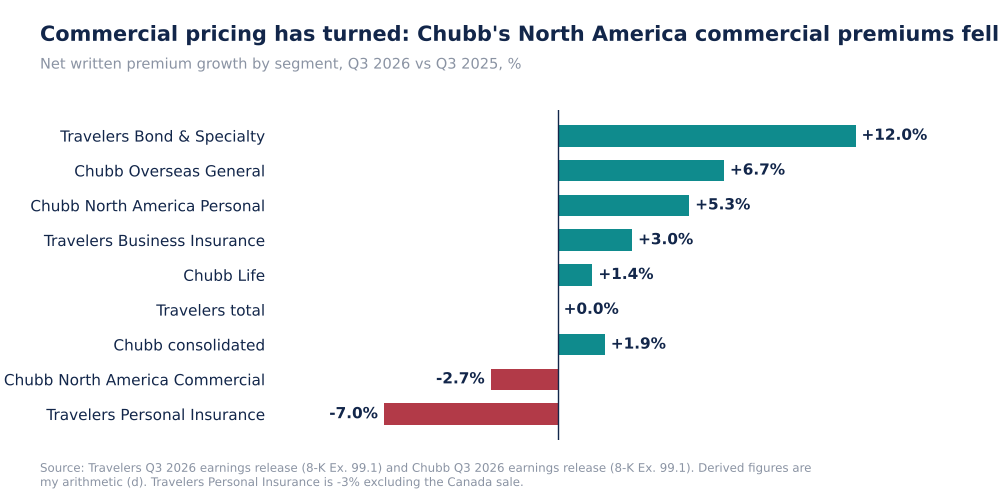
Net written premium growth by segment, Travelers and Chubb, Q3 2026
Insurance pricing moves in cycles. When capital is plentiful and losses are benign, property rates fall first; casualty and specialty lines, where reserve risk is longer, keep rising. That pattern is visible here: Travelers' Business Insurance renewal premium change is 4.1% overall but 7.0% excluding property, which implies a weak property figure that the extract does not give. Chubb's North America commercial premiums fell 2.7%. Both statements are consistent with a softening property market, but I cannot isolate property premiums from the extracts.
Why it matters. Falling property rates raise the combined ratio before losses change, so the current profit level is the high-water mark of the underwriting cycle if pricing continues to soften.
Forensic #3: Chubb's Underwriting Income Before Releases
| Chubb P&C, $ millions | Q3 2025 | Q3 2026 | Change (d) |
|---|---|---|---|
| Underwriting income | 2,259 | 2,061 | -8.8% |
| Favorable prior-period development | 361 | 511 | +150 |
| Underwriting income excluding development (d) | 1,898 | 1,550 | -18.3% |
| Catastrophe losses | 285 | 705 | +420 |
| Combined ratio | 81.8% | 84.1% | +2.3 pts |
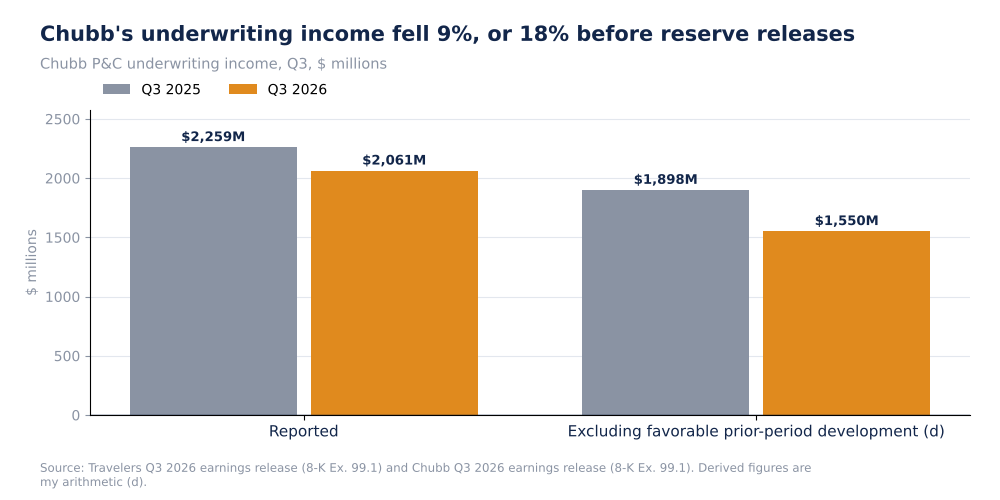
Chubb P&C underwriting income, reported and excluding favorable development, Q3
Reported underwriting income fell 8.8%, but excluding favorable development it fell 18.3% (d) because the reserve release rose by $150M (d). The $420M increase in catastrophe losses is the largest single driver, and the current-year ex-catastrophe ratio was flat (82.6% vs 82.5%), so the pressure came from catastrophes and not from attritional losses. That is a more benign explanation than rising loss costs, though a year with higher catastrophes does not prove a return to lower ones.
Why it matters. Chubb's attritional underwriting is stable, which is its strength; its earnings growth is flat because catastrophes rose and investment income did not fully offset them.
Source: Chubb Q3 2026 release. Derived figures marked (d).
Forensic #4: Investment Income, Book Value And Buybacks
| Item | Travelers | Chubb |
|---|---|---|
| Pretax net investment income | $1,098M ($1,033M) | $1,791M ($1,648M) |
| After-tax investment income / core income (d) | 47% (46% a year ago) | n/a |
| Implied diluted shares, core basis (d) | 212M vs 229M (-7.5%) | 389M vs 401M (-3.0%) |
| Q3 repurchases | $1.508B at $376.00 | $1.18B at $344.32 |
| Book value per share | $141.48 (-6% since year-end) | $191.43 (+5.1% y/y) |
| Adjusted / tangible book value per share | $172.47 (+15%) | $126.96 (+5.7%) |
Travelers' adjusted book value per share rose 15% while reported book value was flat year over year, so the gap between the two widened from $8.83 to $30.99 per share (d). The extract does not define the adjustment; that is the pattern expected if it removes unrealized investment losses, which grow when interest rates rise, but I cannot confirm that. Both companies also use buybacks heavily: Travelers repurchased $1.508B in the quarter (about 79% (d) of GAAP net income), and the lower share count explains most of the gap between its core income growth (+4%) and core EPS growth (+13%).
Why it matters. With underwriting margins flat and premiums growing slowly, EPS growth leans on investment income and buybacks, which are both capital-dependent.
Valuation Snapshot
My sources have no share prices, so I cannot calculate price-to-book or earnings multiples. The measures to track are below.
| Measure | Travelers | Chubb |
|---|---|---|
| Combined ratio before reserve releases | 88.9% (d) | n/a |
| Underwriting income before releases | n/a | $1,550M (d) |
| Core ROE | 22.1% | 14.9% |
| Book value per share | $141.48 | $191.43 |
| Premium growth | 0% | +1.9% |
What has to be true. Reserve releases must continue and property pricing must not soften much further for these combined ratios to hold; otherwise underlying margins shrink.
Risks: What Would Break The Thesis
- Softening property rates. Chubb's commercial premiums fell 2.7%.
- Reserve release dependence. Travelers' releases rose from $22M to $234M.
- Catastrophes. Losses rose at both companies.
- Rate-driven book value. The gap between adjusted and reported book value is widening.
- Data limits. No share prices, no Chubb reserve-development ratio in points and no Travelers underwriting income in the extracts.
The reading would be wrong if the filings show that the releases reflect a specific, one-time reserve reassessment and that property rates stabilize.
What To Watch Next
- Travelers' combined ratio before reserve releases against 88.9% (d).
- Chubb's North America commercial premium growth against -2.7%.
- Travelers' renewal premium change excluding property against 7.0%.
- Reserve releases at both companies against $234M and $511M.
- Catastrophe losses against $538M and $705M.
- Gap between adjusted and reported book value per share.

Sandeep Gupta
Independent equity research analyst publishing forensic theses on US-listed stocks. MBA, Politecnico di Milano School of Management (Milan, Italy).
Get new research in your inbox
Subscribe to receive forensic equity research the moment it's published. Free, no spam.
Discussion
Be the first to comment.