
Investment Thesis
Charles Schwab reported Q3 2026 net revenues of $7,171M (+17%), a GAAP pretax profit margin of 52.7% (49.2%) and GAAP EPS of $1.62 (+29%). Revenue grew nearly twice as fast as expenses, which is the textbook definition of positive operating leverage. The less visible point is how the balance sheet funded the growth: wholesale borrowings rose by roughly $12B (d) while bank deposits rose by $5B.
- Revenue. Net revenues $7,171M vs $6,135M (+16.9% (d)); net interest revenue $3,476M (+14% (d)); asset management and administration fees $1,913M (+14%); trading $1,158M (+16%).
- Operating leverage. Expenses excluding interest $3,394M (+9% (d)); pretax margin 52.7% vs 49.2%; incremental pretax margin about 73% (d).
- Returns. GAAP net income $2,906M (+23%); GAAP EPS $1.62 ($1.26); adjusted EPS $1.69 ($1.31); return on tangible common equity 44% (38%).
- Clients. Core net new assets $190.4B (+38%); total client assets $13,333.2B (+15%); active brokerage accounts 40.26M (+6%).
- Balance sheet. Net interest margin 3.04% (2.88%); average interest-earning assets $451.5B (+8%); client cash 8.9% of client assets (9.4%).
- This article contains no rating, price target or investment advice. Derived figures are marked (d).
Bottom line. Schwab is converting a rising asset base into a rising margin. The sustainability question is the funding mix: net interest revenue grew with average assets and margin, but part of the asset growth was funded with borrowings that cost more than client cash.
Source: Schwab Q3 2026 earnings release.
Q3 2026 At A Glance
| Measure | 3Q26 | 3Q25 | Change |
|---|---|---|---|
| Total net revenues | $7,171M | $6,135M | +17% |
| Net interest revenue | $3,476M | $3,050M | +14% |
| Expenses excl. interest (GAAP) | $3,394M | $3,114M | +9% |
| Pretax margin (GAAP) | 52.7% | 49.2% | +3.5 pts |
| Net income (GAAP) | $2,906M | $2,358M | +23% |
| Diluted EPS (GAAP / adjusted) | $1.62 / $1.69 | $1.26 / $1.31 | +29% / +29% |
| Total client assets | $13,333.2B | $11,593.9B | +15% |
| Net interest margin | 3.04% | 2.88% | +16 bp |
Source: Schwab Q3 2026 earnings release.
What The Market Believes vs. What The Data Actually Shows
| Belief | What the data show |
|---|---|
| Record asset gathering means rising cash earnings | Core net new assets were a record $190.4B, yet client cash fell to 8.9% of client assets from 9.4%, because asset growth (+15%) outpaced cash growth. |
| Rates drive everything | Net interest revenue grew 14% (d), but asset management fees also grew 14% and trading 16%: fee revenue is growing as fast as spread revenue. |
| Cost control is the margin story | Expenses rose 9% (d) against revenue growth of 17% (d), but the margin gain is 3.5 points (d) and the incremental margin is about 73% (d). |
| Deposit funding is stable | Deposits rose 2% to $244.1B; borrowings (short-term, FHLB and long-term) rose from $27.6B to $40.0B (d). |
| Capital is ample | Tier 1 leverage was 8.9% (CSC) on the reported basis but 7.0% on the adjusted basis released by the company. |
Forensic #1: Operating Leverage And Incremental Margin
Positive operating leverage means revenue grows faster than expenses, so each new dollar of revenue carries a margin above the existing margin. For a brokerage with a largely fixed technology and service cost base, this is where a growing asset base should show up first.
| $ millions | 3Q26 | 3Q25 | Change (d) |
|---|---|---|---|
| Net revenues | 7,171 | 6,135 | +1,036 |
| Expenses excluding interest | 3,394 | 3,114 | +280 |
| Pretax profit at stated margin (d) | 3,779 | 3,018 | +761 |
| Incremental pretax margin (d) | 73% |
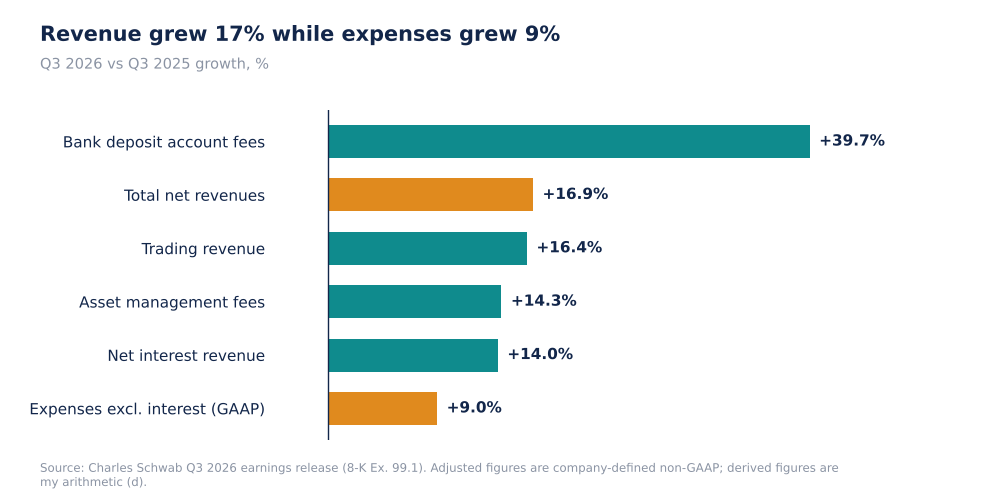
Schwab revenue lines and expenses, growth Q3 2026 vs Q3 2025
Pretax profit at the reported margins rose by about $761M (d) on an $1,036M revenue increase, an incremental margin of 73% (d) against a starting margin of 49.2%. The pretax margin definition is the company's (pretax profit as a percentage of net revenues), and the dollar figures are derived from the rounded percentages, so the incremental margin is approximate. Bank deposit account fees, the fastest-growing line (+40%), are a revenue stream that carries little incremental cost.
Why it matters. An incremental margin of about 73% means that additional revenue growth of the same kind lifts the overall margin further, and that a revenue slowdown would reduce the margin faster than it rose.
Source: Charles Schwab Q3 2026 earnings release (8-K Ex. 99.1). Adjusted figures are company-defined non-GAAP; derived figures are my arithmetic (d).
Forensic #2: Net Interest Revenue, Volume Versus Rate
Net interest revenue is, to a first approximation, the product of balances and margin. Splitting growth into those two parts separates what Schwab controls through asset gathering (volume) from what depends on the rate and funding environment (margin).
| Driver | 3Q26 | 3Q25 | Growth (d) |
|---|---|---|---|
| Average interest-earning assets | $451.5B | $417.0B | +8.3% |
| Net interest margin | 3.04% | 2.88% | +5.6% (relative) |
| Net interest revenue | $3,476M | $3,050M | +14.0% |
| Volume x margin (d) | +14.3% |
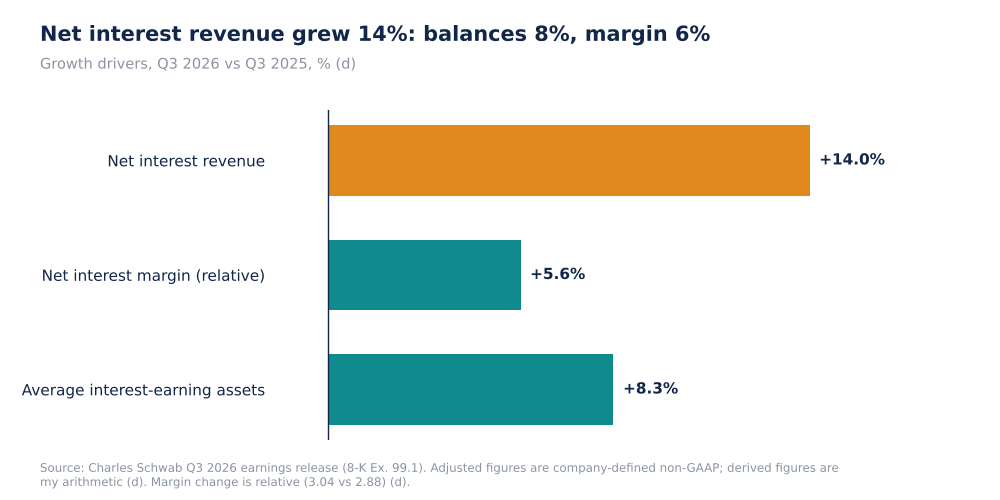
Schwab net interest revenue growth split into balance growth and margin change (d)
The product of balance growth (8.3%) and margin change (5.6%) gives 14.3% (d), close to the reported 14.0%. About 60% (d) of the growth is volume and 40% (d) is margin. Margin gains are the less durable half: a margin of 3.04% is 0.16 points above last year, and reverts if funding costs rise or asset yields fall.
Why it matters. Balance growth is linked to asset gathering and can compound; margin growth depends on the rate cycle.
Source: Charles Schwab Q3 2026 earnings release (8-K Ex. 99.1). Adjusted figures are company-defined non-GAAP; derived figures are my arithmetic (d).
Forensic #3: How The Balance Sheet Was Funded
| $ billions, quarter end | 3Q26 | 3Q25 | Change (d) |
|---|---|---|---|
| Bank deposits | 244.1 | 239.1 | +5.0 |
| Other short-term borrowings | 14.2 | 6.5 | +7.7 |
| FHLB borrowings | 2.0 | 0.9 | +1.1 |
| Long-term debt | 23.8 | 20.2 | +3.6 |
| Total borrowings (d) | 40.0 | 27.6 | +12.4 |
| Client cash (8.9% / 9.4% of client assets) (d) | 1,187 | 1,090 | +97 |
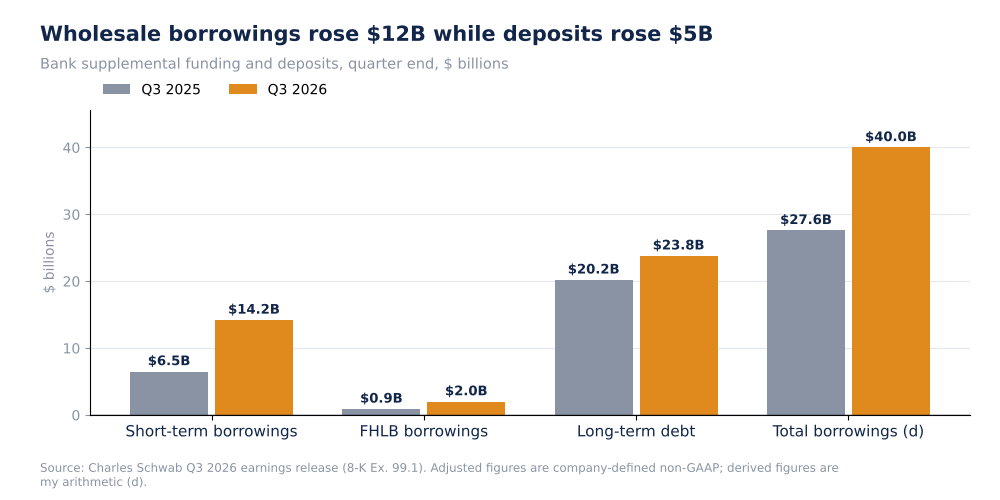
Schwab borrowings, quarter end Q3 2025 vs Q3 2026, $ billions
Total borrowings rose by $12.4B (d), or 45% (d), against a deposit increase of $5.0B. Average interest-earning assets rose $34.5B (d) on an average basis. I mix quarter-end borrowings with average assets, so the match is approximate, but borrowings clearly supplied a large share of the increase. Client cash in dollars (derived from the stated percentages) rose about $97B (d), which means total cash is not shrinking; it is just not keeping pace with asset growth.
Why it matters. Borrowed funding expands net interest revenue but usually at a narrower spread than client cash, and it leaves the margin more sensitive to short-term rates.
Source: Charles Schwab Q3 2026 earnings release (8-K Ex. 99.1). Adjusted figures are company-defined non-GAAP; derived figures are my arithmetic (d).
Forensic #4: Capital And Adjusted Versus GAAP
| Item | Value |
|---|---|
| Return on average common equity (annualized) | 25% (21%) |
| Return on tangible common equity (annualized, non-GAAP) | 44% (38%) |
| Tier 1 leverage, GAAP (CSC / CSB) | 8.9% / 10.6% |
| Tier 1 leverage, adjusted (CSC / CSB) | 7.0% / 7.3% |
| Repurchases | 4.7M shares for $0.5B |
| Expenses excluding interest, GAAP / adjusted | $3,394M / $3,243M |
| EPS, GAAP / adjusted | $1.62 / $1.69 |
The company-defined adjusted leverage ratio is 1.9 points (d) below the GAAP ratio at the holding company and 3.3 points (d) below it at the bank. The extract does not define the adjustment; the gap is consistent with an adjustment for unrealized losses on securities, which is the usual reason for such a measure, but I cannot confirm that here. Adjusted expenses are $151M (d) below GAAP expenses, a gap that explains the $0.07 (d) difference between GAAP and adjusted EPS.
Why it matters. The adjusted capital ratio is the more conservative view, and it is the one that limits buybacks. At $0.5B in the quarter, repurchases were about 17% (d) of GAAP net income.
Source: Charles Schwab Q3 2026 earnings release (8-K Ex. 99.1). Adjusted figures are company-defined non-GAAP; derived figures are my arithmetic (d).
Valuation Snapshot
My source has no share price, so I cannot calculate multiples. The operating measures to track are below.
| Measure | Latest |
|---|---|
| Pretax margin (GAAP) | 52.7% |
| Incremental pretax margin | 73% (d) |
| Net interest margin | 3.04% |
| Return on tangible common equity | 44% |
| Adjusted Tier 1 leverage (CSC) | 7.0% |
What has to be true. Asset gathering must continue and the net interest margin must hold near 3% for the margin gains to persist, and funding costs must not rise faster than asset yields.
Risks: What Would Break The Thesis
- Funding mix. Borrowings are growing faster than deposits.
- Margin reversal. Half the net interest revenue growth is margin (d).
- Capital. Adjusted Tier 1 leverage is 7.0% at the holding company.
- Market sensitivity. Trading and asset-based fees depend on market levels.
- Data limits. No share price, no dividend figure and no full capital definition in the extract.
The reading would be wrong if the filing shows that the borrowings are temporary and that client cash is growing in dollar terms faster than my derived figures suggest.
What To Watch Next
- Net interest margin against 3.04% and average interest-earning assets against $451.5B.
- Borrowings (currently $40.0B (d)) against deposits of $244.1B.
- Client cash as a share of client assets against 8.9%.
- Pretax margin against 52.7% and expense growth against 9%.
- Adjusted Tier 1 leverage at the holding company against 7.0%.
- Pace of repurchases against $0.5B in the quarter.

Sandeep Gupta
Independent equity research analyst publishing forensic theses on US-listed stocks. MBA, Politecnico di Milano School of Management (Milan, Italy).
Get new research in your inbox
Subscribe to receive forensic equity research the moment it's published. Free, no spam.
Discussion
Be the first to comment.