
Investment Thesis
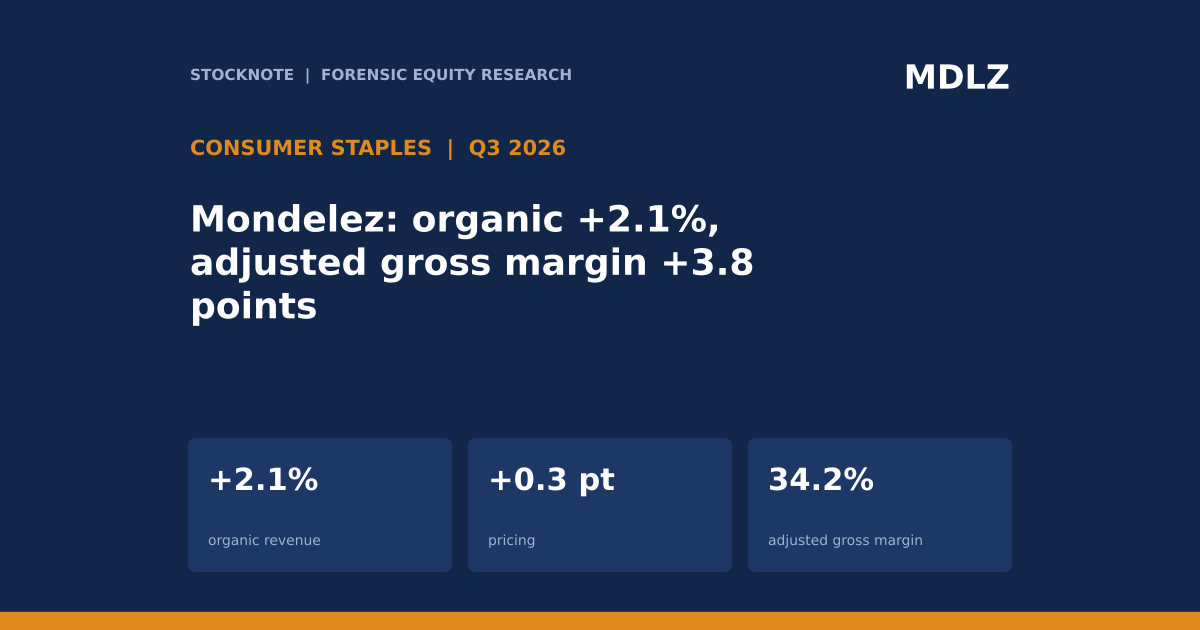
Mondelez reported Q3 2026 net revenues of $9,967M (+2.3%) with organic growth of 2.1%, made up of 1.8 points of volume and mix and 0.3 points of pricing. Profit grew much faster than sales: adjusted operating income rose 18.2% and the adjusted gross margin expanded from 30.4% to 34.2%. The release attributes the margin to lower raw material costs, so this is a quarter about input costs, not about demand.
- Revenue. $9,967M vs $9,744M (+2.3%); organic +2.1% (volume/mix +1.8, pricing +0.3).
- Regions. Latin America +6.9% organic, AMEA +7.7%, North America +1.6%, Europe -2.1% (pricing -3.7 points).
- Margins. Adjusted gross margin 34.2% (30.4%); adjusted operating margin 13.9% (12.0%); GAAP gross margin 39.4% (26.8%).
- Earnings. Adjusted operating income $1,384M (+18.2%); adjusted EPS $0.78 (+6.8%); GAAP EPS $1.02 ($0.57).
- Cash. Nine-month free cash flow $1,659M ($1,236M); repurchases $845M ($1,893M); dividends $1,927M; capital returned $2.8B.
- This article contains no rating, price target or investment advice. Derived figures are marked (d).
Bottom line. The earnings recovery is margin-led. About 85% (d) of the increase in adjusted gross profit came from the higher margin rate and not from higher sales. Margin from cost deflation is real, but it depends on the commodity cycle and is the first thing competitors and retailers will try to bargain away.
Source: Mondelez Q3 2026 earnings release.
Q3 2026 At A Glance
| Measure | Q3 2026 | Q3 2025 | Change |
|---|---|---|---|
| Net revenues | $9,967M | $9,744M | +2.3% |
| Organic net revenue growth | +2.1% | n/a | Volume/mix +1.8; price +0.3 |
| Adjusted gross margin | 34.2% | 30.4% | +3.8 pts |
| Adjusted operating income | $1,384M | $1,171M | +18.2% |
| Adjusted operating margin | 13.9% | 12.0% | +1.9 pts |
| GAAP diluted EPS | $1.02 | $0.57 | +78.9% |
| Adjusted EPS | $0.78 | $0.73 | +6.8% |
Source: Mondelez Q3 2026 earnings release.
What The Market Believes vs. What The Data Actually Shows
| Belief | What the data show |
|---|---|
| Pricing is driving sales | Pricing added only 0.3 points; volume/mix added 1.8 points, and Europe's pricing was -3.7 points. |
| Margin gains are demand-driven | Net revenues grew $223M (d); adjusted gross profit grew about $447M (d), of which $379M (d) is margin rate. |
| GAAP EPS +79% is the real number | GAAP includes a $543M mark-to-market gain on commodity and currency derivatives that adjusted results exclude. |
| Operating income +18% becomes EPS +18% | Adjusted operating income rose 18.2% but adjusted EPS only 6.8%; the extract does not itemize what absorbs the difference. |
| Buybacks and dividends are covered | Dividends and buybacks of $2.8B in nine months were 167% (d) of free cash flow of $1,659M. |
Forensic #1: Volume, Price And Region
| Region | Net revenues | Reported | Organic | Volume/mix | Pricing |
|---|---|---|---|---|---|
| Latin America | $1,387M | +12.0% | +6.9% | +0.8 | +6.1 |
| AMEA | $2,182M | +8.2% | +7.7% | +5.5 | +2.2 |
| Europe | $3,552M | -3.3% | -2.1% | +1.6 | -3.7 |
| North America | $2,846M | +1.1% | +1.6% | 0.0 | +1.6 |
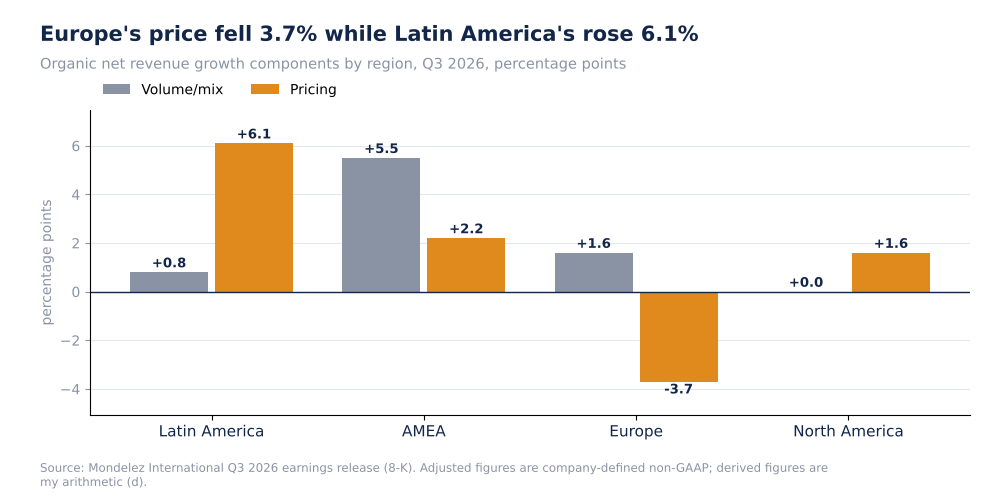
Mondelez volume/mix and pricing by region, Q3 2026, percentage points
Europe is the largest region (36% (d) of revenue) and the only one that shrank organically, because a 3.7-point price decline outweighed 1.6 points of volume gain. In contrast, Latin America's 6.1 points of pricing almost entirely explains its 6.9% organic growth, which is consistent with pricing in higher-inflation markets, though the extract does not say so. The group total of +0.3 points of pricing is the net of these opposite regional movements. The release does not state the cause of Europe's price decline; falling input costs and promotion are possible, but I cannot confirm either from the extract.
Why it matters. The group's 2.1% organic growth is a blend of two price-led regions, one price-deflating region and a flat North America. Volume is the healthier signal, and AMEA supplied most of it.
Source: Mondelez International Q3 2026 earnings release (8-K). Adjusted figures are company-defined non-GAAP; derived figures are my arithmetic (d).
Forensic #2: Where The Margin Came From
| Margin, % of net revenues | Q3 2025 | Q3 2026 | Change |
|---|---|---|---|
| GAAP gross profit | 26.8% | 39.4% | +12.6 pts |
| Adjusted gross profit | 30.4% | 34.2% | +3.8 pts |
| GAAP operating income | 7.6% | 17.6% | +10.0 pts |
| Adjusted operating income | 12.0% | 13.9% | +1.9 pts |
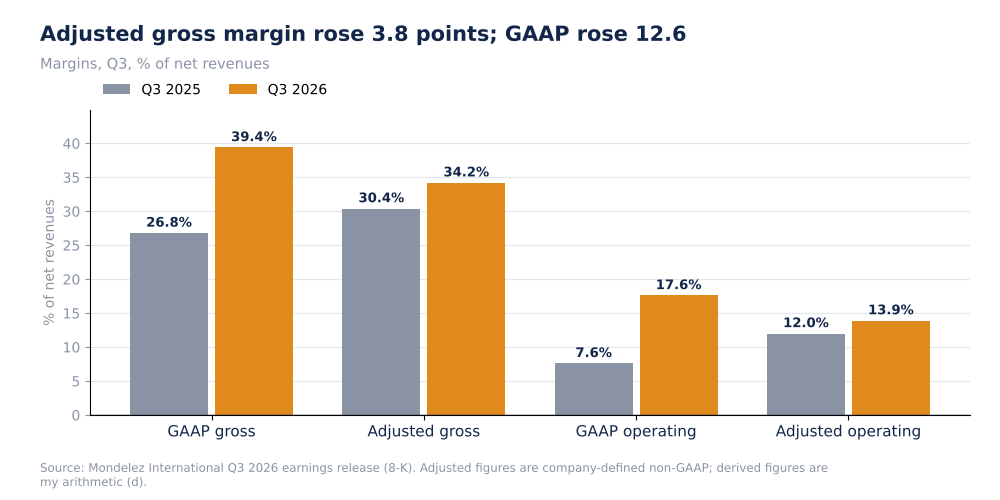
Mondelez GAAP and adjusted margins, Q3 2025 vs Q3 2026
The GAAP gross margin of 39.4% is inflated by the $543M derivative gain, which equals about 5.4 points (d) of net revenues; removing it gives about 34.0% (d), within a few tenths of the adjusted 34.2%. The more informative figure is the adjusted margin. Its 3.8-point rise came, according to the release, mainly from lower raw material costs, together with productivity, favorable volume/mix and higher net pricing. Pricing contributed only 0.3 points to revenue, so lower costs carried most of the gain.
Why it matters. GAAP margins are distorted by derivative marks and are not a guide to the run rate. The adjusted margin is the right base, and it depends on input costs.
Source: Mondelez International Q3 2026 earnings release (8-K). Adjusted figures are company-defined non-GAAP; derived figures are my arithmetic (d).
Forensic #3: Gross Profit Bridge
| $ millions (d) | Amount |
|---|---|
| Adjusted gross profit Q3 2025 (30.4% x $9,744M) | 2,962 |
| Revenue growth at the prior margin | +68 |
| Margin rate effect (3.8 pts x $9,967M) | +379 |
| Adjusted gross profit Q3 2026 (34.2% x $9,967M) | 3,409 |
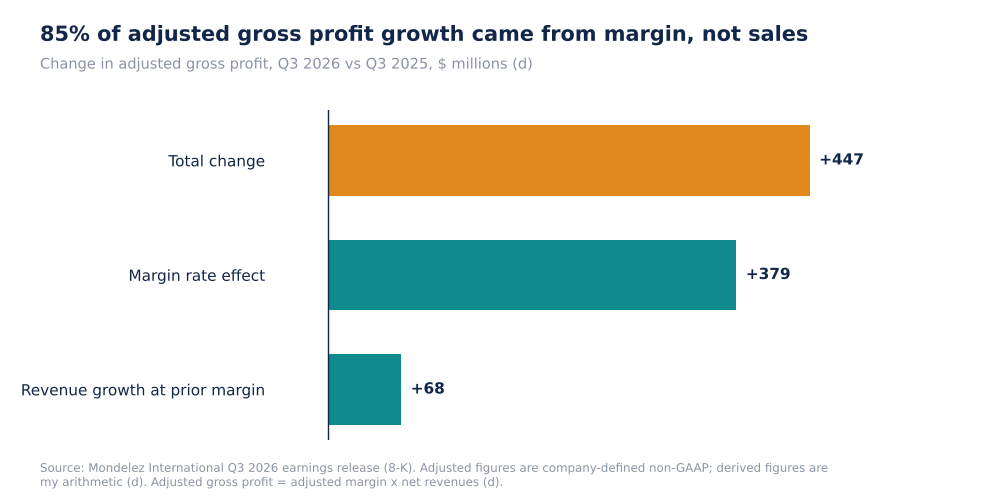
Mondelez adjusted gross profit change split into revenue and margin effects (d)
Gross profit rose about $447M (d) on revenue growth of $223M, so each added dollar of revenue came with two dollars of added gross profit. That ratio cannot persist: it reflects a cost decline, not growth. At constant costs, additional revenue would add gross profit at the 34.2% margin. Adjusted operating income rose $213M (d), which is less than the gross profit gain of about $447M (d), so roughly $234M (d) was reinvested or absorbed by higher overhead and marketing.
Why it matters. The profit improvement is a one-time level shift from lower costs. Next year's growth must come from volume and price, which together were only 2.1% this quarter.
Source: Mondelez International Q3 2026 earnings release (8-K). Adjusted figures are company-defined non-GAAP; derived figures are my arithmetic (d).
Forensic #4: Cash Returns Against Free Cash Flow
| Nine months, $ millions | 2026 | 2025 |
|---|---|---|
| Operating cash flow | 2,606 | 2,117 |
| Free cash flow | 1,659 | 1,236 |
| Dividends | 1,927 | n/a |
| Share repurchases | 845 | 1,893 |
| Dividends plus repurchases (d) | 2,772 | n/a |
| Returns / free cash flow (d) | 167% | n/a |
Free cash flow rose 34% (d), but dividends alone ($1,927M) exceeded it by $268M (d). Capital returned through dividends and repurchases was 167% (d) of free cash flow, so the difference (about $1,113M (d)) was funded from cash or borrowing. The full-year free cash flow guide of about $3B implies fourth-quarter free cash flow of about $1,341M (d). Repurchases fell from $1,893M to $845M, which is consistent with limited cash coverage.
Why it matters. The dividend is the commitment and the buyback is the flexible part; a payout above free cash flow is sustainable only for a short period.
Source: Mondelez International Q3 2026 earnings release (8-K). Adjusted figures are company-defined non-GAAP; derived figures are my arithmetic (d).
Valuation Snapshot
My source has no share price, so I cannot calculate multiples. The measures to track are below.
| Measure | Latest |
|---|---|
| Organic net revenue growth, Q3 | +2.1% |
| Adjusted gross margin | 34.2% |
| Adjusted operating margin | 13.9% |
| Nine-month free cash flow | $1,659M |
| 2026 guide | Organic at least 2%; adjusted EPS flat to +5% (constant currency); free cash flow about $3B |
What has to be true. Input costs must stay low enough to hold the 34% gross margin, and volume growth must continue outside Europe for the 2026 guide to be met.
Risks: What Would Break The Thesis
- Cost reversal. Cocoa and other costs are cited as a risk factor in the release.
- European pricing. Pricing is -3.7 points in the largest region.
- Payout above cash flow. Dividends exceed nine-month free cash flow.
- Gap between operating income and EPS. +18.2% vs +6.8% adjusted.
- Data limits. No share price, no Q3 cash flow and no acquisition price in the extract.
The reading would be wrong if the filing shows that the operating income to EPS gap is due to a one-off and that Europe's price decline is promotional and temporary.
What To Watch Next
- Adjusted gross margin against 34.2% and the share of the gain from raw materials.
- European pricing against -3.7 points.
- Volume/mix against +1.8 points.
- Fourth-quarter free cash flow against the implied $1.3B (d).
- Adjusted EPS growth against the guided flat to +5% (constant currency).
- Terms of the Undercover Snacks acquisition.

Sandeep Gupta
Independent equity research analyst publishing forensic theses on US-listed stocks. MBA, Politecnico di Milano School of Management (Milan, Italy).
Get new research in your inbox
Subscribe to receive forensic equity research the moment it's published. Free, no spam.
Discussion
Be the first to comment.