
Investment Thesis
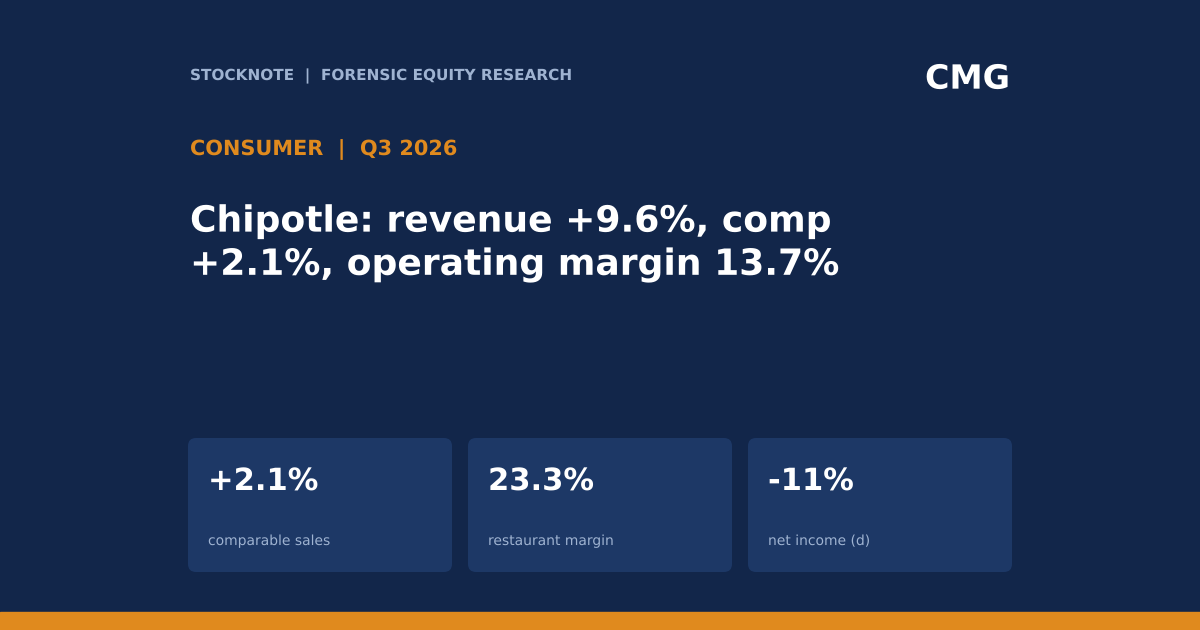
Chipotle's third-quarter 2026 revenue rose 9.6% (d) to $3,293.2 million, but net income fell 11.1% (d) to $339.9 million and diluted EPS was $0.27 against $0.29. Comparable restaurant sales rose 2.1% (transactions +0.8%, average check +1.3%), and about 9.0% (d) more restaurants than a year earlier (4,267 against 3,916) did the rest of the work. Restaurant-level operating margin fell to 23.3% from 24.5% and operating margin to 13.7% from 15.9%. Every cost line except food grew faster than revenue. Source note: I read the press release through a Finviz copy because the SEC exhibit could not be opened; dollar figures are in thousands in the release.
- Revenue and comparable sales. $3,293,162K (year-ago $3,003,444K); comparable sales +2.1% (+0.3%); transactions +0.8%; average check +1.3%.
- Margins. Restaurant-level margin 23.3% ($768,157K) against 24.5% ($735,583K); income from operations $451,964K (13.7%) against $477,172K (15.9%).
- Earnings. Net income $339,874K ($382,103K); diluted and adjusted EPS $0.27 ($0.29); effective tax rate 25.6% (23.1%).
- Restaurants. 84 company-owned opened in the quarter (53 with a Chipotlane); 4,267 company-owned at period end; 20 partner-operated.
- Capital. $110.0M of repurchases in Q3 at an average $34.05; nine-month repurchases $1,464.9M (2025: $1,683.7M); about $1.6B of authorization remaining.
- Guidance (unchanged). Low single-digit comparable sales growth; 350 to 370 openings; underlying tax rate 24% to 26%.
- This article contains no rating, price target or investment advice. Derived figures are marked (d).
Bottom line. Chipotle is growing by adding restaurants, not by selling more per restaurant, and the cost of running each restaurant is rising faster than the revenue it generates. The 2.1% comparable sales growth is below the growth in labor (12.0%, d), occupancy (13.3%, d) and other operating costs (16.7%, d) in dollars, so margin fell. For a company whose model depends on restaurant economics, the issue is that comparable sales need to rise at least as fast as per-restaurant costs.
Source (copy of press release): Chipotle Q3 2026 results via Finviz.
Q3 2026 At A Glance
| $ thousands | Q3 2026 | Q3 2025 | Change (d) |
|---|---|---|---|
| Total revenue | 3,293,162 | 3,003,444 | +9.6% |
| Restaurant-level operating margin | 23.3% (768,157) | 24.5% (735,583) | profit +4.4% |
| Income from operations | 451,964 | 477,172 | -5.3% |
| Operating margin | 13.7% | 15.9% | -2.2 pts |
| Net income | 339,874 | 382,103 | -11.1% |
| Diluted EPS | $0.27 | $0.29 | -6.9% |
| Company-owned restaurants | 4,267 | 3,916 | +9.0% |
Source (copy): Finviz copy of Chipotle release.
What The Market Believes vs. What The Data Actually Shows
| Belief | What the data show |
|---|---|
| Revenue growth of 9.6% shows strong demand | Comparable sales were +2.1%; unit growth of 9.0% (d) explains most of the revenue increase. |
| Margin pressure is about food costs | Food, beverage and packaging fell to 29.5% of revenue from 30.0%; labor rose 0.5 points, other operating costs 1.0 point and occupancy 0.1 point. |
| Restaurant margin explains the profit drop | Restaurant-level profit rose 4.4% (d); the costs below it (corporate and other) rose 22.4% (d). |
| Net income fell because of operations alone | The effective tax rate rose to 25.6% from 23.1%; pre-tax income fell about 8% (d), less than the 11.1% fall in net income. |
| Buybacks are accelerating | Nine-month repurchases fell to $1,464.9M from $1,683.7M (-13%, d); Q3 was $110.0M. |
Forensic #1: The Restaurant Cost Stack
| Cost line | Q3 2026 ($K) | % of revenue | Q3 2025 ($K) | % of revenue | Dollar growth (d) |
|---|---|---|---|---|---|
| Food, beverage and packaging | 972,360 | 29.5% | 902,445 | 30.0% | +7.7% |
| Labor | 847,507 | 25.7% | 756,669 | 25.2% | +12.0% |
| Occupancy | 179,403 | 5.4% | 158,314 | 5.3% | +13.3% |
| Other operating costs | 525,735 | 16.0% | 450,433 | 15.0% | +16.7% |
| Restaurant-level operating profit | 768,157 | 23.3% | 735,583 | 24.5% | +4.4% |
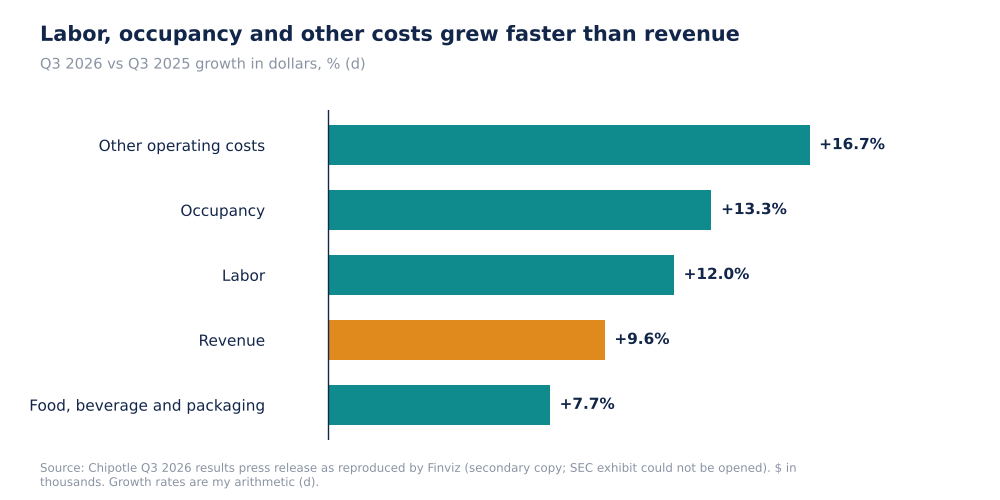
Chipotle Cost Line Growth Versus Revenue Growth, Q3 2026 (Self-Made, d)
The four cost lines sum to $2,525,005K (d), leaving restaurant-level profit of $768,157K, so the table ties to the release. Food costs grew 7.7% in dollars against revenue growth of 9.6%, which is leverage; the other three grew more than revenue. Other operating costs grew 16.7% (d), the fastest, and cost 1.0 point of margin. The release extract does not explain any of the lines.
Why it matters. A restaurant business with a fixed cost base gets operating leverage when comparable sales exceed cost inflation. With comparable sales at 2.1% and three cost lines growing 12% to 17% in dollars (partly because there are 9% more restaurants), the leverage was negative.
Source (copy): Finviz copy of Chipotle release. Growth rates are my arithmetic (d).
Forensic #2: From Restaurant Profit To Operating Income
| $ thousands | Q3 2026 | Q3 2025 | Change (d) |
|---|---|---|---|
| Restaurant-level operating profit | 768,157 | 735,583 | +4.4% |
| Costs below restaurant level (d) | 316,193 | 258,411 | +22.4% |
| Below-restaurant costs as % of revenue (d) | 9.6% | 8.6% | +1.0 pts |
| Income from operations | 451,964 | 477,172 | -5.3% |
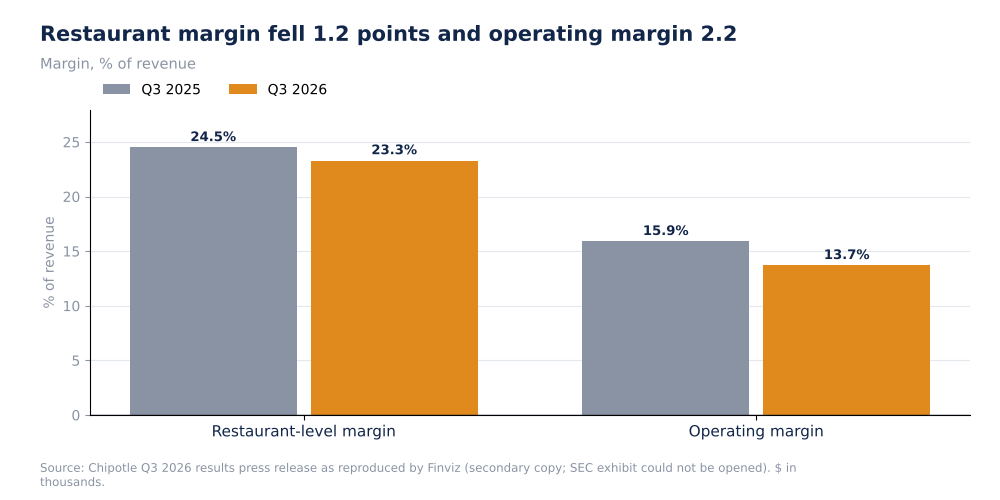
Chipotle Restaurant-Level And Operating Margin, Q3 2025 Vs Q3 2026 (Self-Made, Company Data)
The costs between restaurant-level profit and operating income (the release extract does not itemise them; they typically include general and administrative costs, depreciation and amortisation and pre-opening costs) rose 22.4% (d) against revenue growth of 9.6%. They took 9.6% of revenue against 8.6% (d) and account for 1.0 of the 2.2-point fall in operating margin (d), the rest of the fall (1.2 points) coming from the restaurant level.
Why it matters. The margin problem has two layers: restaurant economics (1.2 points) and corporate and depreciation costs (1.0 point), and fixing only the first does not restore the operating margin.
Source (copy): Finviz copy of Chipotle release. Derived figures marked (d).
Forensic #3: Growth Mix, Taxes And EPS
| Growth y/y (d) | Rate |
|---|---|
| Revenue | +9.6% |
| Company-owned restaurants (period end) | +9.0% |
| Restaurant-level profit | +4.4% |
| Comparable sales (reported) | +2.1% |
| Income from operations | -5.3% |
| Pre-tax income (d, from net income and tax rate) | -8.1% |
| Net income | -11.1% |
| EPS | -6.9% |
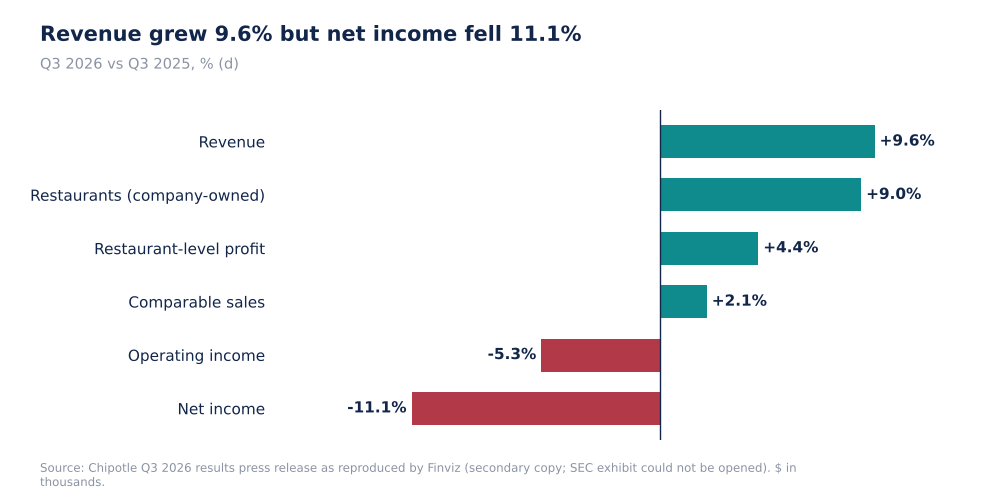
Chipotle Growth By Measure, Q3 2026 Vs Q3 2025 (Self-Made, d)
Revenue growth (9.6%) is 4.6 times comparable sales growth (d), and unit growth is 9.0%. Pre-tax income is back-solved from net income and the reported tax rate (25.6% and 23.1%) at about $456,820K against $496,883K (d), a fall of 8.1% (d), which means the higher tax rate cost about 3.0 points (d) of net income growth. EPS fell 6.9% (d) from rounded values, less than net income, which is consistent with a lower share count; the rounding makes the exact share change unknowable from these figures.
Why it matters. A restaurant chain adds profit by opening restaurants and by raising sales per restaurant. In this quarter only the first happened, and the new restaurants plus rising costs yielded less operating income than a year ago.
Source (copy): Finviz copy of Chipotle release. Pre-tax income is my back-solve (d).
Forensic #4: Pricing Sensitivity, Cash And Buybacks
| Illustration (d) | Value |
|---|---|
| Revenue added by 1% higher average check | about $32.9M |
| Restaurant-level margin if that revenue carried no extra cost | 24.1% (from 23.3%) |
| Margin gain per 1% of check (d) | 0.76 points |
| Cash and equivalents, Sept 30, 2026 | $634.2M (Dec 31, 2025: $350.5M) |
| Current investments | $268.4M ($698.6M) |
| Long-term investments | $100.4M ($197.1M) |
| Cash and investments combined (d) | $1,002.9M (Dec 31: $1,246.3M) |
The price sensitivity is a simple illustration, not Chipotle guidance: if a 1% higher average check dropped straight into restaurant profit (no extra food or labor), restaurant-level margin would rise by about 0.76 points (d). Average check actually rose 1.3% in the quarter, and the margin fell, so the cost increases were larger than that benefit. Cash and investments fell to about $1,003M (d) from about $1,246M (d) at year-end after $1,465M of nine-month repurchases, and about $1.6B of authorization remains.
Why it matters. The buyback has been funded from cash and investments, which are about 20% (d) lower than at year-end. At $34.05 a share, the Q3 repurchase retired about 3.2 million shares (d), small relative to the share count.
Source (copy): Finviz copy of Chipotle release. Illustration and sums are my arithmetic (d).
Valuation Snapshot
I have no Chipotle share price in my sources beyond the $34.05 average Q3 repurchase price, so I calculate only one reference: Q3 EPS of $0.27 annualised is $1.08 (d), and at $34.05 a share that is 31.5x (d), a historical reference and not a current multiple.
| Measure | Value |
|---|---|
| Q3 diluted EPS | $0.27 |
| Average Q3 repurchase price | $34.05 |
| Restaurant-level margin | 23.3% |
| 2026 comparable sales guide | low single digit |
What has to be true. To restore margin, comparable sales need to exceed per-restaurant cost growth, or the cost lines need to stop growing faster than revenue.
Risks: What Would Break The Thesis
- Secondary copy. The figures come from a Finviz reproduction of the release.
- No cost explanations. The extract does not say why labor, occupancy and other costs rose.
- Back-solved pre-tax income. It uses reported tax rates and rounded EPS.
- Comparable sales. Guided to low single digits, which is below cost growth.
- Cash. Cash and investments are lower than at year-end.
The reading would be wrong if the cost growth in the quarter was driven by one-time items that the extract does not disclose.
What To Watch Next
- Fourth-quarter comparable sales against 2.1% and transactions against +0.8%.
- Restaurant-level margin against 23.3%.
- Labor and other operating costs as % of revenue against 25.7% and 16.0%.
- Openings against the 350 to 370 guide.
- Tax rate against 24% to 26%.
- Buyback pace against $110.0M in Q3.

Sandeep Gupta
Independent equity research analyst publishing forensic theses on US-listed stocks. MBA, Politecnico di Milano School of Management (Milan, Italy).
Get new research in your inbox
Subscribe to receive forensic equity research the moment it's published. Free, no spam.
Discussion
Be the first to comment.