
Investment Thesis
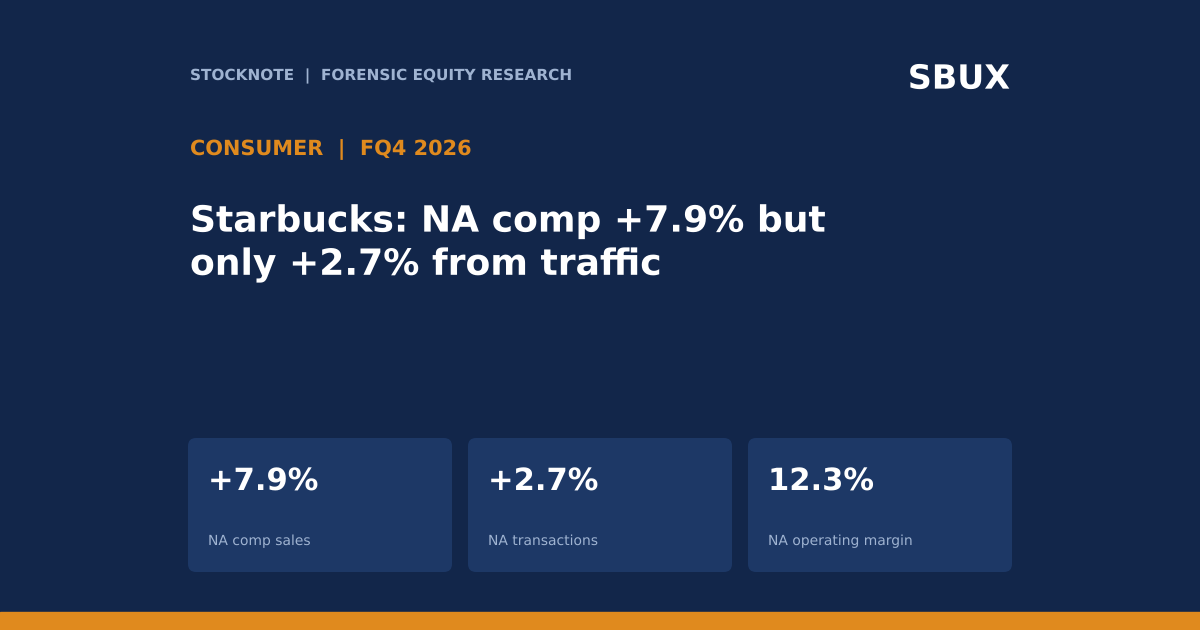
Starbucks closed fiscal 2026 with strong headline comparable sales: +7.2% globally in the fourth quarter, +7.9% in North America (+7.7% in the US) and +6.2% for the year. The composition matters more than the headline. In North America, average ticket rose 5% and transactions 2.7%; internationally, ticket rose 3.7% and transactions fell 2.8%, leaving comparable sales at +0.9%. North America's operating margin was 12.3% against 4.5% a year earlier. Consolidated revenue fell 4% to $9.1 billion because China retail operations moved to a licensed joint venture model. Source caution: I could not open Starbucks' own release; the figures below come from a FastCasual report of it and do not include EPS, consolidated operating margin or most prior-year comparisons.
- Comparable sales, Q4. Global +7.2%; North America +7.9% (ticket +5%, transactions +2.7%); US +7.7%; International +0.9% (ticket +3.7%, transactions -2.8%).
- Revenue. Consolidated $9.1B (-4%); North America $7.3B (+6%); fiscal 2026 $37.9B (+2%).
- Margin. North America operating margin 12.3% (year-ago 4.5%).
- Stores. 41,607 coffeehouses (32% company-operated, 68% licensed); North America 18,176 (-1%, including 250 closures in the quarter); US 16,781; 303 net new coffeehouses globally in Q4.
- Full year. Global comparable sales +6.2% (transactions +3.2%, ticket +3%). Share repurchases to resume in fiscal 2027.
- This article contains no rating, price target or investment advice. Derived figures are marked (d).
Bottom line. The recovery is real in North America and visible in margin, but about two thirds of its comparable sales growth (65%, d) is price and mix and not more customers. Internationally, traffic is falling. A comparable-sales number can hide this split, and the split determines how durable the margin gain is.
Source (secondary): FastCasual on Starbucks fiscal 2026 results.
Fiscal Q4 2026 At A Glance
| Measure | Q4 FY2026 | Comment |
|---|---|---|
| Global comparable sales | +7.2% | Prior-year figure not in source |
| North America comparable sales | +7.9% | Ticket +5%, transactions +2.7% |
| US comparable sales | +7.7% | |
| International comparable sales | +0.9% | Ticket +3.7%, transactions -2.8% |
| Consolidated net revenues | $9.1B (-4%) | China moved to licensed JV model |
| North America revenue / operating margin | $7.3B (+6%) / 12.3% | Year-ago margin 4.5% |
| Coffeehouses (global / North America) | 41,607 / 18,176 | North America -1% |
| Fiscal 2026 revenue / comparable sales | $37.9B (+2%) / +6.2% | Transactions +3.2%, ticket +3% |
Source (secondary): FastCasual.
What The Market Believes vs. What The Data Actually Shows
| Belief | What the data show |
|---|---|
| A 7.9% comp means traffic is back | Ticket contributed 5 points and transactions 2.7 points; ticket is 65% (d) of the combined effect. |
| Revenue decline signals weak demand | Revenue fell 4% mainly because China retail moved to licensed operation; North America revenue rose 6% and revenue outside North America fell about 31% (d). |
| International is the next growth leg | International comparable sales were +0.9% with transactions down 2.8%. |
| Store growth is rapid | North America coffeehouses fell 1% with 250 closures in the quarter; 303 net new stores globally means international and other grew. |
| Margin recovery is complete | North America margin rose to 12.3% from 4.5%, but the extract has no consolidated margin or EPS. |
Forensic #1: Price/Mix Versus Traffic
| Comparable sales, % | Total | Average ticket | Transactions |
|---|---|---|---|
| North America (Q4) | +7.9 | +5.0 | +2.7 |
| International (Q4) | +0.9 | +3.7 | -2.8 |
| Global (FY2026) | +6.2 | +3.0 | +3.2 |
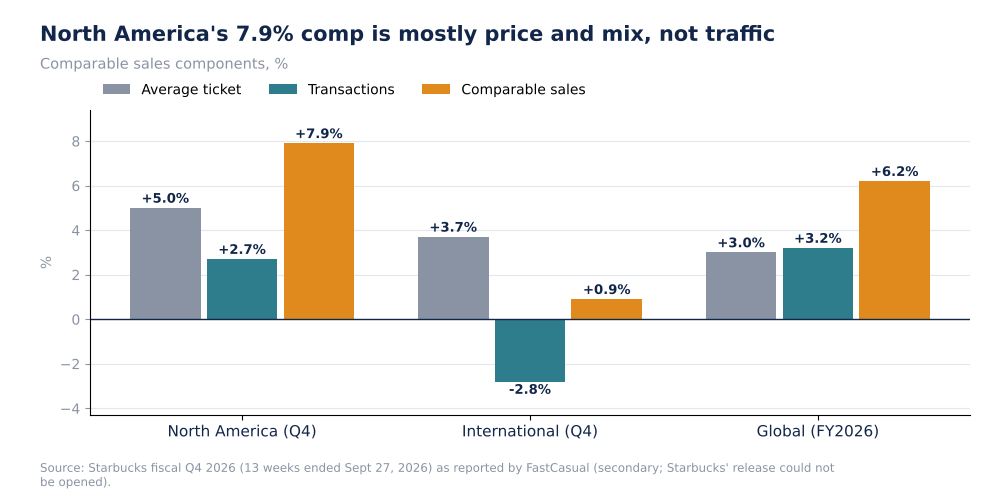
Starbucks Comparable Sales: Ticket And Traffic (Self-Made, Secondary Data)
Comparable sales are roughly the sum of ticket and transactions, so in North America 5.0 + 2.7 = 7.7 against a reported 7.9, a 0.2-point difference that I attribute to rounding and cross-effects (d). Across the full year, ticket and traffic contributed almost equally (3.0 and 3.2), so the fourth-quarter mix is more price-heavy than the year: ticket's share of the combined effect rose from 48% (d) to 65% (d). Internationally, ticket added 3.7 points and traffic took away 2.8.
Why it matters. Ticket growth can come from price increases and mix, which are accepted until customers trade down or stop visiting. Traffic is the more durable signal because it shows more occasions.
Source (secondary): FastCasual. Shares are my arithmetic (d).
Forensic #2: Margin, Revenue And The China Effect
| $ billions | Q4 FY2026 | Prior-year (d) | Change |
|---|---|---|---|
| Consolidated revenue | 9.1 | 9.48 | -4% |
| North America revenue | 7.3 | 6.89 | +6% |
| Revenue outside North America (d) | 1.8 | 2.59 | -31% |
| North America operating margin | 12.3% | 4.5% | +7.8 pts |
| North America operating income (d) | 0.90 | 0.31 | +0.59 |
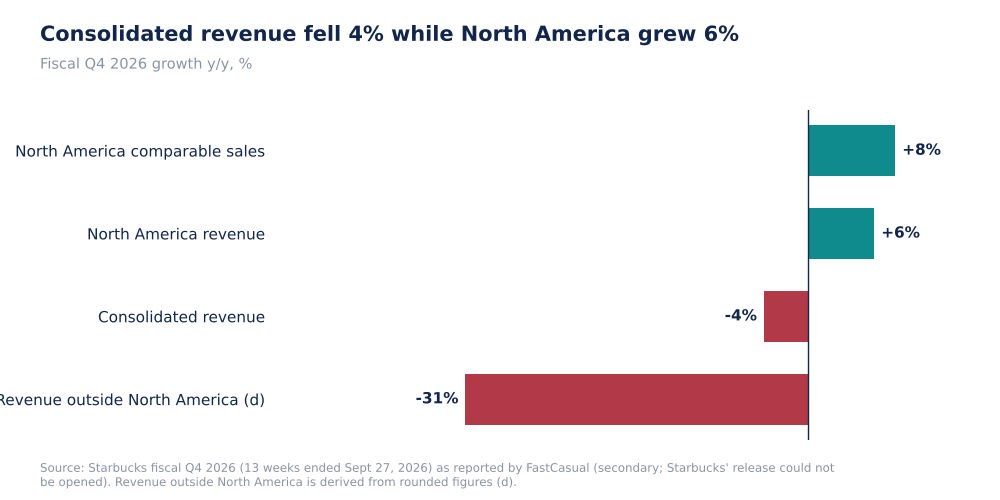
Starbucks Revenue Growth By Region, Fiscal Q4 2026 (Self-Made, Secondary Data, d)
Prior-year revenue is back-solved from rounded percentages, so the figures above are approximations. Revenue outside North America fell about 31% (d), which matches the explanation that China retail is no longer consolidated as company-operated sales. North America operating income is about $0.90B (d), up about $0.59B (d) from $0.31B (d), on revenue that rose about $0.41B (d). The incremental margin on that revenue is far above 100%, which means most of the gain came from cost efficiency or lower charges, not volume; the extract does not say which.
Why it matters. A licensed model replaces company-operated sales with royalty and product sales at higher margin and lower capital. Revenue falls but profit per dollar of revenue rises, so revenue alone is a poor indicator for this change.
Source (secondary): FastCasual. Back-solved figures are approximate (d).
Forensic #3: The Store Base
| Coffeehouses | Count | Share of global (d) |
|---|---|---|
| Global | 41,607 | 100% |
| North America | 18,176 | 44% |
| United States | 16,781 | 40% |
| Rest of North America (d) | 1,395 | 3% |
| International and other (d) | 23,431 | 56% |
| Company-operated (32%) (d) | 13,314 | 32% |
| Licensed (68%) (d) | 28,293 | 68% |
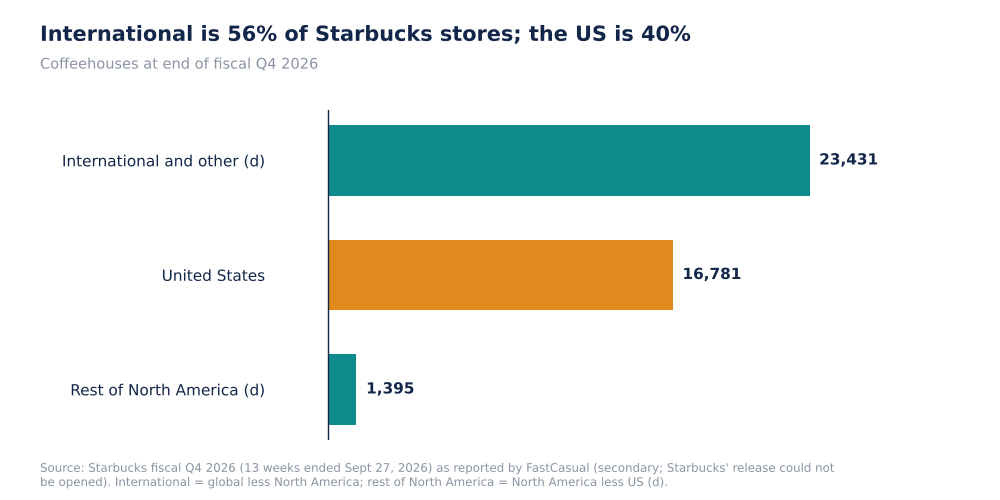
Starbucks Coffeehouses By Region, End Of Fiscal Q4 2026 (Self-Made, d)
The US accounts for 40% of the global store base and international and other for 56% (d), yet international comparable sales are barely positive. The licensed share of 68% means most stores are not owned by Starbucks, so their sales reach Starbucks as royalties and product sales and not as retail revenue. North America had 250 closures in the quarter and a net decline of 1% for the year, while 303 net new coffeehouses were added globally in the quarter; the source does not give the regional split of those additions.
Why it matters. Store closures with rising comparable sales is how a company improves productivity per store; it is also how a company manages decline. The traffic data in Forensic #1 are what separate the two.
Source (secondary): FastCasual. Derived figures marked (d).
Forensic #4: Full Year And Outlook
| Fiscal 2026 | Value |
|---|---|
| Revenue | $37.9B (+2%) |
| Global comparable sales | +6.2% |
| Transactions / ticket | +3.2% / +3.0% |
| Share repurchases | To resume in fiscal 2027 |
| Other guidance | Not in the source |
The full-year comparable sales of +6.2% were split evenly between traffic and ticket, so the year as a whole was healthier than the fourth quarter alone suggests on traffic. Revenue of $37.9B (+2%) is below the comparable sales growth because of the China change and store closures. The decision to resume repurchases is the only capital allocation signal in the source; no EPS, cash flow or capex is available to me, so I cannot size it.
Why it matters. A return of buybacks after a restructuring is a statement of confidence about cash flow, but without the cash flow figures I cannot test it.
Source (secondary): FastCasual.
Valuation Snapshot
My source has no EPS, no cash flow and no share price, so I cannot calculate multiples. The operating measures to track are comparable sales (+7.2% global in Q4), transactions (+2.7% in North America) and North America operating margin (12.3%).
| Measure | Latest |
|---|---|
| Global comparable sales, Q4 | +7.2% |
| North America transactions | +2.7% |
| International transactions | -2.8% |
| North America operating margin | 12.3% |
What has to be true. The margin recovery is sustainable only if traffic stays positive while ticket growth slows; if ticket is the only driver, comparable sales may fade.
Risks: What Would Break The Thesis
- Secondary source. Starbucks' release was not opened.
- Missing data. No EPS, consolidated margin or cash flow.
- Back-solved revenue. Prior-year figures are derived from rounded percentages.
- Traffic. International transactions are falling.
- Price dependence. About two thirds of North America's comp is ticket (d).
The reading would be wrong if Starbucks' own release shows a different traffic split or a consolidated margin that does not support the North America picture.
What To Watch Next
- Starbucks' full release and 10-K for EPS, margin and cash flow.
- North America transactions against +2.7%.
- International transactions against -2.8%.
- North America operating margin against 12.3%.
- Store count against 18,176 and the pace of closures.
- Timing and size of buybacks in fiscal 2027.

Sandeep Gupta
Independent equity research analyst publishing forensic theses on US-listed stocks. MBA, Politecnico di Milano School of Management (Milan, Italy).
Get new research in your inbox
Subscribe to receive forensic equity research the moment it's published. Free, no spam.
Discussion
Be the first to comment.