
Investment Thesis
Philip Morris International reported Q3 2026 net revenues of $11,438M (+5.5%, +7.1% organic) and adjusted EPS of $2.36 (+5.4%). The company is best known for its shift from cigarettes to smoke-free products, but in Q3 the fastest-growing large revenue line was international combustibles (+7.8% organic) on flat cigarette volume, which means price and mix did the work. The smoke-free business grew 3.4% organically, slower than the nine-month trend.
- Revenue. Net revenues $11,438M (+5.5% reported, +7.1% organic); currency subtracted $155M.
- Segments. International combustibles $6,725M (+6.5%, +7.8% organic); International smoke-free $3,867M (+0.7%, +3.4% organic); US $845M (+22.7% reported and organic).
- Profit. Adjusted operating income $5,117M (+9.6%); adjusted margin 44.7% vs 43.1%; reported operating income $4,866M (+14.1%); reported EPS $2.12 ($2.23); adjusted EPS $2.36 ($2.24).
- Volumes. Total shipments 206.2B units (+0.6%): cigarettes 158.0B (flat), smoke-free 48.2B (+2.7%), heated tobacco units 41.5B (+1.5%), ZYN 3.2B (+4.2%).
- Guidance. 2026 adjusted EPS $8.29 to $8.44; operating cash flow about $13.5B; no share repurchases planned.
- This article contains no rating, price target or investment advice. Derived figures are marked (d).
Bottom line. The Q3 profit growth was carried by pricing in combustibles, and the smoke-free transition slowed in volume terms. That is not a negative on its own, since cash from cigarettes funds the transition, but it is a different story from the one in the company's description of itself.
Source: Philip Morris International Q3 2026 earnings release.
Q3 2026 At A Glance
| Measure | Q3 2026 | Q3 2025 / change |
|---|---|---|
| Net revenues | $11,438M | +5.5% reported; +7.1% organic |
| Adjusted operating income | $5,117M | +9.6% |
| Adjusted operating income margin | 44.7% | 43.1% |
| Reported operating income | $4,866M | +14.1% |
| Reported diluted EPS | $2.12 | $2.23 (-4.9%) |
| Adjusted diluted EPS | $2.36 | $2.24 (+5.4%) |
| Cigarette shipments | 158.0B | Flat |
| Smoke-free shipments | 48.2B | +2.7% |
Source: Philip Morris International Q3 2026 earnings release.
What The Market Believes vs. What The Data Actually Shows
| Belief | What the data show |
|---|---|
| Smoke-free is driving the growth | International smoke-free revenue grew 3.4% organically against 7.8% for combustibles; the US segment (ZYN) grew 22.7%. |
| Cigarette volume is in steady decline | Q3 cigarette shipments were flat; the nine-month decline of 1.2% implies a larger decline earlier in the year (d). |
| Operating income growth flows to EPS | Reported operating income rose 14.1% but reported EPS fell 4.9%; the gap is below the operating line. |
| Currency is a tailwind | Currency subtracted $155M of Q3 revenue; the guided full-year currency benefit to EPS was cut to $0.18 from $0.24. |
| Buybacks support EPS | No repurchases are planned for 2026. |
Forensic #1: Which Business Grew
| Q3 2026, $M | Revenue | Reported | Organic |
|---|---|---|---|
| International combustibles | 6,725 | +6.5% | +7.8% |
| International smoke-free | 3,867 | +0.7% | +3.4% |
| US (ZYN, cigars, wellness) | 845 | +22.7% | +22.7% |
| Total | 11,438 | +5.5% | +7.1% |
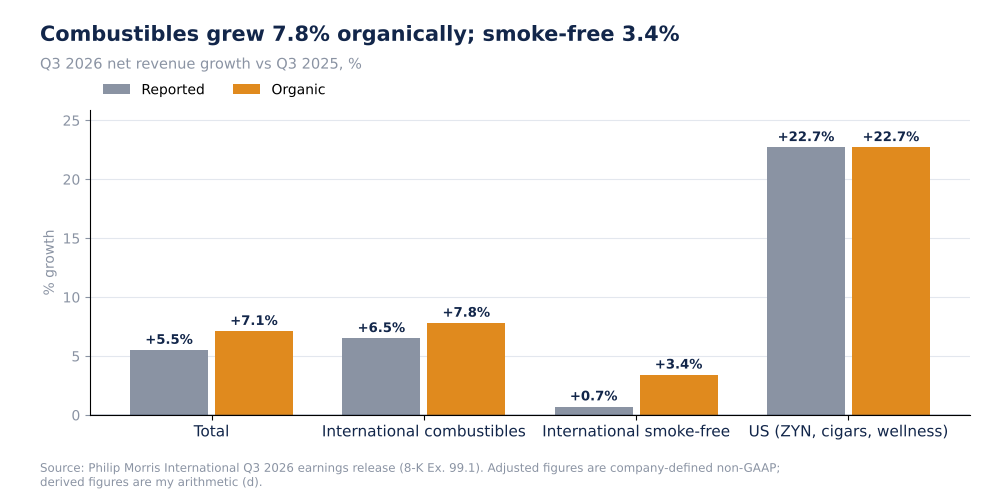
Philip Morris net revenue growth by segment, reported and organic, Q3 2026
International combustibles revenue grew 7.8% organically while cigarette volume was flat at 158.0B units, which means price and mix were worth roughly 7.8 points (d). International smoke-free grew 3.4% organically on 2.7% unit growth for the whole smoke-free category (which includes the US ZYN pouches and so is not a like-for-like volume match). The segments sum to the total (3,867 + 6,725 + 845 = 11,437, d), so the US growth of 22.7% on $845M adds about $0.16B (d) of the $0.6B total increase.
Why it matters. Pricing on a shrinking base is a legitimate but finite source of growth: each year's price increase is made against a customer base that is declining. The transition story depends on smoke-free growth that replaces it.
Source: Philip Morris International Q3 2026 earnings release (8-K Ex. 99.1). Adjusted figures are company-defined non-GAAP; derived figures are my arithmetic (d).
Forensic #2: Volume Trends
| Volumes, billions of units | Q3 2026 | Q3 growth | Nine months 2026 | Nine-month growth | First half growth (d) |
|---|---|---|---|---|---|
| Cigarettes | 158.0 | 0.0% | 452.2 | -1.2% | -1.8% |
| Smoke-free products | 48.2 | +2.7% | 143.4 | +6.4% | +8.4% |
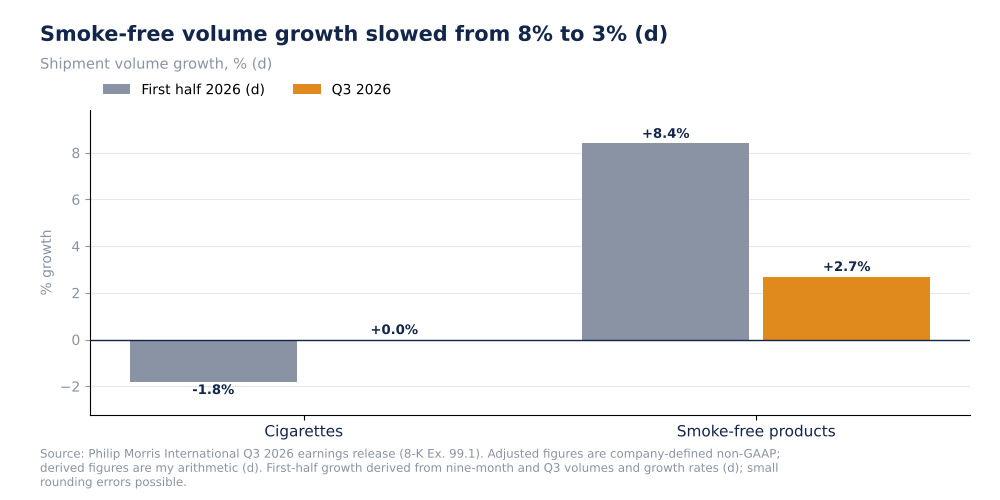
Philip Morris volume growth, first half 2026 (derived) vs Q3 2026
Subtracting Q3 from the nine-month figures gives implied first-half growth of -1.8% for cigarettes and +8.4% for smoke-free products (d). In Q3, cigarette declines stopped (0.0%) and smoke-free growth fell to 2.7%. Neither is a collapse of its trend; the guidance now expects a cigarette decline similar to the year-to-date trend (previously about 2% to 3%). The company does not give a reason in my extract, so I cannot say whether the Q3 change reflects timing, inventory movements or underlying demand.
Why it matters. If smoke-free growth settles near 3% while cigarettes stabilize, the company shifts from a volume-driven transition to a price-driven one.
Source: Philip Morris International Q3 2026 earnings release (8-K Ex. 99.1). Adjusted figures are company-defined non-GAAP; derived figures are my arithmetic (d).
Forensic #3: Reported Versus Adjusted Earnings
| Item | Q3 2026 | Q3 2025 | Change |
|---|---|---|---|
| Reported operating income | $4,866M | $4,265M (d) | +14.1% |
| Adjusted operating income | $5,117M | $4,669M (d) | +9.6% |
| Gap, adjusted minus reported (d) | $251M | $404M | Narrowed |
| Reported EPS | $2.12 | $2.23 | -4.9% |
| Adjusted EPS | $2.36 | $2.24 | +5.4% |
| Gap, adjusted minus reported (d) | $0.24 | $0.01 | Widened |
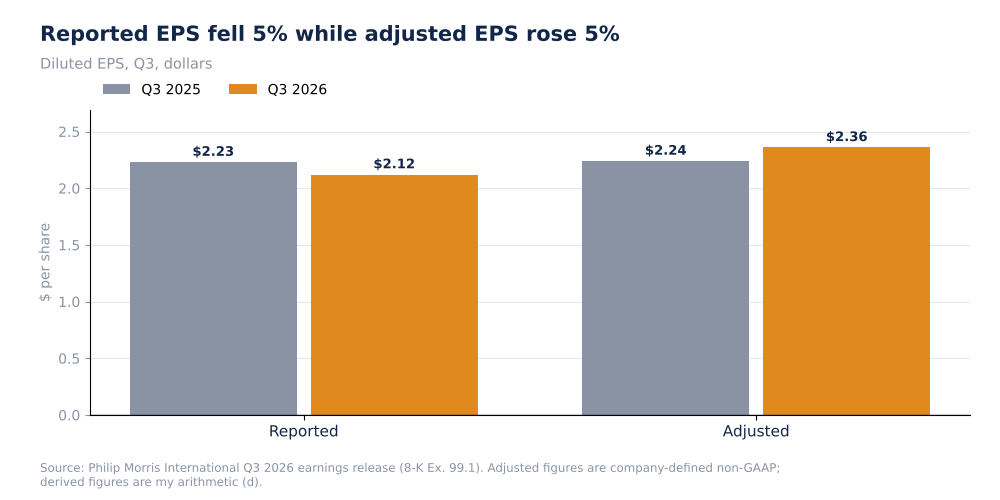
Philip Morris reported and adjusted diluted EPS, Q3
The operating-income gap between adjusted and reported narrowed by about $153M (d), yet the EPS gap widened from $0.01 to $0.24 (d). Since the operating gap is smaller, the extra difference must come from items below operating income, such as interest, taxes or investment-related items. My extract does not itemize those, so I flag it as the main open question on earnings quality. The reported EPS decline of 4.9% alongside a 14.1% rise in reported operating income is the visible symptom.
Why it matters. The adjusted EPS of $2.36 excludes about $0.24 (d) of items that reduced reported EPS; if those recur, the adjusted figure overstates what shareholders earn.
Source: Philip Morris International Q3 2026 earnings release (8-K Ex. 99.1). Adjusted figures are company-defined non-GAAP; derived figures are my arithmetic (d).
Forensic #4: Incremental Margin And The Guide
| Adjusted EPS | Value |
|---|---|
| Nine months 2026 | $6.52 |
| Guidance for 2026 | $8.29 to $8.44 |
| Implied Q4 2026 (d) | $1.77 to $1.92 |
| Q4 2025 (d) | $1.71 |
| Implied Q4 growth (d) | +4% to +12% |
Adjusted operating income rose about $448M (d) on $596M (d) of added revenue, an incremental margin of about 75% (d); the starting prior-year margin was 43.1%. Prior-year amounts are back-solved from rounded growth rates, so the figure is approximate. The very high incremental margin is consistent with price-led growth, since price falls through with little added cost. The guidance implies Q4 growth of +4% to +12% (d), lower than Q3 at the low end, and the currency benefit to full-year EPS was reduced by $0.06.
Why it matters. A price-led margin has no volume cost, but it depends on pricing power continuing against a slowly shrinking customer base.
Source: Philip Morris International Q3 2026 earnings release (8-K Ex. 99.1). Adjusted figures are company-defined non-GAAP; derived figures are my arithmetic (d).
Valuation Snapshot
My source has no share price, so I cannot calculate multiples. The cash profile is notable: operating cash flow of about $13.5B less capital expenditure of $1.4B to $1.6B implies free cash flow of about $11.9B to $12.1B (d), with no repurchases planned and net debt to adjusted EBITDA near 2.0x by year end.
| Measure | Latest |
|---|---|
| Adjusted operating income margin | 44.7% |
| 2026 adjusted EPS guide | $8.29 to $8.44 |
| 2026 operating cash flow guide | About $13.5B |
| Implied free cash flow (d) | $11.9B to $12.1B |
| Net debt / adjusted EBITDA target | About 2.0x |
What has to be true. Combustible pricing must continue and smoke-free volume must re-accelerate for the guided growth to be reached without relying on currency.
Risks: What Would Break The Thesis
- Pricing dependence. Combustibles drove Q3 growth on flat volume.
- Smoke-free slowdown. Q3 volume growth was 2.7% vs about 8% in the first half (d).
- Below-the-line items. Reported EPS fell while operating income rose.
- Currency. The guided currency benefit was cut by $0.06.
- Data limits. No share price, no Q3 cash flow and no net debt figure in the extract.
The reading would be wrong if the release shows that the Q3 smoke-free slowdown reflects timing and that the below-the-line items are one-offs.
What To Watch Next
- Smoke-free volume growth against +2.7% and the first-half rate of about 8% (d).
- Cigarette volume against 0.0% in Q3 and the guided decline.
- Reported-to-adjusted EPS gap against $0.24 (d).
- Organic combustibles revenue growth against +7.8%.
- ZYN shipments against 3.2B pouches and US revenue growth of 22.7%.
- Q4 adjusted EPS against the implied $1.77 to $1.92 (d).

Sandeep Gupta
Independent equity research analyst publishing forensic theses on US-listed stocks. MBA, Politecnico di Milano School of Management (Milan, Italy).
Get new research in your inbox
Subscribe to receive forensic equity research the moment it's published. Free, no spam.
Related Research
Latest earnings releases: PM
— Philip Morris International Reports 2026 Third-Quarter & First Nine-Months Results
Discussion
Be the first to comment.