
Investment Thesis
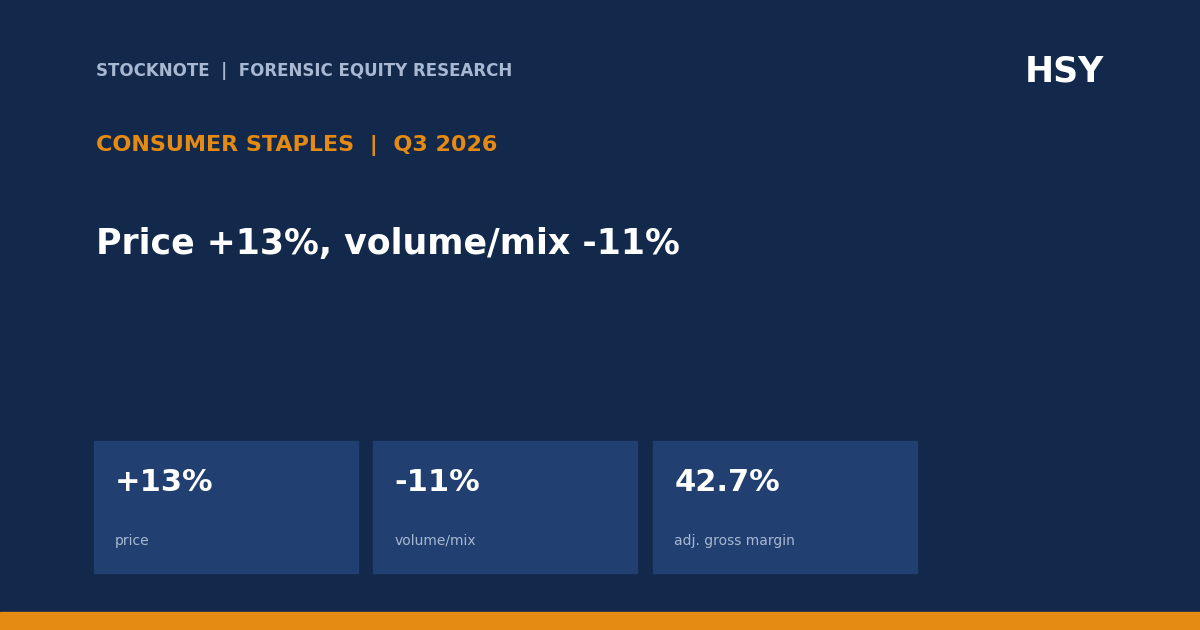
Hershey reported Q3 2026 net sales of $3,275.5M, up 3.0%, but organic constant-currency growth was only 0.8%. In North America Confectionery, 13 points of price were offset by an 11-point volume/mix decline. Profit recovered sharply, yet reported gross margin included derivative mark-to-market gains and adjusted EPS included $0.22 of Q3 tariff refunds. This is a price-elasticity and earnings-quality quarter, not a clean volume recovery.
- Sales. Net sales $3,275.5M, +3.0%; organic constant-currency +0.8%.
- Confectionery. Organic price +13%; volume/mix -11%; organic sales +1.6%.
- Margins. Reported gross margin 46.1%; adjusted gross margin 42.7%; adjusted operating margin 23.0%.
- Earnings. GAAP EPS $2.88; adjusted EPS $2.64; Q3 tariff refunds added $0.22 to adjusted EPS.
- Cross-reference. The older article “Hershey: The Forensic Case That Consensus Errors Have Created A Mispricing” covered an earlier period. For current peer context, see “Mondelez Q3 2026: Organic +2.1%, Gross Margin +3.8 Points” and “Procter & Gamble Q1 FY27: Sales +4%, Margin Under Strain.”
- This article contains no rating, price target or investment advice. Derived figures are marked (d).
Bottom line. Pricing is protecting dollars, but it is also removing units. The margin rebound is real in the reported accounts, yet part of it comes from derivative gains and tariff refunds that should not be extrapolated as ordinary operating leverage.
Source: Hershey Q3 2026 earnings release (8-K Ex. 99.1).
Q3 2026 At A Glance
| Measure | Q3 2026 | Q3 2025 / comparison |
|---|---|---|
| Net sales | $3,275.5M | +3.0% |
| Organic constant-currency sales | +0.8% | |
| GAAP EPS | $2.88 | $1.36 |
| Adjusted EPS | $2.64 | $1.30 (d) |
| Reported gross margin | 46.1% | 32.6% |
| Adjusted gross margin | 42.7% | 31.8% (d) |
Source: Hershey Q3 2026 earnings release (8-K Ex. 99.1). Derived figures are marked (d).
What The Market Believes vs. What The Data Actually Shows
| Belief | What the data show |
|---|---|
| Price can offset cocoa inflation without demand damage | North America Confectionery price added 13 points while volume/mix removed 11. |
| A 3% sales gain means the core business grew 3% | Organic constant-currency sales grew 0.8%; the LesserEvil acquisition added 2.1 points. |
| The margin recovery is all operating improvement | Reported gross margin includes derivative mark-to-market gains; adjusted EPS includes $0.22 of tariff refunds. |
| GAAP is more conservative than adjusted this quarter | GAAP EPS of $2.88 exceeded adjusted EPS of $2.64 because derivative gains more than offset excluded costs. |
Forensic #1: Price Versus Volume/Mix
Revenue growth can be decomposed into price and volume/mix. Price-led growth protects nominal dollars, but a large negative volume response tests brand elasticity.
| Segment | Organic price | Organic volume/mix | Organic sales |
|---|---|---|---|
| N.A. Confectionery | +13% | -11% | +1.6% |
| N.A. Salty Snacks | +1% | +1% | +2.3% |
| International | +4% | -14% | -9.7% |
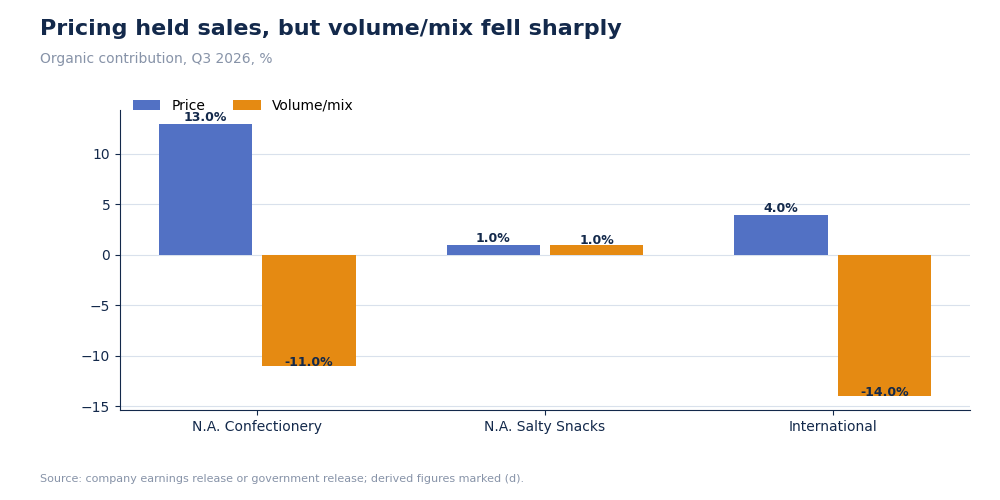
Hershey Q3 2026 organic price and volume/mix by segment
The confectionery business kept only about 2 points of organic growth after 13 points of price and an 11-point volume/mix loss. International was worse: four points of price could not offset a 14-point unit/mix decline. Salty Snacks was the only segment with balanced positive price and volume.
Why it matters. Unit economics can improve while the franchise loses physical throughput. That works only until competitors, private label or customer trade-down limit further pricing.
Source: Hershey Q3 2026 earnings release (8-K Ex. 99.1)
Forensic #2: Reported Growth Versus Organic Growth
Reported sales include acquisitions and currency. Organic constant-currency growth removes both and is the cleaner measure of same-business demand.
| Growth bridge | Points |
|---|---|
| Reported sales growth | +3.0% |
| Acquisition benefit | +2.1% |
| FX benefit | +0.1% |
| Organic constant-currency | +0.8% |
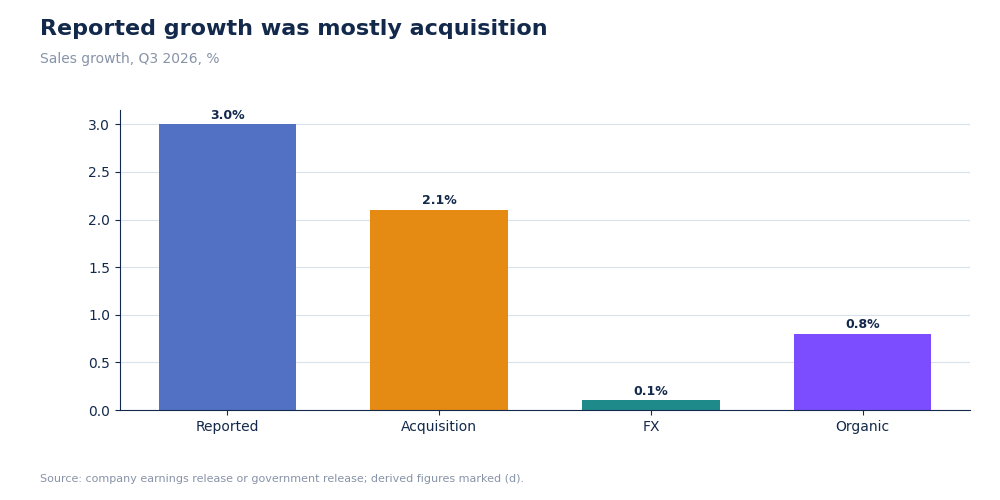
Hershey reported and organic sales growth
The LesserEvil acquisition supplied about 70% of the reported growth rate (2.1 of 3.0 points, d). Organic growth was positive but thin, and it came with double-digit confectionery pricing.
Why it matters. Reported growth overstates the momentum of the pre-acquisition portfolio.
Source: Hershey Q3 2026 earnings release (8-K Ex. 99.1)
Forensic #3: Reported And Adjusted Margins
Commodity derivatives can create accounting gains before the related inventory is sold. Hershey therefore excludes mark-to-market effects from adjusted results until the inventory transaction occurs.
| Margin | Q3 2025 | Q3 2026 | Change |
|---|---|---|---|
| Reported gross | 32.6% | 46.1% | +13.5 pts |
| Adjusted gross | 31.8% (d) | 42.7% | +10.9 pts |
| Reported operating | 13.7% (d) | 25.0% | +11.3 pts |
| Adjusted operating | 13.3% (d) | 23.0% | +9.7 pts |
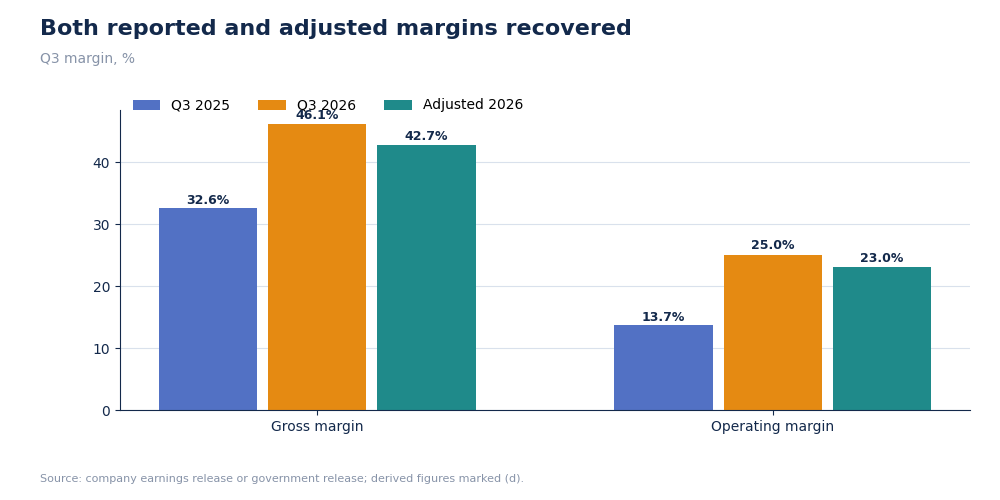
Hershey reported and adjusted margins, Q3
Both bases show a large recovery, so the improvement is not only derivative accounting. Still, reported operating profit of $817.7M exceeded adjusted operating profit of $754.0M by $63.7M (d), reversing the usual direction of an adjustment.
Why it matters. The sustainable margin is closer to the adjusted line, while even that line includes tariff refunds in EPS.
Source: Hershey Q3 2026 earnings release (8-K Ex. 99.1)
Forensic #4: EPS Quality And Guidance
A reconciliation is most useful when it explains why GAAP and adjusted earnings move differently. Here, derivative gains lift GAAP while tariff refunds lift adjusted earnings.
| EPS item | Q3 2026 |
|---|---|
| GAAP diluted EPS | $2.88 |
| Derivative mark-to-market gain | -$0.56 adjustment |
| Business realignment | +$0.07 |
| Acquisition/integration | +$0.18 |
| Tax effect | +$0.07 |
| Adjusted diluted EPS | $2.64 |
| Tariff refund inside adjusted EPS | $0.22 |
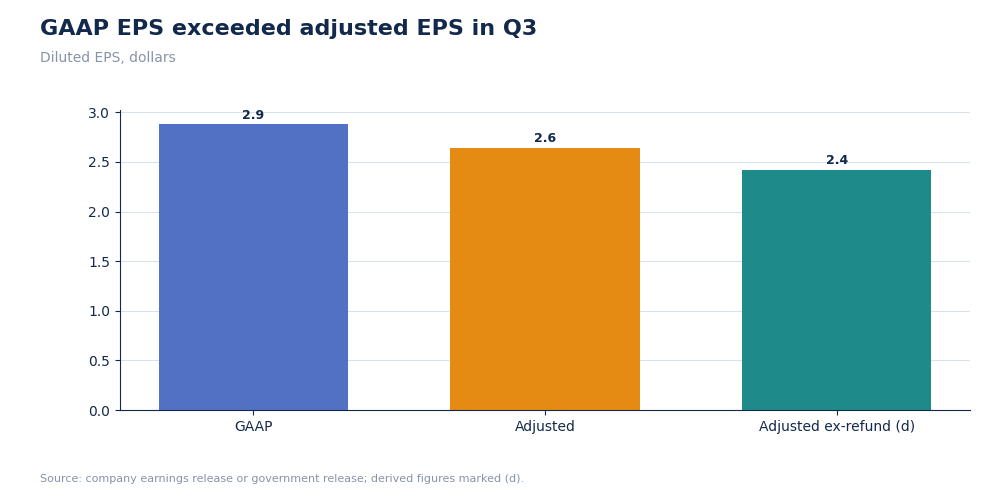
Hershey GAAP and adjusted diluted EPS, Q3 2026
Adjusted EPS rose about 103% from an implied $1.30 (d), but removing the $0.22 refund gives $2.42 (d), still an 86% increase (d). The refund is not the whole recovery, but it raises the apparent run rate by 8% (d).
Why it matters. A strong base can still be overstated when unusual benefits sit inside the company-defined adjusted number.
Source: Hershey Q3 2026 earnings release (8-K Ex. 99.1)
Valuation Snapshot
At $171.25 per share, Hershey had a market capitalization of $34.42B. The finance feed showed a trailing P/E of 10.0x, but that figure is distorted by derivative mark-to-market gains. Against the midpoint of Hershey's adjusted 2026 EPS guidance of $8.66 (d), the forward adjusted P/E is 19.8x (d), with a 5.1% adjusted earnings yield (d).
| Measure | Value |
|---|---|
| Share price | $171.25 |
| Market capitalization | $34.42B |
| Reported trailing P/E | 10.0x |
| Forward adjusted P/E | 19.8x (d) |
| Adjusted earnings yield | 5.1% (d) |
| Market cap / annualized Q3 sales | 2.63x (d) |
Investment read-through. The apparent 10x headline multiple is misleading because GAAP earnings include derivative gains. At nearly 20x adjusted guidance, investors are still paying for a recovery in volume and durable margin normalization. If adjusted EPS were 10% below guidance, the multiple would rise to 22.0x (d); 10% above guidance would reduce it to 18.0x (d).
What has to be true. Volume declines must moderate before pricing fades, and recurring adjusted earnings must justify a multiple almost twice the reported trailing P/E.
Source: Market quote and market capitalization from the in-session U.S. equity market feed; earnings guidance from the Hershey Q3 2026 earnings release. Market data: latest quote retrieved after the November 2, 2026 U.S. trading session.
Risks: What Would Break The Thesis
- Elasticity. Further price increases could deepen unit declines.
- Adjustment quality. Derivative gains and tariff refunds may not repeat.
- Acquisition mix. LesserEvil contributed most of reported growth.
- International. Organic constant-currency sales fell 9.7%.
The reading would be too cautious if volume stabilizes quickly while productivity and lower commodity costs preserve the new margin base.
What To Watch Next
- North America Confectionery volume/mix against -11%.
- Adjusted gross margin against 42.7%.
- Any tariff refund beyond the $0.25 included year to date.
- International organic sales against -9.7%.
- Organic sales growth against the roughly 3% full-year guide.

Sandeep Gupta
Independent equity research analyst publishing forensic theses on US-listed stocks. MBA, Politecnico di Milano School of Management (Milan, Italy).
Get new research in your inbox
Subscribe to receive forensic equity research the moment it's published. Free, no spam.

Discussion
Be the first to comment.