
Investment Thesis
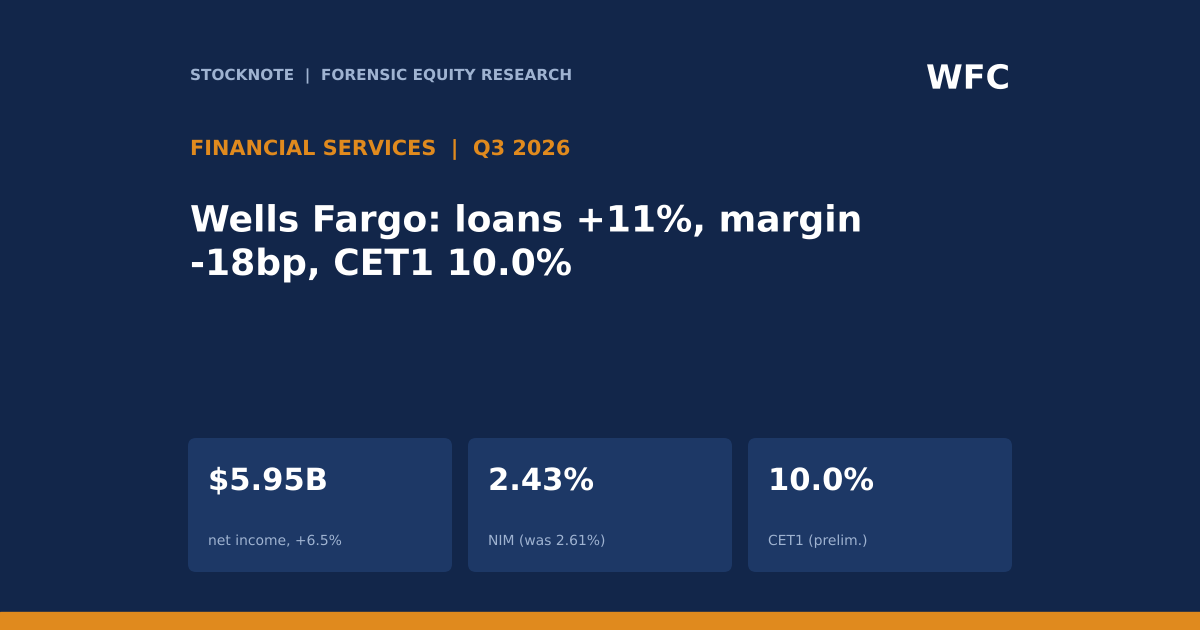
Wells Fargo earned $5,951 million in the third quarter of 2026, up 6.5% (d), and $1.87 a share, up 12.7% (d). Revenue rose only 2.0% (d) to $21,870 million, so the gain came from three places: lower expenses (down 0.7%), a lower tax rate (including $170 million of discrete benefits) and a lower share count. Average loans grew 11.3% (d) but net interest margin fell 18 basis points to 2.43%, so net interest income rose only 4.7% (d). The preliminary CET1 ratio was 10.0%, down from 11.0%, after $2.5 billion of buybacks. This extends Stocknote's comparison of the big banks to a fourth institution with a different mix.
- Income. Revenue $21,870M (+2.0%); net interest income $12,517M (+4.7%); noninterest income $9,353M (-1.4%); noninterest expense $13,743M (-0.7%); efficiency ratio 63% (65%).
- Credit. Provision for credit losses $1,029M (year-ago $681M); net loan charge-off rate 0.38% (0.40%).
- Returns. Net income $5,951M; EPS $1.87 ($1.66); ROE 13.8% (12.8%); ROTCE 16.3% (15.2%).
- Balance sheet. Average loans $1,033.4B ($928.7B); average deposits $1,482.9B ($1,339.9B); CET1 10.0% preliminary (11.0%).
- Capital. Repurchased 28.6 million shares for $2.5 billion.
- This article contains no rating, price target or investment advice. Derived figures are marked (d).
Bottom line. Wells Fargo is growing its balance sheet faster than its revenue and returning capital faster than it earns it. The extra volume brought less margin per dollar, so net interest income grew at less than half the rate of loans. Earnings per share is being helped more by cost, tax and share count than by revenue, which is a sound but finite way to grow EPS.
Source: Wells Fargo Q3 2026 8-K earnings release.
Q3 2026 At A Glance
| $ millions | Q3 2026 | Q3 2025 | Change (d) |
|---|---|---|---|
| Total revenue | 21,870 | 21,436 | +2.0% |
| Net interest income | 12,517 | 11,950 | +4.7% |
| Noninterest income | 9,353 | 9,486 | -1.4% |
| Noninterest expense | 13,743 | 13,846 | -0.7% |
| Provision for credit losses | 1,029 | 681 | +51% |
| Net income | 5,951 | 5,589 | +6.5% |
| Diluted EPS | $1.87 | $1.66 | +12.7% |
| ROTCE | 16.3% | 15.2% | +1.1 pts |
Source: Wells Fargo 8-K.
What The Market Believes vs. What The Data Actually Shows
| Belief | What the data show |
|---|---|
| Higher loan growth drives earnings | Average loans rose 11.3% (d) but net interest income only 4.7% (d), because the margin fell from 2.61% to 2.43%. |
| Revenue growth drives EPS growth | EPS rose 12.7% (d) on revenue growth of 2.0% (d); net income grew 6.5% (d). |
| Credit is benign | Charge-offs eased to 0.38%, but the provision rose 51% (d) to $1,029M, which is a reserve build. |
| Capital is ample | CET1 fell to 10.0% (preliminary) from 11.0% in a year while the bank bought back $2.5B of stock. |
| Fee income is the growth engine | Noninterest income fell 1.4% (d) to $9,353M. |
Forensic #1: Volume Versus Margin In Net Interest Income
| Measure | Q3 2026 | Q3 2025 | Change (d) |
|---|---|---|---|
| Average loans ($B) | 1033.4 | 928.7 | +11.3% |
| Average deposits ($B) | 1482.9 | 1339.9 | +10.7% |
| Net interest margin (taxable-equivalent) | 2.43% | 2.61% | -18 bp |
| Net interest income ($M) | 12,517 | 11,950 | +4.7% |
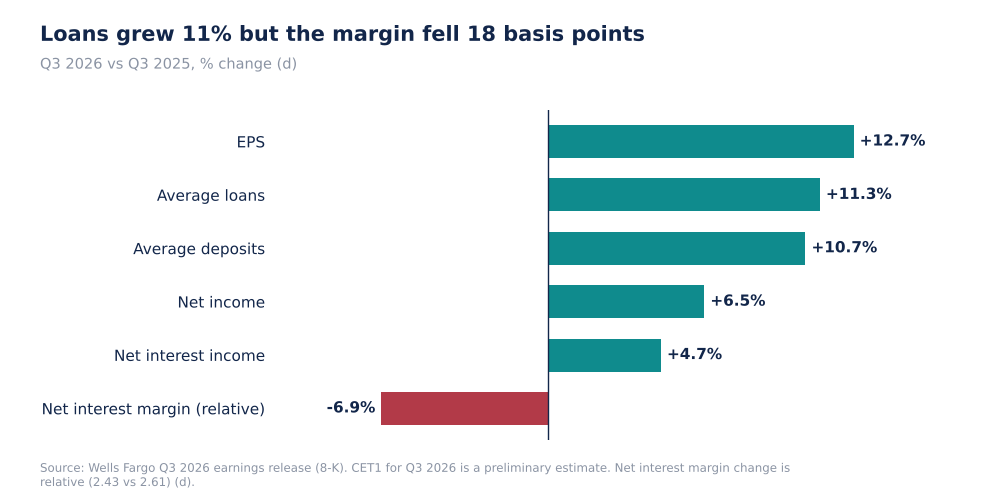
Wells Fargo Volume Versus Margin, Q3 2026 Vs Q3 2025 (Self-Made, d)
Net interest income is roughly average earning assets multiplied by net interest margin. Loans (one part of earning assets) rose 11.3% while the margin fell 6.9% in relative terms (d), which is why net interest income rose about 4.7% (d). The release does not give average earning assets, so this is an approximation using loans as a proxy. The mix matters: the bank is lending more against a deposit base that grew a little slower (10.7%), and the margin compression shows that the new loans earn less spread than the existing book.
Why it matters. A bank can grow balance sheet and still shrink the spread. Growth that lowers margin adds dollars of interest income but not at the previous rate of return on the extra assets.
Source: Wells Fargo 8-K. Changes are my arithmetic (d).
Forensic #2: What Drove EPS
| Driver | Q3 2026 | Q3 2025 | Change (d) |
|---|---|---|---|
| Revenue ($M) | 21,870 | 21,436 | +434 |
| Noninterest expense ($M) | 13,743 | 13,846 | -103 |
| Pre-provision profit ($M, d) | 8,127 | 7,590 | +537 (+7.1%) |
| Provision ($M) | 1,029 | 681 | +348 |
| Pre-tax income ($M, d) | 7,112 | 6,889 | +223 |
| Income tax ($M) | 1,161 | 1,300 | -139 |
| Implied tax rate (d) | 16.3% | 18.9% | -2.5 pts |
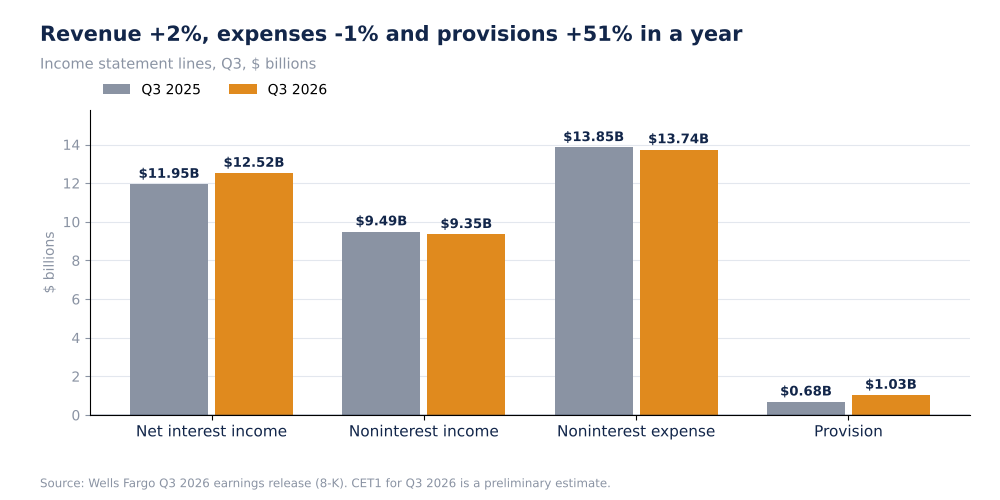
Wells Fargo Income Statement Lines, Q3 2025 Vs Q3 2026, $B (Self-Made, Company Data)
Pre-provision profit rose 7.1% (d) to $8,127M, a better rate than revenue because expenses fell. The provision then took back $348M (d). The tax charge fell $139M (d) even as pre-tax income rose, with a $170M discrete benefit in the third quarter of 2026 and an implied rate of 16.3% against 18.9% (d). EPS growth of 12.7% (d) exceeded net income growth of 6.5% (d), which implies the share count fell by about 5.5% (d), an approximation that ignores preferred dividends. Severance was lower than the $296M a year earlier, but the 2026 amount is not given.
Why it matters. About 3.2% (d) pre-tax growth became 6.5% net income growth and 12.7% EPS growth: each step down the income statement added growth through lower tax and fewer shares.
Source: Wells Fargo 8-K. Derived figures marked (d).
Forensic #3: Segments
| Net income, $M | Q3 2026 | Q3 2025 | Change (d) |
|---|---|---|---|
| Consumer Banking and Lending | 2,755 | 2,270 | +21% |
| Corporate and Investment Banking | 1,924 | 1,966 | -2% |
| Commercial Banking | 1,195 | 1,162 | +3% |
| Wealth and Investment Mgmt | 603 | 506 | +19% |
| Corporate | -526 | -315 | -211 |
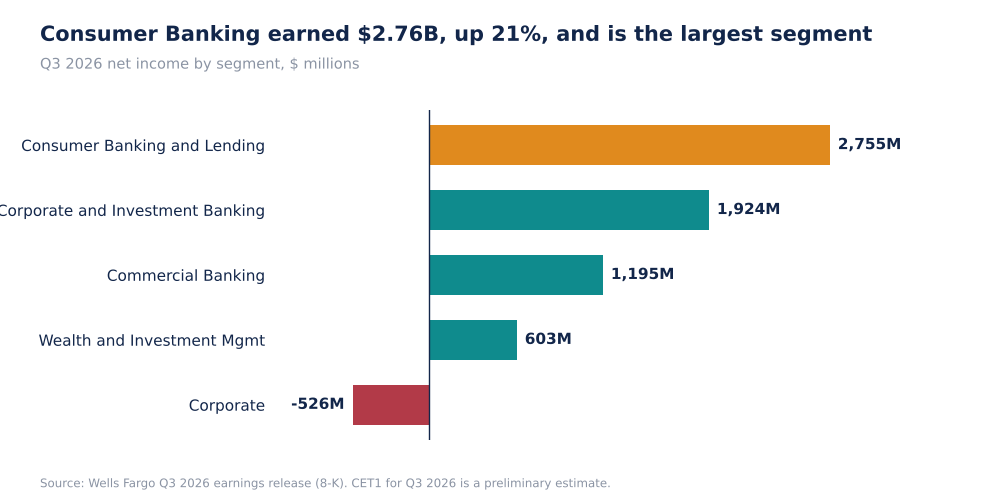
Wells Fargo Net Income By Segment, Q3 2026, $M (Self-Made, Company Data)
Consumer Banking and Lending supplied the most net income ($2,755M) and grew 21% (d); Wealth and Investment Management grew 19% (d). Corporate and Investment Banking fell 2% (d). The Corporate line was a $526M loss against $315M, $211M (d) worse, which absorbs part of the segment gains. Segment net incomes sum to $5,951M (d), matching consolidated net income.
Why it matters. Compared with Goldman Sachs and JPMorgan in Stocknote's bank article, Wells Fargo's profit comes mostly from consumer lending and not from trading, so it is the most sensitive of the group to the interest margin and credit costs.
Source: Wells Fargo 8-K. Changes are my arithmetic (d).
Forensic #4: Capital Return And Credit
| Item | Q3 2026 | Q3 2025 |
|---|---|---|
| CET1 ratio (standardized) | 10.0% (preliminary) | 11.0% |
| Buybacks | $2.5B (28.6M shares) | n/a |
| Average price paid (d) | about $87 a share | n/a |
| Provision for credit losses | $1,029M | $681M |
| Net loan charge-off rate | 0.38% | 0.40% |
| Net charge-offs (income statement) | $983M | $954M |
| Provision less net charge-offs (d) | +$46M | -$273M (d) |
The provision exceeded net charge-offs by $46M (d) in Q3 2026 and fell short of them by $273M (d) a year ago, a swing of about $319M (d) from reserve release to reserve build. That is the opposite of the signal in the 0.38% charge-off rate. The release shows net charge-offs of $983M on the income statement and $983M versus $942M in the credit table for the two periods, so the prior-year base differs slightly by table. At about $87 a share (d), the $2.5B buyback retired about 28.6 million shares.
Why it matters. A falling CET1 ratio with a reserve build is not alarming by itself but shows management is returning capital while preparing for higher losses. The regulatory requirement is not in my extract.
Source: Wells Fargo 8-K. Derived figures marked (d).
Valuation Snapshot
I have no Wells Fargo share price in my sources, so no multiples are calculated except the average buyback price of about $87 (d) for the quarter.
| Measure | Value |
|---|---|
| ROTCE | 16.3% |
| ROE | 13.8% |
| Efficiency ratio | 63% |
| CET1 (preliminary) | 10.0% |
What has to be true. For earnings to keep growing faster than revenue the bank needs further cost reductions or buybacks; for revenue to grow faster it needs a stable margin on loan growth.
Risks: What Would Break The Thesis
- Margin. A further decline in net interest margin would offset loan growth.
- Credit. The provision is rising.
- Capital. CET1 is a preliminary estimate and has fallen 1.0 point.
- Tax. $170M of discrete benefits will not repeat.
- Missing data. No average earning assets, dividends or requirement levels.
The reading would be wrong if the margin stabilises as deposit costs fall, or if CET1 is revised up in the final filing.
What To Watch Next
- Net interest margin against 2.43%.
- The provision against $1,029M and charge-offs against 0.38%.
- Final CET1 ratio against 10.0%.
- Noninterest income against $9,353M.
- Loan growth against 11.3% (average).
- Efficiency ratio against 63%.

Sandeep Gupta
Independent equity research analyst publishing forensic theses on US-listed stocks. MBA, Politecnico di Milano School of Management (Milan, Italy).
Get new research in your inbox
Subscribe to receive forensic equity research the moment it's published. Free, no spam.
Related Research
Latest earnings releases: WFC
— Wells Fargo Reports Third Quarter 2026 Net Income of $6.0 billion, or $1.87 per Diluted Share
Discussion
Be the first to comment.