
Investment Thesis
Visa's fiscal fourth quarter (ended September 30, 2026) produced net revenue of $12,139 million, up 13%, and full-year net revenue of $45,903 million, up 15%. Payments volume rose 9%, cross-border volume 14% and processed transactions 10% to 74.2 billion. The income statement is unusual, because Visa reports revenue gross of the payments it makes to banks and merchants to win and keep business ("client incentives") and then subtracts them. In the fourth quarter gross revenue was $17,262 million (d) and incentives were $5,123 million, or 29.7% (d). That share is the economic cost of competing for volume, and it is growing faster than revenue.
- Revenue. Q4 net $12,139M (+13%); full year $45,903M (+15%).
- Earnings per share. Q4 GAAP $3.19, non-GAAP $3.48; full year GAAP $12.32, non-GAAP $13.27.
- Costs. Full-year operating expenses GAAP $17,793M; non-GAAP $14,919M (+16%). Litigation provision $474M in Q4, $1,764M for the year.
- Cash. Operating cash flow $23,728M; capex $1,671M; free cash flow about $22,057M (d).
- Capital return. $20.5B of buybacks (61M shares at $335.49) and $25.6B of buybacks plus dividends; quarterly dividend raised 16% to $0.78. BioCatch acquired for $2.4B.
- This article contains no rating, price target or investment advice. Derived figures are marked (d).
Bottom line. Visa is a high-margin toll on payments volume: full-year non-GAAP operating margin of 67.5% (d). The investment question is the cost of volume. Incentives grew 21% in the quarter against about 15% (d) for gross revenue, so the share kept by Visa fell, from about 71.7% to 70.3% of gross (d). At the margin Visa is paying more to keep each dollar of volume.
Source: Visa fiscal Q4 2026 earnings release.
Fiscal Q4 2026 At A Glance
| $ millions | Q4 FY2026 | Growth | Full year FY2026 |
|---|---|---|---|
| Service revenue | 5,255 | +14% | 19,918 |
| Data processing revenue | 6,245 | +16% | 23,374 |
| International transaction revenue | 4,115 | +8% | 15,251 |
| Other revenue | 1,647 | +40% | 5,677 |
| Client incentives | -5,123 | +21% | -18,317 (+16%) |
| Net revenue | 12,139 | +13% | 45,903 (+15%) |
| Gross revenue (d) | 17,262 | 64,220 |
Source: Visa. Gross revenue is the sum of the four revenue types before incentives (d).
What The Market Believes vs. What The Data Actually Shows
| Belief | What the data show |
|---|---|
| Visa's revenue growth tracks cross-border volume | Cross-border volume grew 14% but international transaction revenue grew only 8%. |
| Net revenue growth shows pricing power | Net revenue grew 13% but incentives grew 21%; before incentives gross revenue grew about 15% (d). |
| Reported earnings reflect the operating business | Full-year GAAP operating expenses ($17,793M) were $2,874M (d) above non-GAAP ($14,919M); litigation provisions were $1,764M of the gap. |
| Buybacks are funded from growth | FY returns of $25.6B were 116% (d) of free cash flow of about $22.1B. |
| Other revenue is small | Other revenue grew 40% to $1,647M in Q4, now 10% of gross revenue (d). |
Forensic #1: Gross Revenue, Incentives And Net Revenue
| $ millions | Q4 FY2026 | FY2026 |
|---|---|---|
| Gross revenue (d) | 17,262 | 64,220 |
| Client incentives | -5,123 | -18,317 |
| Net revenue | 12,139 | 45,903 |
| Incentives / gross (d) | 29.7% | 28.5% |
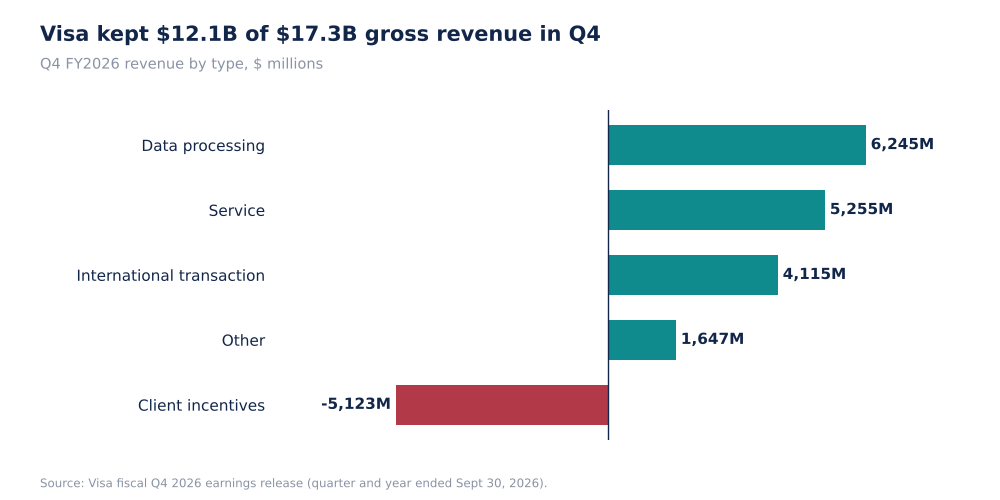
Visa Q4 FY2026 Revenue By Type, $M (Self-Made, Visa Data)
The four revenue types sum to $17,262 million (d) in the quarter and $64,220 million (d) in the year, and net revenue ties exactly to the release after subtracting incentives ($12,139 million and $45,903 million). Incentives take 29.7% of gross in the quarter against 28.5% (d) for the year, so the quarter is above the annual average.
Why it matters. Incentives are paid to clients to secure volume and are the cost of a competitive position. They are not discretionary in the way marketing is, because the clients can move volume. A rising ratio is a sign of bargaining power shifting toward banks and large merchants, or of Visa buying growth, and the release extract does not say which.
Source: Visa. Sums and ratios are my arithmetic (d).
Forensic #2: Growth By Line
| Q4 FY2026 growth | Rate | Comment |
|---|---|---|
| Other revenue | +40% | Smallest line; fastest growth |
| Client incentives | +21% | A cost; faster than net revenue |
| Data processing | +16% | Largest line |
| Service | +14% | Tracks payments volume (+9%) plus other effects |
| Net revenue | +13% | |
| International transaction | +8% | Cross-border volume was +14% |
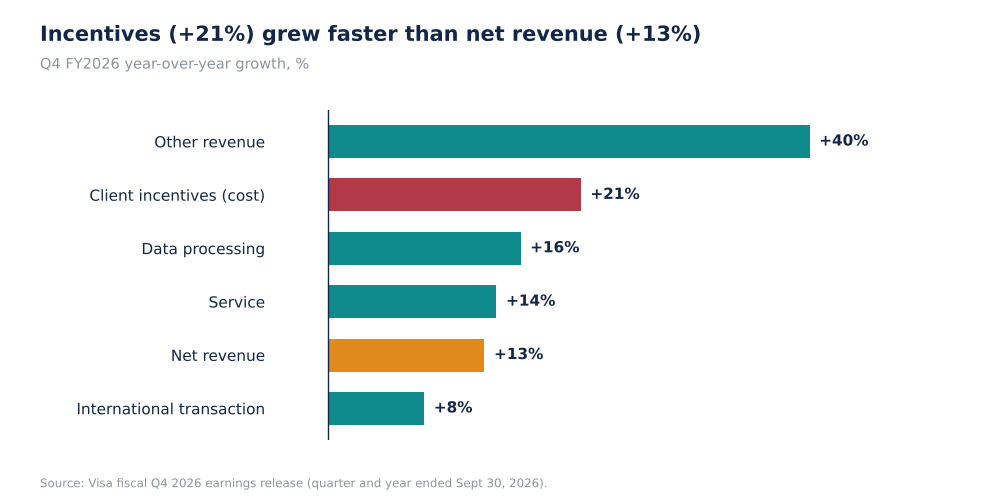
Visa Q4 FY2026 Year-Over-Year Growth By Line (Self-Made, Visa Data)
Payments volume grew 9% and processed transactions 10%, but service revenue grew 14% and data processing 16%, so those lines are growing faster than the volumes that drive them. Reversing the logic, international transaction revenue grew 8% while cross-border volume grew 14%; the extract does not explain the gap, which could reflect currency effects or mix, but I cannot say. Back-solving from the growth rates, gross revenue grew about 15% (d), approximately the same rate as the faster-growing lines, and incentives grew faster.
Why it matters. The line that is most tied to the cross-border consumer, international transaction revenue, is growing slowest. If the cross-border volume gain reflects lower-yielding flows, growth in volume will not carry through to revenue.
Source: Visa. Back-solved gross growth rests on rounded growth rates and is approximate (d).
Forensic #3: Margins And Quality Of Earnings
| FY2026 ($M) | GAAP | Non-GAAP |
|---|---|---|
| Net revenue | 45,903 | 45,903 |
| Operating expenses | 17,793 | 14,919 |
| Operating income (d) | 28,110 | 30,984 |
| Operating margin (d) | 61.2% | 67.5% |
| EPS | $12.32 | $13.27 |
| Q4 EPS | $3.19 | $3.48 |
GAAP operating expenses exceed non-GAAP by $2,874 million (d), of which the litigation provision for the year was $1,764 million. The extract does not itemise the remaining $1,110 million (d). Non-GAAP EPS is $0.95 (d) above GAAP for the year, 7.7% (d) higher. In the quarter the litigation provision was $474 million, which is 3.9% of net revenue (d).
Why it matters. The size of the litigation provisions ($1.8 billion in a year) shows that legal cost is a recurring item of Visa's business and not a one-off. Operating income computed from the stated figures assumes that net revenue less operating expenses is operating income (d).
Source: Visa. Margins are my arithmetic (d).
Forensic #4: Cash And Capital Return
| FY2026 | Amount |
|---|---|
| Operating cash flow | $23,728M |
| Capex | $1,671M |
| Free cash flow (d) | $22,057M |
| Buybacks | $20.5B (61M shares at $335.49) |
| Buybacks plus dividends | $25.6B |
| Dividends (d) | about $5.1B |
| Returns / free cash flow (d) | 116% |
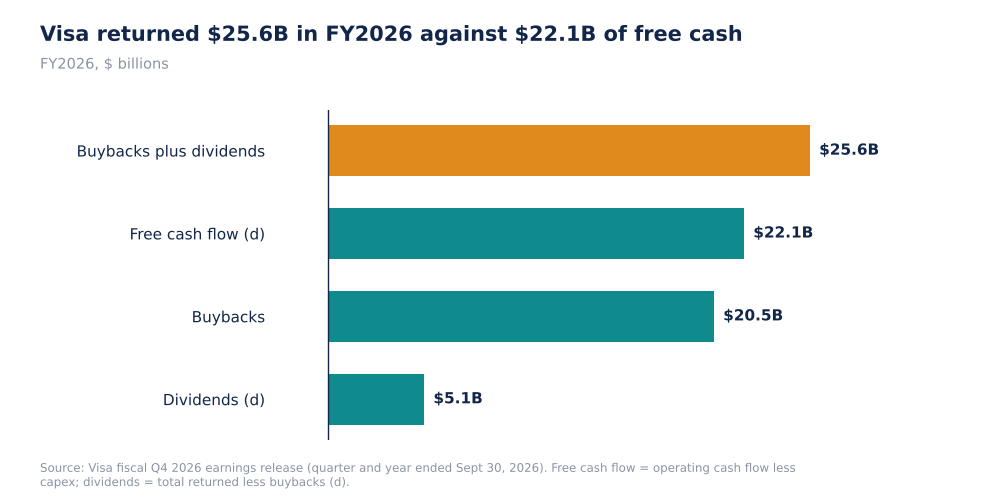
Visa FY2026 Capital Return Vs Free Cash Flow, $B (Self-Made, d)
Visa returned about 116% of free cash flow (d), so the excess of about $3.5 billion (d) was funded from cash on hand or debt, neither of which is shown in my extract. Capex of $1,671 million is only 7% of operating cash flow (d), which is why free cash flow is close to operating cash flow. The $2.4 billion BioCatch acquisition is outside the returns figure.
Why it matters. A business that converts 48% of net revenue to free cash flow (d) can support large buybacks, but returning more than 100% of free cash flow cannot continue indefinitely without drawing down the balance sheet.
Source: Visa. Free cash flow and ratios are my arithmetic (d).
Valuation Snapshot
I have no current Visa share price in my sources. The buyback price of $335.49 is the average paid over the fiscal year. On that average price, FY non-GAAP EPS of $13.27 corresponds to 25.3x (d), a historical reference only and not a current multiple.
| Metric | FY2026 |
|---|---|
| Non-GAAP EPS | $13.27 |
| GAAP EPS | $12.32 |
| Average buyback price | $335.49 |
| Average price / non-GAAP EPS (d) | 25.3x |
| Free cash flow per net revenue dollar (d) | 48% |
What has to be true. For the buyback pace to continue, free cash flow has to remain near $22 billion while incentives do not absorb more of gross revenue.
Risks: What Would Break The Thesis
- Incentives. A further rise in the incentive ratio would reduce net revenue growth.
- Litigation. $1,764M of provisions in the year.
- Approximate back-solving. Prior-period gross revenue is calculated from rounded growth rates.
- Cross-border yield. Revenue growth is lagging volume growth.
- No price data. The average buyback price is not a current valuation.
The reading would be wrong if the incentive ratio fell next quarter or if the gap between cross-border volume and revenue closed.
What To Watch Next
- Fiscal Q1 2027 incentives as a share of gross revenue against 29.7%.
- International transaction revenue against cross-border volume (+8% against +14%).
- Litigation provisions after $1,764M.
- Returns against free cash flow.
- The effect of the BioCatch acquisition on other revenue.
- Payments volume growth against 9%.

Sandeep Gupta
Independent equity research analyst publishing forensic theses on US-listed stocks. MBA, Politecnico di Milano School of Management (Milan, Italy).
Get new research in your inbox
Subscribe to receive forensic equity research the moment it's published. Free, no spam.
Related Research

Latest earnings releases: V
— Visa Reports Fiscal Fourth Quarter and Full-Year 2026 Results
Discussion
Be the first to comment.