
Investment Thesis
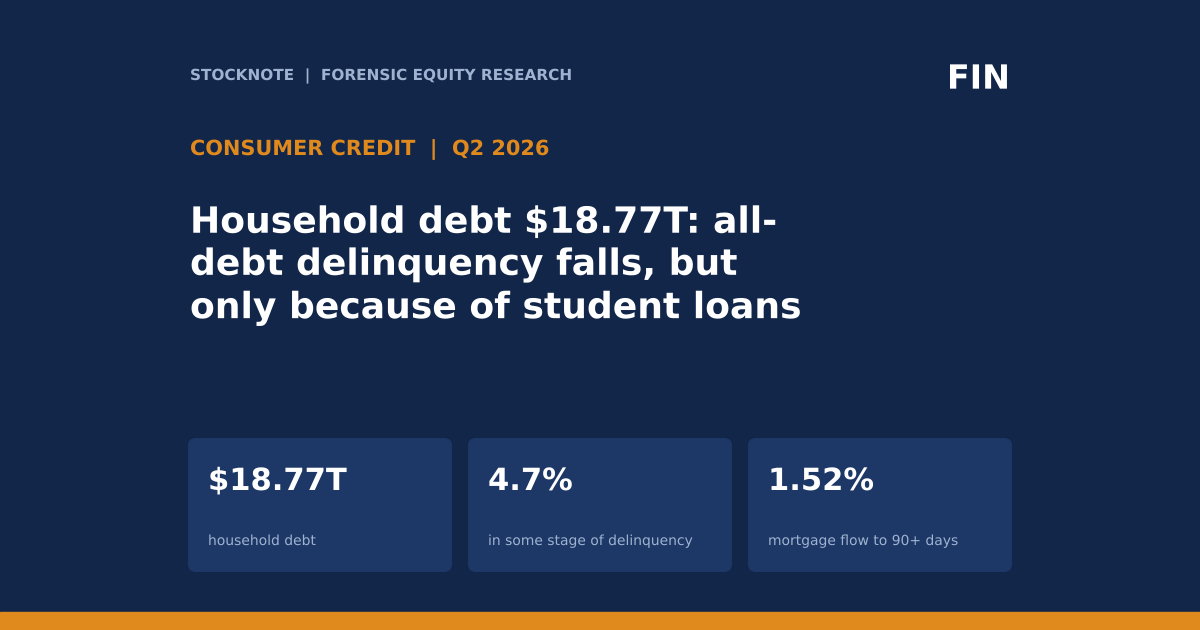
US household debt was $18.771 trillion at June 30, 2026, down $13 billion from March but up $383 billion (2.1%, d) from a year earlier, according to the New York Fed. The share of debt in some stage of delinquency was 4.7%. The headline measure of new serious delinquency, the flow into 90+ days past due, fell for all debt from 2.91% to 2.57% over the year. That improvement is real, but it comes from one category: student loans, where the flow fell from 12.88% to 7.83%. In mortgages the flow rose from 1.29% to 1.52%, and in auto and credit cards it was flat to slightly higher. This article shows how to read household credit data as flows and stocks, and why composition matters more than the aggregate.
- Balances. Total $18.771T; mortgage $13.117T, student loan $1.651T, auto $1.713T, credit card $1.263T, other $0.568T, HELOC $0.459T.
- Growth. Year over year +$383B: mortgage +$182B, HELOC +$48B, auto +$58B, credit card +$54B, student +$13B, other +$28B.
- Stress. Flow into serious delinquency: mortgage 1.52% (1.29% a year earlier), auto 3.00% (2.93%), credit card 6.97% (6.93%), HELOC 1.15% (unchanged), student 7.83% (12.88%), all debt 2.57% (2.91%).
- Credit supply. Mortgage originations $505B and auto originations $211B in Q2 2026; credit card limits rose $85B in Q1 and HELOC limits $19B.
- This article contains no rating, price target or investment advice. Every figure comes from a named source and anything I calculated is marked (d).
Bottom line. The household sector is not in a credit crisis on these data, since total debt is growing slowly and the flow into serious delinquency for all debt is below last year. But the favourable all-debt figure depends on student loans, which fell by 5.05 points (d) while mortgage flows rose 0.23 points (d). Excluding student loans, every product is flat or worse, and the mortgage deterioration is occurring with mortgage rates above 7% (Freddie Mac, 7.24% on October 29) and balances that fell $74B in the quarter. The Q3 report was not in the sources I read, so this is a June 30 snapshot.
Sources: New York Fed Household Debt and Credit Report, Q2 2026; JPMorgan Q3 2026 results; Trading Economics for Freddie Mac rates (see Stocknote's term-premium article).
Q2 2026 At A Glance
| Type | Balance | Change q/q | Change y/y | Share of total (d) | Y/Y growth (d) |
|---|---|---|---|---|---|
| Mortgage | $13.117T | -$74B | +$182B | 69.9% | +1.4% |
| HELOC | $0.459T | +$13B | +$48B | 2.4% | +11.7% |
| Auto loan | $1.713T | +$28B | +$58B | 9.1% | +3.5% |
| Credit card | $1.263T | +$21B | +$54B | 6.7% | +4.5% |
| Student loan | $1.651T | -$7B | +$13B | 8.8% | +0.8% |
| Other | $0.568T | +$6B | +$28B | 3.0% | +5.2% |
| Total | $18.771T | -$13B | +$383B | 100% | +2.1% |
Source: New York Fed, Q2 2026. Shares and percentage growth are my arithmetic (d).
What The Market Believes vs. What The Data Actually Shows
| Belief | What the data show |
|---|---|
| Consumer credit stress is easing | The all-debt flow into serious delinquency fell from 2.91% to 2.57%, but student loans account for it (12.88% to 7.83%); mortgage, auto and card flows rose or were flat. |
| Credit cards are the problem | Card flow was 6.97% (6.93% a year earlier), basically flat; the balance grew 4.5% (d). Card flow is high in level and stable in trend. |
| Mortgages are safe because owners have equity | The flow into serious delinquency rose to 1.52% from 1.29%, a 0.23 point increase (d), and the NY Fed says early delinquency transitions on mortgages and auto loans rose slightly. |
| Households are deleveraging | Total debt fell $13B in the quarter, but rose $383B (2.1%, d) over the year; HELOC balances rose $13B in the quarter and $48B in the year. |
The NY Fed page gives qualitative direction but not rates for early delinquency transitions: auto loans and mortgages rose slightly, credit cards and other debt were largely steady, and HELOCs improved slightly. I do not have the numbers.
Forensic #1: Where The Debt Is
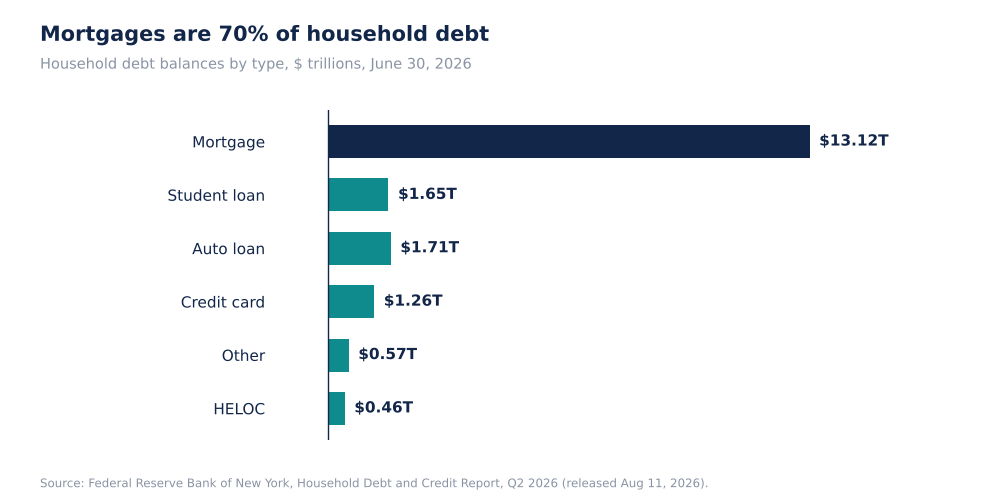
Household Debt By Type, $ Trillions, June 30, 2026 (Self-Made)
Mortgage debt is 69.9% of the total (d); the remaining $5.654 trillion (30.1%, d) is consumer credit. A concentration like this means that the aggregate is determined by mortgages, where the flow into serious delinquency (1.52%) is among the lowest rates in the table, so the all-debt average sits well below the consumer-credit rates (card 6.97%, student 7.83%, other 5.19%, auto 3.00%).
Why it matters. Different debt types carry different loss severities: a 1.52% flow in a $13.1T mortgage book involves collateral, while a 6.97% flow in a $1.26T card book is unsecured. Investors in banks, card issuers and mortgage companies are exposed to different parts of this table.
Source: New York Fed. Shares are my arithmetic (d).
Forensic #2: Flows Versus Stocks
| Type | Flow into serious delinquency, Q2 2025 | Q2 2026 | Change (pts, d) |
|---|---|---|---|
| Mortgage | 1.29% | 1.52% | +0.23 |
| HELOC | 1.15% | 1.15% | 0.00 |
| Auto loan | 2.93% | 3.00% | +0.07 |
| Credit card | 6.93% | 6.97% | +0.04 |
| Student loan | 12.88% | 7.83% | -5.05 |
| Other | 5.42% | 5.19% | -0.23 |
| All debt | 2.91% | 2.57% | -0.34 |
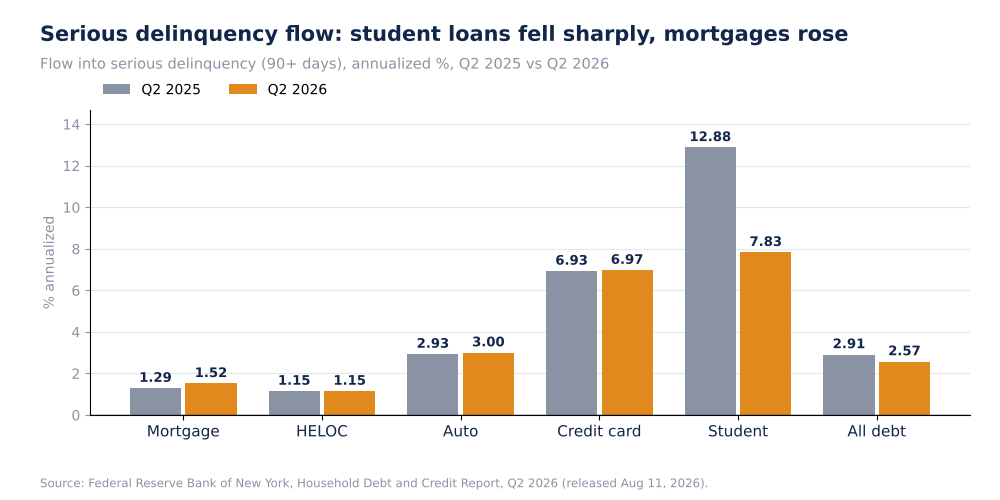
Flow Into Serious Delinquency, % Annualized (Self-Made, NY Fed Data)
A stock measure (4.7% of debt in some stage of delinquency) shows how much debt is troubled now. A flow measure (the annualized share that newly became 90+ days late in the quarter) shows the direction. The flow is the more sensitive to turns. The all-debt flow fell by 0.34 points (d) even though four of the six categories were flat or higher, because the student-loan flow fell by 5.05 points; the student-loan balance is only 8.8% of the total (d), but its flow rate is the highest in the table, so a change there moves the average. The NY Fed page does not give the cause of the student-loan improvement.
Why it matters. An aggregate that improves because of one product is an unreliable basis for a view on the consumer. A 0.23 point rise in the mortgage flow is small in absolute terms, but mortgages are 69.9% of the balance, and the NY Fed notes early transitions rose slightly too.
Source: New York Fed. Differences are my arithmetic (d).
Forensic #3: Where Balances Are Growing
| Type | Y/Y change | Y/Y growth (d) | Share of the year's increase (d) |
|---|---|---|---|
| Mortgage | +$182B | +1.4% | 47.5% |
| Auto loan | +$58B | +3.5% | 15.1% |
| Credit card | +$54B | +4.5% | 14.1% |
| HELOC | +$48B | +11.7% | 12.5% |
| Other | +$28B | +5.2% | 7.3% |
| Student loan | +$13B | +0.8% | 3.4% |
| Total | +$383B | +2.1% | 100% |
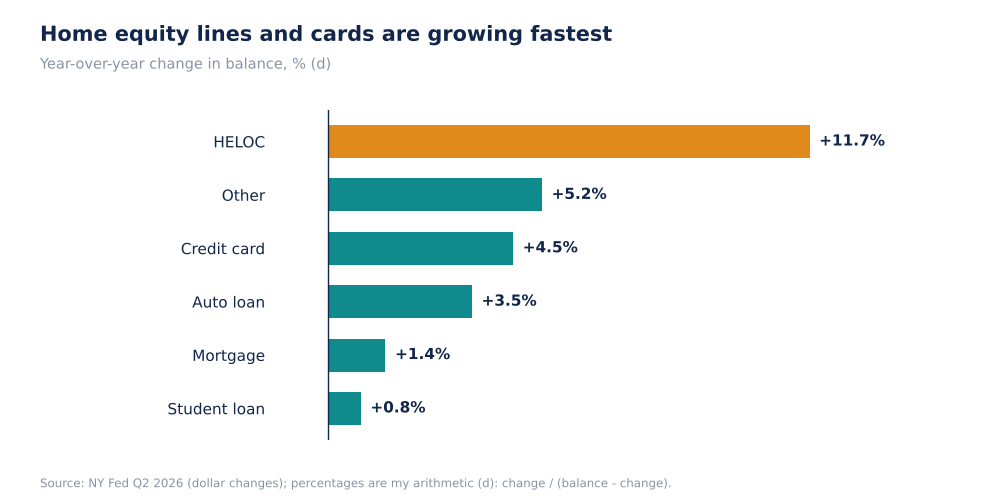
Year-Over-Year Balance Growth By Type, % (Self-Made, d)
HELOC balances grew 11.7% (d) in a year, the fastest of any category, while mortgage balances grew 1.4% (d). When a household borrows against home equity instead of refinancing, the usual explanation is that the existing first mortgage carries a rate lower than today's rates. The NY Fed extract does not say that, so I note it as an interpretation. Credit card limits rose $85B in Q1 and HELOC limits $19B, so households have been given more room to borrow.
Why it matters. HELOC growth of 11.7% and card growth of 4.5% against slow mortgage growth indicates that households are using second-lien and revolving credit more than first mortgages. These are the products that respond most quickly if borrowers come under strain.
Source: New York Fed. Percentages and shares are my arithmetic (d). The HELOC explanation is my interpretation.
Forensic #4: What A Large Bank Reports
| JPMorgan Card Services | Q3 2025 | Q2 2026 | Q3 2026 |
|---|---|---|---|
| Net charge-off rate | 3.15% | 3.34% | 2.91% |
| 2026 outlook | n/a | n/a | about 3.2% |
| Card Services loans (deck) | $234.4B | $243.5B | $250.1B |
JPMorgan's card charge-off rate in Q3 2026 was 2.91%, below the 3.15% a year earlier and the 3.34% in Q2, while its card loan book grew 6.7% year over year (d: 250.1 / 234.4 - 1). This does not conflict with the NY Fed's card flow of 6.97% because the measures differ: a charge-off rate counts loans written off (usually after longer delinquency), and the NY Fed's rate is the share moving into 90+ days past due, on a national basis. JPMorgan's full-year 2026 outlook of about 3.2% is above its Q3 figure; the deck extract does not give the first-quarter rate, so I cannot say what the outlook implies for the fourth quarter.
Why it matters. The best-capitalised lender is reporting improving card losses while the national flow is flat. For investors in lenders with weaker credit mixes, the NY Fed series is the better benchmark.
Sources: JPMorgan Q3 2026 earnings presentation; New York Fed. Growth is my arithmetic (d).
Valuation Snapshot
This is a sector and macro article and carries no single valuation. The credit variables to track are below.
| Measure | Latest |
|---|---|
| Total household debt | $18.771T |
| Debt in some stage of delinquency | 4.7% |
| Flow into serious delinquency, all debt | 2.57% (2.91% a year earlier) |
| Mortgage flow | 1.52% (1.29%) |
| Credit card flow | 6.97% (6.93%) |
| Freddie Mac 30-year rate, Oct 29 | 7.24% |
What has to be true. For household credit to remain benign, mortgage flows must stop rising despite mortgage rates above 7%, card flows must remain near 7% as balances grow 4.5% a year, and income growth must hold. Real wages fell about 0.7 points over twelve months (see Stocknote's GDP and jobs article), so the income support is thinner than in a normal expansion.
Risks: What Would Break The Thesis
- Old data. The report covers June 30, 2026; it predates the September rate hike and the rise in the 10-year yield to above 5%.
- Mortgage flow. Rose from 1.29% to 1.52% in a year.
- Composition. The all-debt improvement comes from student loans.
- Income. Hourly earnings lag CPI by 0.7 points (d).
- Unemployment. It rose to 4.2%; delinquency typically follows job losses, though the data here do not test that.
- Data limits. The NY Fed extract does not give early-delinquency rates, foreclosures, bankruptcies or the cause of the student-loan improvement.
The reassuring reading is that total debt is growing at 2.1% and the all-debt flow is falling. The cautious reading is that no category other than student loans is improving.
What To Watch Next
- The NY Fed's Q3 2026 report, for the first reading after the September hike.
- Mortgage flow against 1.52% and card flow against 6.97%.
- Student-loan flow after its fall from 12.88% to 7.83%.
- HELOC balances after +11.7%.
- Net charge-offs at card lenders against JPMorgan's 3.2% outlook.
- Unemployment and real earnings in the next jobs report.

Sandeep Gupta
Independent equity research analyst publishing forensic theses on US-listed stocks. MBA, Politecnico di Milano School of Management (Milan, Italy).
Get new research in your inbox
Subscribe to receive forensic equity research the moment it's published. Free, no spam.
Discussion
Be the first to comment.