
Investment Thesis
UPS reported third-quarter revenue of $22.9B, up 6.7%, but adjusted operating profit of $2,054M was down 3.7% and the adjusted operating margin fell to 9.0% from 10.0%. U.S. average daily volume fell 3.3% while revenue per piece rose 6.1%. Supply Chain Solutions revenue rose 18.2% while its adjusted profit fell from $536M to $274M. The company raised its full-year guidance, and the investor question is how much of Q4's expected jump is seasonal and how much is repair.
- Consolidated. Revenue $22.9B (+6.7%). Adjusted operating profit $2,054M against $2,132M, margin 9.0% against 10.0%. GAAP operating profit $1,744M against $1,804M, margin 7.6% against 8.4%.
- EPS. Adjusted diluted EPS $1.69 against $1.74 (-3%). GAAP diluted EPS $1.37 against $1.55 (-12%).
- U.S. Domestic. Revenue $14,865M (+4.5%), revenue per piece +6.1%, average daily volume 15.62M pieces against 16.15M (-3.3%). Adjusted profit $1,034M against $905M, margin 7.0% against 6.4%.
- International. Revenue $5,007M (+7.1%), revenue per piece +15.0%, adjusted profit $746M against $691M, margin 14.9%.
- Supply Chain Solutions. Revenue $2,981M (+18.2%), adjusted profit $274M against $536M, margin 9.2% against 21.3%. GAAP profit was $92M after a $182M goodwill and asset impairment.
- Cash, nine months. Operating cash flow $5,986M against $5,148M, capex $2,221M against $2,969M, free cash flow $4,220M against $2,744M.
- 2026 guide (raised). Revenue about $92.6B, adjusted operating profit about $8.75B, adjusted EPS about $7.28, free cash flow about $6.1B, dividends about $5.4B.
- This article contains no price target or rating. Every figure comes from the named source, and anything I calculated is marked (d).
Bottom line. UPS is running a deliberate strategy of taking less volume at higher prices in the U.S., and the U.S. segment shows it working, with profit up 14% on 3% fewer packages. That gain was cancelled in the quarter by Supply Chain Solutions, and the full-year guide needs a Q4 adjusted margin of about 12.8% (d) against 9.0% in Q3. Investors are paying for the dividend and the Q4 recovery together.
Source: UPS Q3 2026 earnings release, SEC Exhibit 99.1.
Q3 2026 At A Glance
| Metric (Q3 2026) | Result | Change |
|---|---|---|
| Revenue | $22.9B | +6.7% |
| Adjusted operating profit / margin | $2,054M / 9.0% | -3.7% (d) / from 10.0% |
| GAAP operating profit / margin | $1,744M / 7.6% | -3.3% (d) / from 8.4% |
| Adjusted diluted EPS | $1.69 | from $1.74 |
| GAAP diluted EPS | $1.37 | from $1.55 |
| U.S. average daily volume | 15,621K | -3.3% (d) |
| U.S. revenue per piece | n/a | +6.1% |
| U.S. adjusted cost per piece | $13.32 | +5.5% (d), from $12.63 |
| International revenue per piece | n/a | +15.0% |
| Supply Chain Solutions adjusted profit | $274M | from $536M |
Source: UPS Q3 2026 earnings release. Changes marked (d) are my arithmetic on stated figures.
What The Market Believes vs. What The Data Actually Shows
| Belief | What the release shows |
|---|---|
| Revenue growth of 6.7% means a healthy business | Adjusted operating profit fell 3.7% and the margin fell a full point. Revenue growth came from pricing and from lower-margin supply chain revenue. |
| Cutting volume is raising profit per package | In the U.S., yes: adjusted profit rose 14% on 3.3% fewer pieces, and margin rose 60 basis points. |
| Supply Chain Solutions is a growth engine | Revenue grew 18.2% but adjusted profit fell 49% and margin fell to 9.2%. |
| GAAP and adjusted earnings agree | GAAP operating profit is $310M lower than adjusted (d) in Q3, and $1,537M lower for nine months (d). |
| The guide is secure | It requires Q4 adjusted operating profit of about $3.3B, 61% above Q3 (d), on revenue of $25.7B. |
The usual framing is a turnaround in which UPS accepts lower volume to raise yield. The U.S. numbers support that framing, but they are a part of a consolidated result that fell, and the segment with the fastest revenue growth was the one that lost the most profit.
Forensic #1: The U.S. Network Is Earning More On Fewer Packages
| U.S. Domestic Package | Q3 2025 | Q3 2026 | Change |
|---|---|---|---|
| Revenue | $14,220M | $14,865M | +4.5% |
| Average daily volume | 16,150K | 15,621K | -3.3% (d) |
| Revenue per piece | n/a | n/a | +6.1% |
| Adjusted cost per piece | $12.63 | $13.32 | +5.5% (d) |
| Adjusted operating profit | $905M | $1,034M | +14.3% (d) |
| Adjusted operating margin | 6.4% | 7.0% | +60 bp |
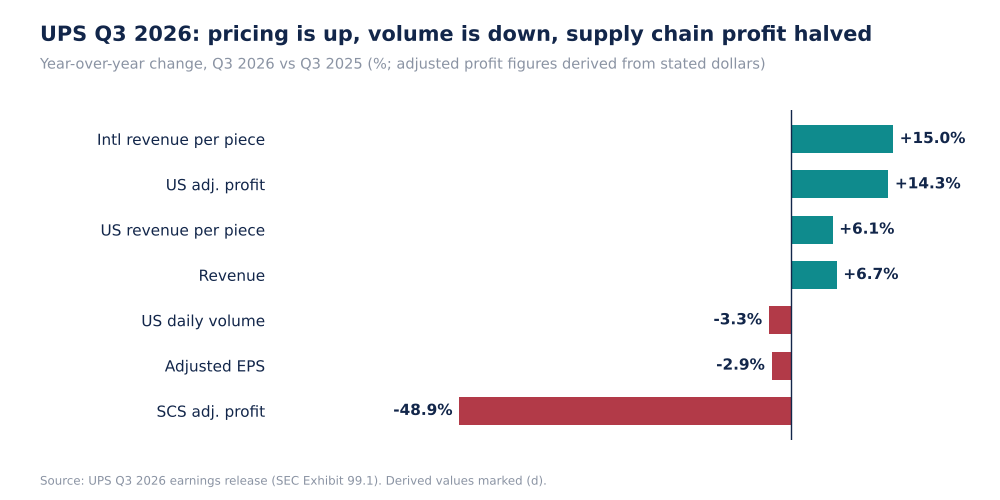
UPS Q3 2026 Year-Over-Year Changes (Self-Made)
Revenue per piece rose 6.1% against adjusted cost per piece up 5.5% (d), a spread of about 0.6 points, consistent with the 60 basis point margin gain. Multiplying the two stated drivers, volume and revenue per piece, gives revenue growth of about 2.6% (d), but reported revenue growth was 4.5%. The extra 1.9 points are not explained in the extract, and could reflect the number of operating days or revenue that is not tied to a piece, so I cannot attribute them.
Why it matters. A margin gain that comes from a 0.6-point spread between price and cost is thin: one point of cost inflation without pricing would remove it. The strategy works as long as customers accept higher prices on a smaller volume, and a 3.3% volume decline is the price paid for it.
Source: UPS Q3 2026 earnings release. The 2.6% growth cross-check multiplies stated volume and revenue per piece changes (d).
Forensic #2: Supply Chain Solutions Grew 18% And Lost Half Its Profit
| Supply Chain Solutions | Q3 2025 | Q3 2026 | Change |
|---|---|---|---|
| Revenue | $2,522M | $2,981M | +18.2% |
| Adjusted operating profit | $536M | $274M | -48.9% (d) |
| Adjusted operating margin | 21.3% | 9.2% | -12.1 pts (d) |
| GAAP operating profit | $525M | $92M | -82% (d) |
| Prior-year item | $330M sale-leaseback gain | n/a | n/a |
| Q3 2026 item | n/a | $182M goodwill and asset impairment | n/a |
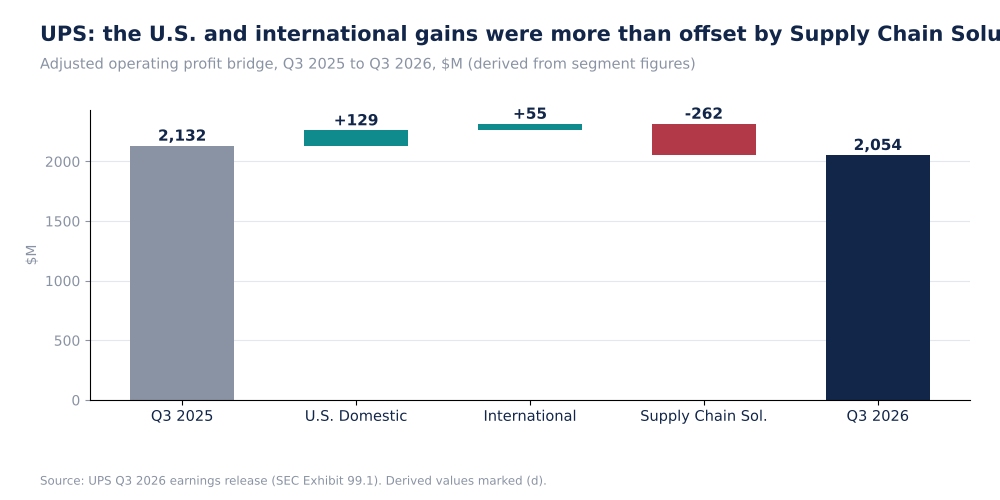
UPS Adjusted Operating Profit Bridge, $M (Self-Made)
The segment changes add exactly to the consolidated change: +$129M, +$55M and -$262M give -$78M (d), the difference between $2,132M and $2,054M. One question matters for reading this. The release says Q3 2025 included a $330M sale-leaseback gain in this segment, yet the prior-year adjusted profit of $536M is only $11M above the GAAP figure of $525M. Either the adjusted figure still contains the gain, in which case underlying prior-year profit was about $206M and Q3 2026's $274M is up about a third (d), or other add-backs of about $341M offset it. The extract does not show the reconciliation, so I cannot tell which is right.
Why it matters. The two readings give opposite conclusions about the segment: a 49% profit decline or a 33% profit increase. Revenue growth of 18% is the same in both. Investors should check the adjusted-to-GAAP reconciliation for Supply Chain Solutions before treating the 9.2% margin as a deterioration, and the impairment of $182M, which was recorded in the same segment, is a separate negative signal about acquired assets.
Source: UPS Q3 2026 earnings release. The alternative prior-year figure of about $206M is my arithmetic (d), shown only to frame the open question.
Forensic #3: The Gap Between Adjusted And GAAP Earnings
| Q3 2026 item (pre-tax) | Amount | Per share |
|---|---|---|
| Transformation strategy costs | $171M | $0.15 |
| Goodwill and asset impairment (Supply Chain Solutions) | $182M | $0.21 |
| Gain on sale of previously impaired aircraft parts | -$43M | -$0.04 |
| Net adjustment to operating profit (d) | $310M | n/a |
| Adjusted less GAAP operating profit, nine months (d) | $1,537M | n/a |
| 2026 transformation costs excluded from adjusted operating expense | $1.4B to $1.6B | n/a |
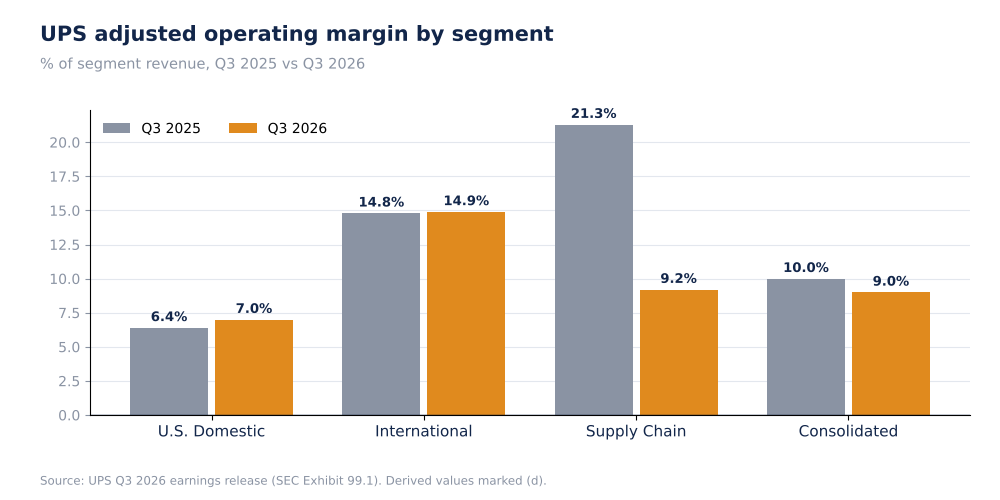
UPS Adjusted Operating Margin By Segment, Q3 2025 vs Q3 2026 (Self-Made)
The transformation costs excluded from adjusted results are expected to be $1.4B to $1.6B for the year, which equals about 16% to 18% of the adjusted operating profit guide (d). The nine-month GAAP operating profit of $3,941M is 28% below the adjusted $5,478M (d). GAAP EPS of $3.09 for nine months compares with adjusted EPS of $4.52.
Why it matters. When a company excludes a cost equal to 16% to 18% of adjusted profit for a full year, the exclusion deserves scrutiny, especially in a restructuring that runs over several years. Cash spent on transformation is real cash, and the guided free cash flow of about $6.1B has to absorb it. Investors should decide how much of this cost they treat as ongoing.
Source: UPS Q3 2026 earnings release. Net adjustment and percentage comparisons are derived.
Forensic #4: Free Cash Flow, The Dividend And The Q4 Step-Up
| Item | Figure |
|---|---|
| Nine-month operating cash flow | $5,986M (from $5,148M) |
| Nine-month capex | $2,221M (from $2,969M) |
| Nine-month free cash flow | $4,220M (from $2,744M), +54% (d) |
| 2026 free cash flow guide | about $6.1B |
| Implied Q4 free cash flow (d) | about $1.9B |
| 2026 dividends | about $5.4B, subject to board approval |
| Dividends / free cash flow guide (d) | about 89% |
| Q4 revenue / adjusted operating profit guide | about $25.7B / about $3.3B |
| Implied Q4 adjusted margin (d) | about 12.8% |
| Implied Q4 adjusted EPS (d) | about $2.76 ($7.28 less $4.52) |
Nine-month free cash flow rose by $1,476M, helped by operating cash flow up $838M and capex down $748M (d). About half of the improvement (d) is therefore lower investment, not higher earnings. The dividend of about $5.4B uses about 89% of the guided free cash flow (d), which leaves about $0.7B (d) after dividends. The Q4 guide of $3.3B of adjusted operating profit is 61% above Q3 (d), and the release extract does not give Q4 2025, so I cannot say how much of that is the normal seasonal peak.
Why it matters. The dividend is the main reason many investors own the stock, and it is covered by guided free cash flow but with little room, in a year when the free cash flow improvement came partly from spending less. If Q4 profit comes in lower than $3.3B, the cover shrinks quickly.
Source: UPS Q3 2026 earnings release. Implied Q4 figures are full-year guidance less nine-month actuals (d).
Valuation Snapshot
TradingView shows UPS at $108.25, up 0.86% on the day, with a market cap of $92.10B and a year-to-date gain of 9.01%. The page lists an all-time high of $233.72 from Feb 2022 and says "market closed".
| Measure | Figure |
|---|---|
| Share price (TradingView) | $108.25 |
| Market cap (TradingView) | $92.10B |
| Price vs all-time high (d) | about -54% |
| Price / 2026 adjusted EPS guide ($7.28) (d) | about 14.9 times |
| 2026 free cash flow guide of $6.1B / market cap (d) | about 6.6% |
| 2026 dividends of about $5.4B / market cap (d) | about 5.9% |
Both the dividend yield and the free cash flow yield are high, which reflects that the market is not paying for growth. The dividend figure is the planned total and is subject to board approval.
What has to be true. At about 15 times guided EPS and a 5.9% dividend yield, the price assumes the dividend is safe and Q4 delivers. For the shares to re-rate, the U.S. margin gain needs to continue, and Supply Chain Solutions needs to show profit that matches its revenue growth.
Risks: What Would Break The Thesis
- Q4 execution. The guide needs about $3.3B of adjusted operating profit, 61% above Q3.
- Volume. U.S. daily volume fell 3.3%, and a faster decline would cut the fixed-cost leverage.
- Supply Chain Solutions. A segment with rising revenue, a $182M impairment and a halved profit.
- Dividend cover. About 89% of guided free cash flow, with part of the cash flow gain from lower capex.
- Restructuring costs. $1.4B to $1.6B excluded from adjusted results this year.
- Data limits. The extract did not include the adjusted-to-GAAP reconciliation for segments, the Amazon volume detail or buybacks.
The risk to a positive view is less about demand than about whether cost reductions arrive fast enough to outrun wage and network cost inflation, which showed up in a 5.5% rise in adjusted cost per piece.
What To Watch Next
- Q4 adjusted operating profit against the $3.3B guide and margin against 12.8%.
- U.S. revenue per piece against adjusted cost per piece, where the spread was 0.6 points.
- Supply Chain Solutions adjusted profit and the reconciliation of the prior-year $330M gain.
- Free cash flow against the $6.1B guide, and dividend approval at about $5.4B.
- Transformation costs against the $1.4B to $1.6B range.
- U.S. average daily volume against the 3.3% decline.

Sandeep Gupta
Independent equity research analyst publishing forensic theses on US-listed stocks. MBA, Politecnico di Milano School of Management (Milan, Italy).
Get new research in your inbox
Subscribe to receive forensic equity research the moment it's published. Free, no spam.
Related Research
 HON
Honeywell (HON): Adjusted EPS Up 34%, GAAP EPS Down 20%, And Operating Cash Flow Down 74%
 GE
GE Aerospace (GE): Orders Up 49% And Adjusted EPS Up 36%, But Free Cash Flow Fell 14% And The Guide Implies A Softer Q4
 LMT
Discussion
Be the first to comment.