
Investment Thesis
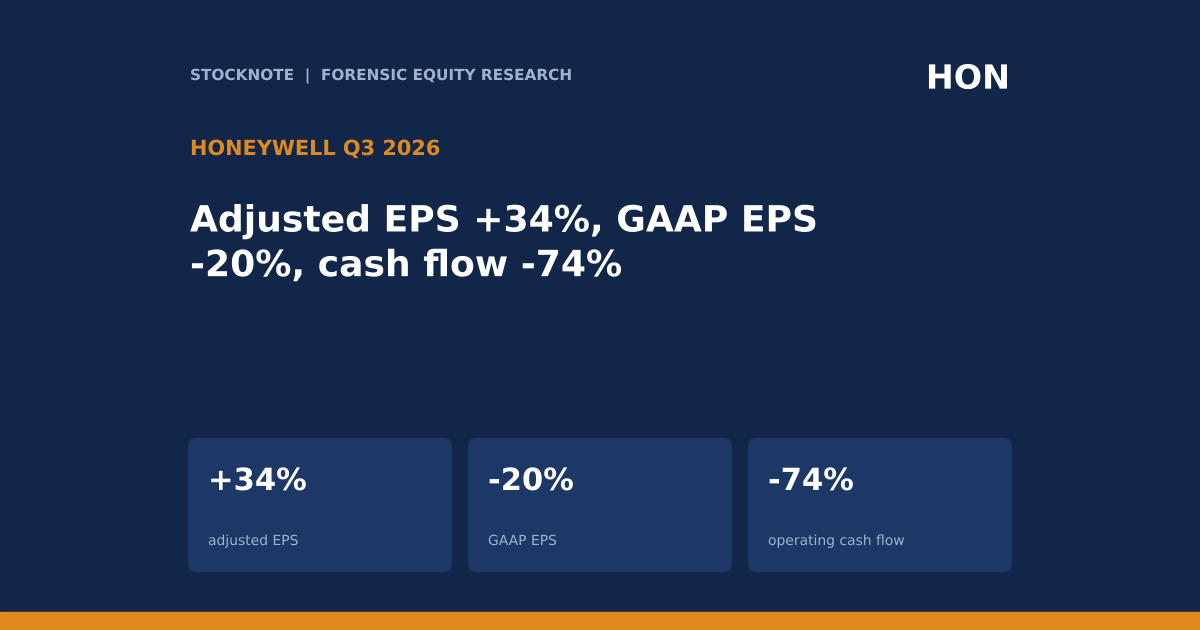
Honeywell reported third-quarter sales of $4,994M, up 7% organically but only about 1% as reported, and adjusted EPS of $2.27, up 34%. GAAP EPS from continuing operations was $2.40, down 20%, and operating cash flow from continuing operations fell 74% to $607M. Management raised the full-year adjusted EPS guide to $8.40 to $8.45. The figures show a company that has just been reshaped by a separation, and the investor task is to separate the underlying improvement from the effects of the reshaping.
- Sales. $4,994M against $4,929M (+1% reported, +7% organic). Backlog was nearly $19B, up 7%, excluding the WWS and PSS divestitures.
- Profit. Operating income $740M (+79%), margin 14.8% (+640 basis points). Segment profit $1,062M (+23%), margin 21.3% (+370 basis points).
- EPS. Adjusted $2.27 against $1.70 (+34%). GAAP continuing $2.40 against $2.99 (-20%), because Q3 2025 included an $802M Resideo gain worth $2.51 a share.
- Cash. Operating cash flow $607M against $2,306M. Free cash flow $688M against $599M (+15%), with a stated conversion of 95%.
- Segments. Building Automation $2,020M of sales at a 27.0% margin, Process Automation & Technology $1,859M at 22.2% (-210 bp), Industrial Automation $1,115M at 18.4% (+350 bp).
- Balance sheet. Cash $5,694M, long-term debt $10,386M (from $27,137M at Dec 31, 2025), total debt about $16.6B, equity $22,654M.
- 2026 guide (raised). Sales $20.0B to $20.1B, organic growth 4% to 5%, segment margin about 20.5%, adjusted EPS $8.40 to $8.45, free cash flow about $2.1B.
- This article contains no price target or rating. Every figure comes from the named source, and anything I calculated is marked (d).
Bottom line. The 34% adjusted EPS increase is real in the sense that it is organic and margin-led, but its composition matters. By my arithmetic about 71% of the $196M segment profit increase came from lower corporate costs, not from the three operating segments (d). Cash flow, which is what justifies an earnings multiple, fell sharply in the quarter and the free cash flow figure is higher than operating cash flow, which needs explaining.
Source: Honeywell Q3 2026 earnings release, SEC Exhibit 99.1.
Q3 2026 At A Glance
| Metric (Q3 2026) | Result | Change |
|---|---|---|
| Sales | $4,994M | +1% reported (d), +7% organic |
| Operating income | $740M | +79%; margin 14.8% |
| Segment profit | $1,062M | +23%; margin 21.3% |
| Adjusted EPS | $2.27 | +34% |
| GAAP EPS, continuing operations | $2.40 | -20% |
| Operating cash flow, continuing | $607M | -74% |
| Free cash flow | $688M | +15%; conversion 95% |
| Backlog | nearly $19B | +7% (excluding divestitures) |
| Cash / long-term debt | $5,694M / $10,386M | from $12,273M / $27,137M at Dec 31, 2025 |
Source: Honeywell Q3 2026 earnings release. The release describes the company as standalone since Q1 2026, following the separation of Honeywell Technologies and Honeywell Aerospace.
What The Market Believes vs. What The Data Actually Shows
| Belief | What the release shows |
|---|---|
| Earnings growth is broad across segments | Three segments together added only about $56M of profit (d); corporate and other improved by $140M, from -$241M to -$101M. |
| Cash flow supports the earnings | Operating cash flow fell 74% to $607M, and free cash flow of $688M is higher than operating cash flow. |
| GAAP and adjusted EPS tell the same story | Adjusted EPS rose 34% and GAAP EPS fell 20%, because Q3 2025 held an $802M gain and Q3 2026 holds a $216M after-tax gain on the PPE sale. |
| Sales growth is 7% | Reported sales rose about 1% (d); divestitures removed sales and the Johnson Matthey acquisition added some. |
| Guidance raise signals a stronger Q4 | The midpoint rose about $0.23, or 2.7% (d), and Q4 organic growth is guided to 5% to 6%, below Q3's 7%. |
The common summary is organic growth plus margin expansion after a separation. That is accurate, but a reader who stops there misses that the profit growth comes mainly from corporate cost reduction and from portfolio effects, which are not repeatable in the way that segment-level growth is.
Forensic #1: Corporate Costs Explain Most Of The Segment Profit Increase
| Item | Q3 2025 | Q3 2026 | Change |
|---|---|---|---|
| Building Automation profit | about $501M (d) | $546M | +9% |
| Process Automation & Technology profit | about $389M (d) | $412M | +6% |
| Industrial Automation profit | about $216M (d) | $205M | -5% |
| Three segments (d) | about $1,107M | $1,163M | about +$56M |
| Corporate and other | -$241M | -$101M | +$140M |
| Total segment profit | $866M | $1,062M | +$196M |
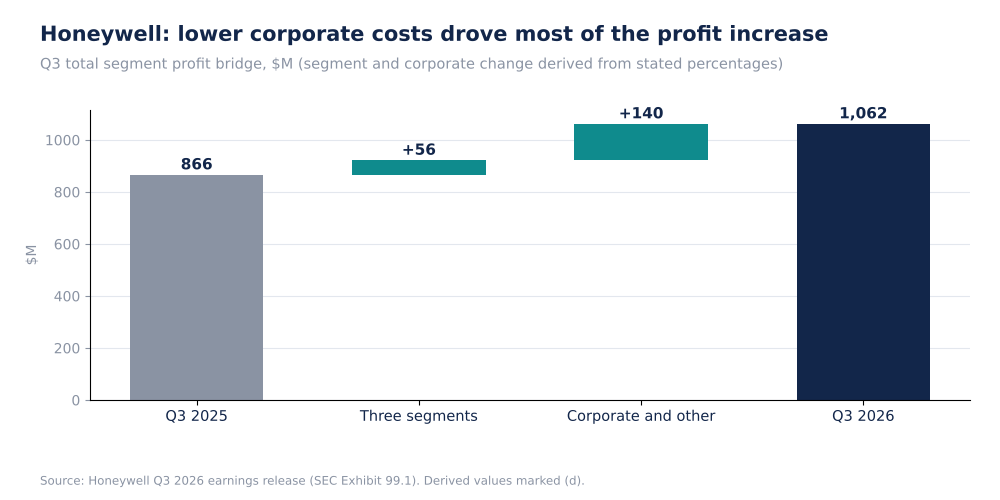
Honeywell Q3 Segment Profit Bridge, $M (Self-Made)
The prior-year segment values are backed out of the stated percentage changes and are approximate. The ranking is not: corporate and other accounts for about 71% of the increase (d, $140M of $196M). The release states that separation-related cost payments were $158M in Q3 against $2M a year ago, and the corporate line improved despite that higher spending, although the extract does not say whether separation payments sit inside that line.
Why it matters. Corporate cost savings are a one-time step down, not a growth rate. Once the corporate line stops improving, profit growth has to come from the segments, which grew profit by about 5% (d, $56M on $1,107M) in Q3, while organic sales grew 7%. A reader extrapolating the 23% segment profit growth is extrapolating a cost reduction.
Source: Honeywell Q3 2026 earnings release. Prior-year segment profit is derived from rounded growth rates.
Forensic #2: Segment Margins And Mix After The Portfolio Changes
| Segment | Q3 2026 sales | Organic growth | Profit | Margin | Margin change |
|---|---|---|---|---|---|
| Building Automation | $2,020M | +8% | $546M | 27.0% | +30 bp |
| Process Automation & Technology | $1,859M | +8% | $412M | 22.2% | -210 bp |
| Industrial Automation | $1,115M | +4% | $205M | 18.4% | +350 bp |
| Total (sales) | $4,994M | +7% | n/a | n/a | n/a |
Process Automation & Technology reported sales of $1,859M against $1,598M, up about 16% (d), on organic growth of 8%, so roughly half of its sales growth came from the Johnson Matthey Catalyst Technologies acquisition. The release says that acquisition diluted the margin, which fell 210 basis points to 22.2% while profit grew only 6%. Industrial Automation sales fell from $1,450M to $1,115M, about 23% lower (d), against organic growth of 4%, which means divestitures removed about 27 points of sales (d). Its margin rose 350 basis points on a smaller base.
Why it matters. The two largest segments by profit, Building Automation and Process Automation, are growing organically at 8% each, which is the clearest evidence of underlying health in the release. Building Automation's 27.0% margin is the highest in the group. The rise in Industrial Automation's margin is partly a result of shedding lower-margin sales, so it says more about the portfolio than about operating performance.
Source: Honeywell Q3 2026 earnings release. Acquisition and divestiture effects are derived from reported and organic growth.
Forensic #3: Cash Flow Fell 74%, And Free Cash Flow Is Higher Than Operating Cash Flow
| Item | Q3 2025 | Q3 2026 | Change |
|---|---|---|---|
| Operating cash flow, continuing operations | $2,306M | $607M | -74% |
| Free cash flow | $599M | $688M | +15% |
| Free cash flow less operating cash flow (d) | -$1,707M | +$81M | n/a |
| Free cash flow conversion | n/a | 95% | n/a |
| Separation-related cost payments | $2M | $158M | n/a |
| Spin-off cash outflow | n/a | $1,000M | nine-month also $1,000M |
Free cash flow is usually operating cash flow less capital spending, so it should be lower than operating cash flow. In Q3 it is $81M higher (d), which means the release's free cash flow definition adds back items such as separation-related payments or other adjustments. The part of the release I extracted does not show the reconciliation, and the prior-year free cash flow of $599M is far below the prior-year operating cash flow of $2,306M, so the two measures behave very differently between the years. The 95% conversion implies adjusted net income of about $724M (d), which is consistent with $2.27 a share on about 319M shares.
Why it matters. The adjusted free cash flow measure is the one the company guides: about $2.1B for the year. An investor should read the reconciliation in the release to see which cash costs are being excluded, since $158M of separation payments in one quarter is about 23% of the quarter's free cash flow (d), and the company expects about $0.5B for the year.
Source: Honeywell Q3 2026 earnings release. The conversion-implied net income is my arithmetic.
Forensic #4: A Smaller Balance Sheet, And What The Guide Implies For Q4
| Item | Figure |
|---|---|
| Cash and equivalents, Sep 30, 2026 | $5,694M (from $12,273M at Dec 31, 2025) |
| Short-term investments | $492M |
| Commercial paper and short-term borrowings | $2,424M |
| Current maturities of long-term debt | $3,783M |
| Long-term debt | $10,386M (from $27,137M) |
| Total debt (d) | about $16,593M |
| Net debt after cash and short-term investments (d) | about $10,407M |
| Shareowners' equity | $22,654M |
| Nine-month net sales | $15,004M (against $14,703M) |
| Implied Q4 sales (d) | about $5.0B to $5.1B ($20.0B to $20.1B less $15.0B) |
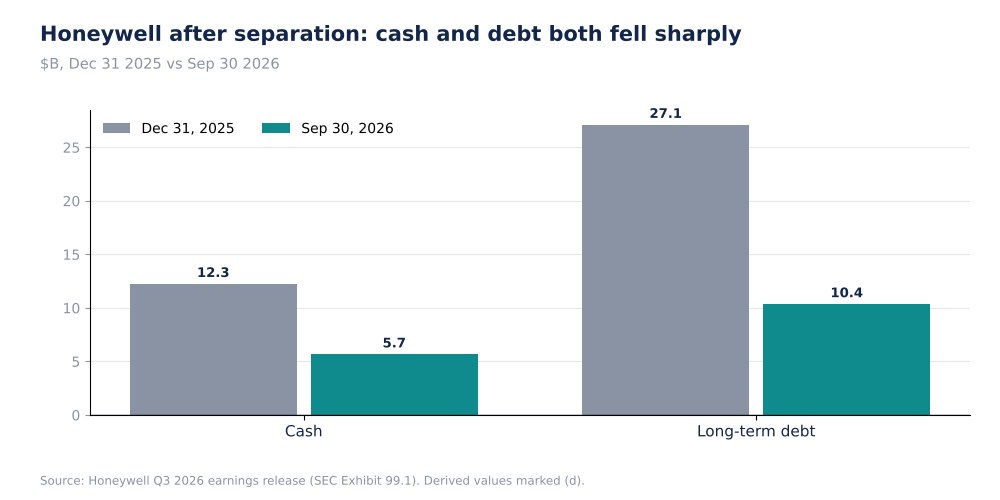
Honeywell Cash And Long-Term Debt, Dec 31 2025 vs Sep 30 2026, $B (Self-Made)
Long-term debt fell about $16.8B (d) and cash about $6.6B (d), which is the arithmetic of the separation, since the release shows $15,835M of pre-separation funding inflow in the nine months and a $1,000M spin-off outflow. Net debt of about $10.4B (d) is about 15% of the market cap shown on TradingView. The full-year guide implies Q4 sales of about $5.0B to $5.1B (d), flat to 2% above Q3, and implies a Q4 segment margin of about 22% (d, from the 20.5% full-year guide), up from 19.3% in the first half (d) and 21.3% in Q3.
Why it matters. The balance sheet is no longer the main issue, and the margin path is. A first-half segment margin of about 19.3% rising to 21.3% in Q3 and an implied 22% in Q4 is a steep climb for a business guiding to 5% to 6% organic growth, and the corporate cost savings account for part of it. The nine-month segment margin was about 19.9% against 17.4% a year earlier (d, +250 basis points), so a full-year gain of about 290 basis points requires Q4 to improve by more than the nine-month average.
Source: Honeywell Q3 2026 earnings release. Implied Q4 and first-half figures are derived from the nine-month and guidance figures.
Valuation Snapshot
TradingView shows Honeywell at $218.31, up 1.67% on the day, with a market cap of $69.19B and a year-to-date gain of 6.43%. The all-time high shown is $260.15 on Mar 2, 2026. The page says "market closed".
| Measure | Figure |
|---|---|
| Share price (TradingView) | $218.31 |
| Market cap (TradingView) | $69.19B |
| Price vs all-time high (d) | about -16% |
| Price / 2026 adjusted EPS guide midpoint ($8.425) (d) | about 25.9 times |
| Price / annualised Q3 adjusted EPS ($2.27 x 4) (d) | about 24.0 times |
| 2026 free cash flow guide of about $2.1B / market cap (d) | about 3.0% |
| Net debt / market cap (d) | about 15% |
The annualised Q3 multiple is lower than the full-year guide multiple because Q3 adjusted EPS of $2.27, when multiplied by four, is $9.08, above the $8.40 to $8.45 full-year guide. The nine-month adjusted EPS was not in the extract, so I cannot say how much Q4 is expected to give back.
What has to be true. At about 26 times guided EPS and a 3% free cash flow yield, the price assumes the margin gains are durable and that the cash conversion shown in the 95% figure holds. The segments need to carry growth after the corporate cost step-down is complete, and organic growth in the segments needs to stay in the high single digits.
Risks: What Would Break The Thesis
- Corporate cost savings are one-time. About 71% of the segment profit increase came from this line.
- Cash conversion. Operating cash flow fell 74%, and the free cash flow definition appears to add back items.
- Margin dilution. The acquisition cut Process Automation margin by 210 basis points.
- Back-end loaded guide. The implied Q4 segment margin of about 22% is above any quarter reported so far this year.
- Earnings comparability. GAAP and adjusted EPS moved in opposite directions because of gains on both sides of the comparison.
- Data limits. I did not read the cash flow reconciliation or the segment notes.
None of these is a reason to doubt the organic growth, which is clear in two segments at 8%. They are reasons to doubt that the 34% adjusted EPS growth rate is a guide to next year.
What To Watch Next
- Segment profit growth excluding corporate and other, against the 5% in Q3.
- The free cash flow reconciliation and separation-related payments, against the $0.5B for the year.
- Q4 organic growth against the 5% to 6% guide, and segment margin against the implied 22%.
- Process Automation & Technology margin as the acquisition is integrated.
- Backlog growth of 7%, excluding divestitures, as a leading indicator.
- Net debt of about $10.4B and any change in capital allocation.

Sandeep Gupta
Independent equity research analyst publishing forensic theses on US-listed stocks. MBA, Politecnico di Milano School of Management (Milan, Italy).
Get new research in your inbox
Subscribe to receive forensic equity research the moment it's published. Free, no spam.
Related Research
 GE
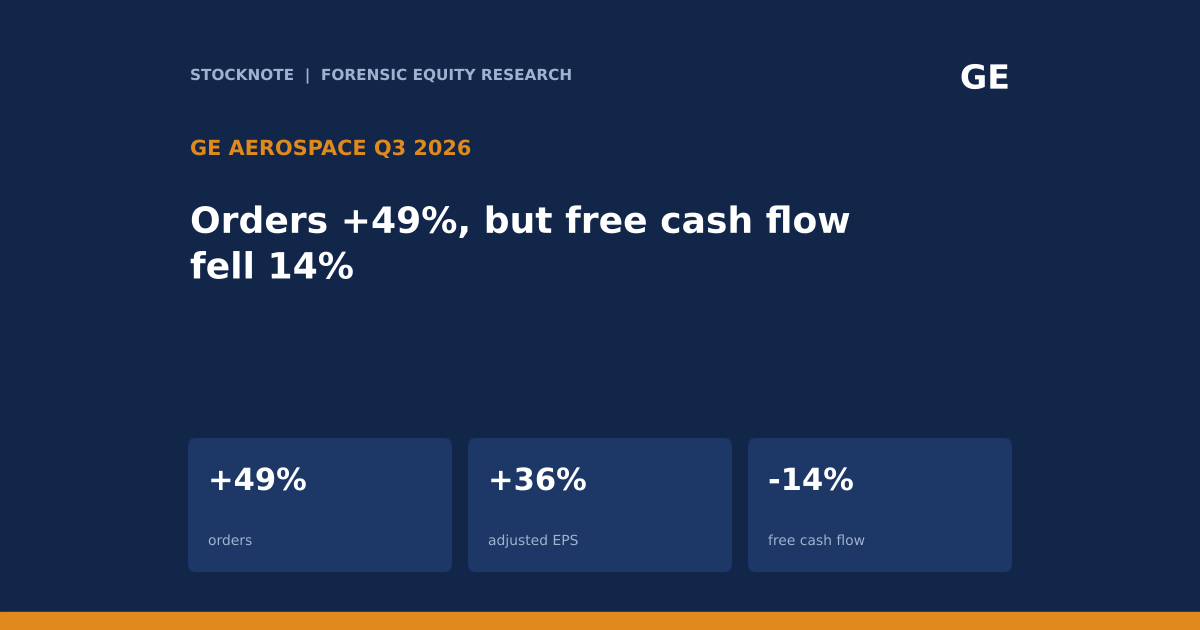
GE Aerospace (GE): Orders Up 49% And Adjusted EPS Up 36%, But Free Cash Flow Fell 14% And The Guide Implies A Softer Q4
 LMT
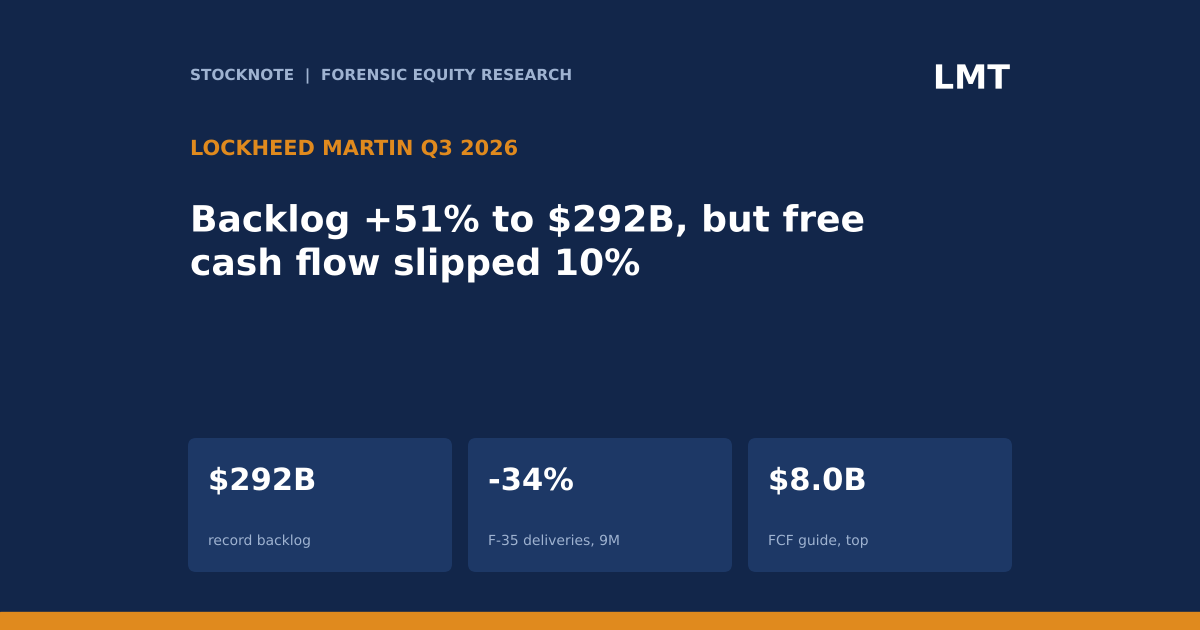
Lockheed Martin (LMT): Backlog Up 51% To $292B On A Missile Award, But F-35 Deliveries Fell And Free Cash Flow Slipped 10%
 UPS
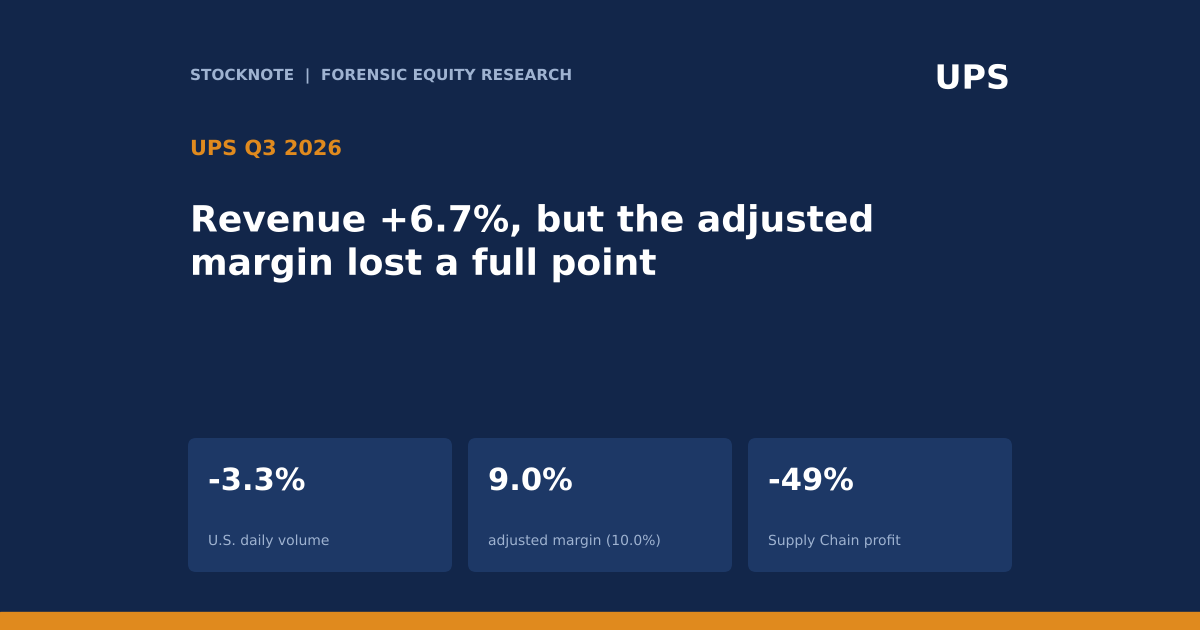
UPS: Revenue Up 6.7%, But The Adjusted Margin Fell A Full Point And U.S. Volume Dropped 3.3%
Latest earnings releases: HON
— HONEYWELL TECHNOLOGIES REPORTS THIRD QUARTER RESULTS, RAISES FULL-YEAR 2026 OUTLOOK
Discussion
Be the first to comment.