
Investment Thesis
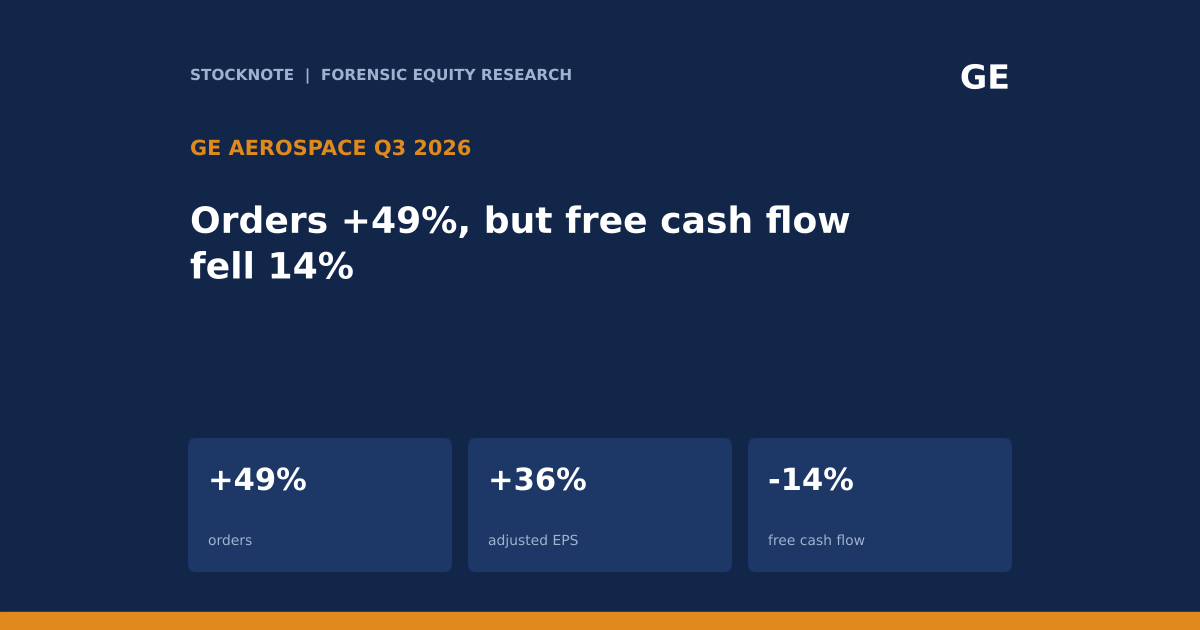
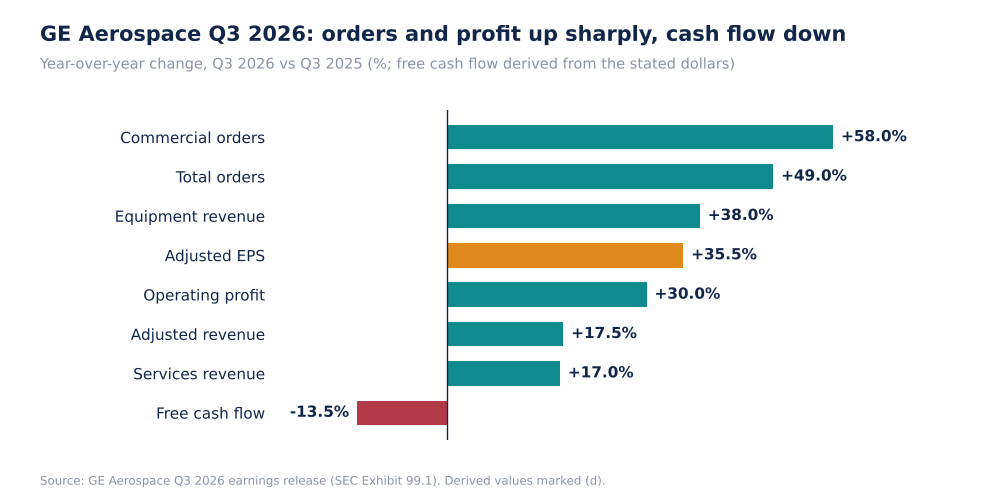
GE Aerospace reported third-quarter orders of $19.0B, up 49%, adjusted revenue of $13,285M, up 18%, operating profit of $2,988M, up 30%, and adjusted EPS of $2.25, up 36%. Free cash flow fell 14% to $2,042M. Management raised its 2026 guidance on every measure, but the raised ranges imply a Q4 operating profit and EPS below Q3. The investor question is whether the guide is conservative or whether Q3 was the peak.
- Orders. $19.0B (+49%). Commercial Engines & Services orders $15,265M (+58%), Defense & Propulsion Technologies orders $4,269M (+18%).
- Revenue. Total revenue $14,118M (+16%), adjusted revenue $13,285M (+18%). Commercial Engines & Services revenue $10,342M (+21%), Defense & Propulsion $3,469M (+7%).
- Profit. Operating profit (non-GAAP) $2,988M, margin 22.5% (+220 bp). GAAP profit $2,805M, margin 19.9% (-80 bp). Adjusted EPS $2.25 against $1.66, GAAP continuing EPS $2.32 against $2.04.
- Cash. Cash from operations $2,203M against $2,556M. Free cash flow $2,042M against $2,362M. Nine-month free cash flow $6,728M (+13%).
- Services. Commercial services revenue +17% (shop visits +12%, spare parts over 20%), services orders +23%, backlog over $170B. Equipment revenue +38%, LEAP deliveries +5% (+26% year to date).
- 2026 guide (raised). Adjusted revenue growth about 19% to 20%, operating profit $10.9B to $11.0B (from $10.55B to $10.75B), adjusted EPS $8.00 to $8.10 (from $7.65 to $7.85), free cash flow $9.1B to $9.4B (from $8.9B to $9.2B).
- 2027. Management expects commercial services to grow at a low double-digit rate.
- This article contains no price target or rating. Every figure comes from the named source, and anything I calculated is marked (d).
Bottom line. GE Aerospace is the strongest operating story in this group, with a services backlog above $170B and orders up almost 50%. The valuation and the cash flow are where care is needed: free cash flow fell while profit rose, and the raised guide implies Q4 operating profit of about $2.69B (d), 10% below Q3. At about 37 times guided EPS the shares leave little room for either a soft Q4 or slower services growth.
Source: GE Aerospace Q3 2026 earnings release, SEC Exhibit 99.1.
Q3 2026 At A Glance
| Metric (Q3 2026) | Result | Change |
|---|---|---|
| Total orders | $19.0B | +49% |
| Adjusted revenue | $13,285M | +18% |
| Operating profit (non-GAAP) / margin | $2,988M / 22.5% | +30% / +220 bp |
| Adjusted EPS | $2.25 | +36% (from $1.66) |
| GAAP continuing EPS | $2.32 | +14% (from $2.04) |
| Cash from operations | $2,203M | -14% (d) |
| Free cash flow | $2,042M | -14% (d) |
| Commercial Engines & Services operating margin | 27.9% | -10 bp |
| Defense & Propulsion operating margin | 13.7% | +20 bp |
| Commercial services backlog | over $170B | n/a |
Source: GE Aerospace Q3 2026 earnings release. Changes marked (d) are my arithmetic on stated dollars.
What The Market Believes vs. What The Data Actually Shows
| Belief | What the release shows |
|---|---|
| Margins are expanding across the business | Operating margin rose 220 bp to 22.5%, but Commercial Engines & Services margin fell 10 bp to 27.9%. The rise came from mix and corporate and other. |
| Profit growth means cash growth | Operating profit rose 30% and free cash flow fell 14%. Free cash flow was 68% of operating profit, against 103% a year ago (d). |
| Services drive the growth | Services revenue rose 17%, but equipment revenue rose 38%, so equipment is growing more than twice as fast. |
| The raised guide implies momentum | It implies Q4 operating profit of about $2.69B and adjusted EPS of about $1.92 (d), below Q3's $2.99B and $2.25. |
| GAAP and adjusted results agree | GAAP margin fell 80 bp while the non-GAAP operating margin rose 220 bp, and GAAP revenue is $833M higher than adjusted revenue (d). |
The conventional narrative is a services annuity on a growing installed base. The release supports the demand side (orders and backlog) but shows an equipment-led quarter, flat segment margin and weaker cash conversion, which is a slightly different profile.
Forensic #1: Where The Operating Profit Increase Came From
| Item | Q3 2025 | Q3 2026 | Change |
|---|---|---|---|
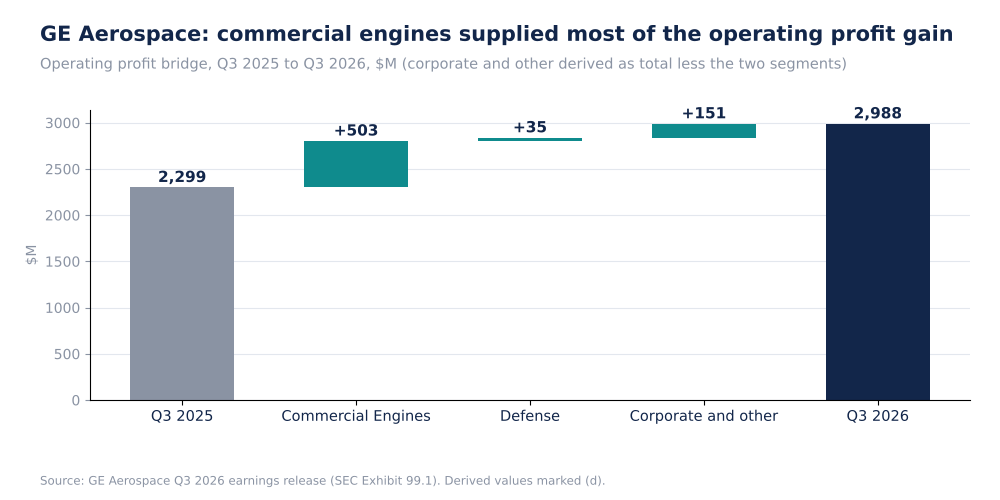
| Commercial Engines & Services operating profit | $2,384M | $2,887M | +$503M (+21%) |
| Defense & Propulsion operating profit | $440M | $475M | +$35M (+8%) |
| Corporate and other (d) | -$525M | -$374M | +$151M |
| Total operating profit (non-GAAP) | $2,299M | $2,988M | +$689M (+30%) |
| Share of increase from commercial engines (d) | n/a | n/a | 73% |
| Share of increase from corporate and other (d) | n/a | n/a | 22% |
GE Aerospace Operating Profit Bridge, $M (Self-Made)
The corporate and other line is the total less the two segments (d), so it includes items the extract does not itemise. Commercial Engines & Services grew revenue by $1,821M and operating profit by $503M, an incremental margin of about 28% (d), the same as its 27.9% average. That means growth added profit at the average rate and did not expand margin.
Why it matters. About a fifth of the increase came from a line that is not a business, and the segment margin was flat. The 220 basis point improvement in the company margin is therefore not evidence of improving unit economics in engines. An investor extrapolating margin gains should check whether the corporate and other line can improve again.
Source: GE Aerospace Q3 2026 earnings release. Corporate and other is derived as total less segments.
Forensic #2: Equipment Is Growing Faster Than Services
| Item | Q3 2026 |
|---|---|
| Commercial Engines & Services revenue | $10,342M (+21%) |
| Commercial services revenue growth | +17% |
| Internal shop visit revenue growth | +12% |
| Spare parts growth | over 20% |
| Commercial services orders growth | +23% |
| Commercial equipment revenue growth | +38% |
| Total engine deliveries / LEAP deliveries | +8% / +5% |
| LEAP deliveries, year to date | +26% |
| Commercial services backlog | over $170B |
GE Aerospace Q3 2026 Year-Over-Year Changes (Self-Made)
Equipment revenue growing at 38% against engine deliveries growing 8% suggests price, mix or non-engine equipment revenue, and the extract does not say which. Internal shop visits rose 12%, slower than spare parts at over 20%, so the faster service growth is in parts sold, and shop visit volume is growing more slowly. Total orders of $19.0B are 1.35 times GAAP revenue (d), and commercial orders are 1.48 times commercial revenue (d).
Why it matters. Equipment sales create the installed base that later produces services, so fast equipment growth is good for the long-term annuity. In the short term it can dilute the mix, since equipment typically carries lower margins than services (a general industry pattern, not stated in the release), which would be consistent with a flat commercial margin. The call to watch is whether services growth of 17% accelerates toward the low double digits guided for 2027, or whether it slows.
Source: GE Aerospace Q3 2026 earnings release. Ratios use stated orders and revenue.
Forensic #3: Cash Flow Fell While Profit Rose
| Item | Q3 2025 | Q3 2026 | Change |
|---|---|---|---|
| Operating profit (non-GAAP) | $2,299M | $2,988M | +30% |
| Cash from operations | $2,556M | $2,203M | -14% |
| Free cash flow | $2,362M | $2,042M | -14% |
| Free cash flow / operating profit (d) | 103% | 68% | -35 pts |
| Nine-month free cash flow | $5,933M | $6,728M | +13% |
| 2026 free cash flow guide | n/a | $9.1B to $9.4B | from $8.9B to $9.2B |
| Implied Q4 free cash flow (d) | n/a | $2.37B to $2.67B | n/a |
Conversion of operating profit into free cash flow fell from 103% to 68% (d). The extract does not give the working capital detail. Nine-month free cash flow is up 13%, so the quarter alone looks weaker than the year, and the guide implies Q4 free cash flow of $2.4B to $2.7B (d), above Q3. The guide of more than 100% conversion for the full year needs cash flow to catch up with earnings in Q4.
Why it matters. Rapid growth in equipment and orders can tie up working capital, so lower conversion may be a side effect of strength, not weakness, though the release extract does not say. It is still the number that decides whether the guided $9.1B to $9.4B of free cash flow is reached, and the guide places more cash flow in Q4 than in Q3.
Source: GE Aerospace Q3 2026 earnings release. Conversion and implied Q4 figures are derived.
Forensic #4: What The Raised Guide Implies For Q4
| Item | Prior guide | Current guide | Implied Q4 (d) |
|---|---|---|---|
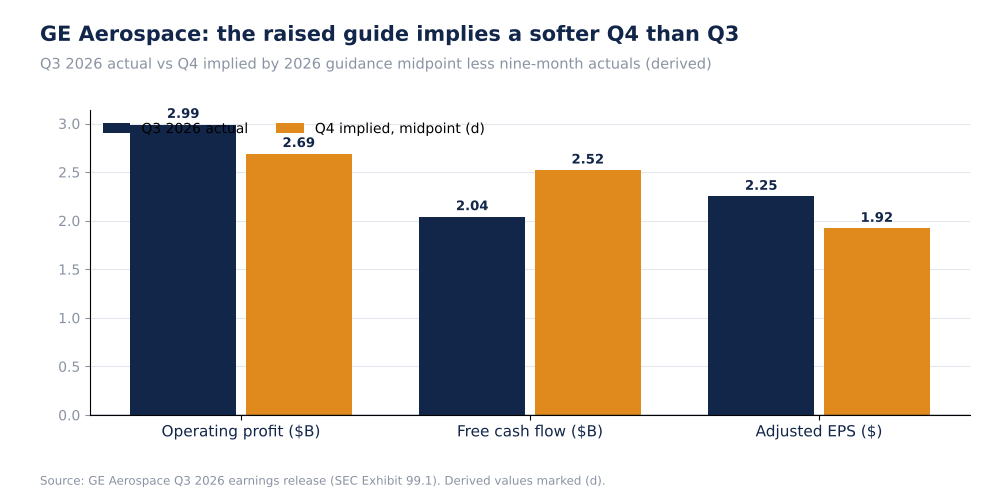
| Operating profit | $10.55B to $10.75B | $10.9B to $11.0B | $2.64B to $2.74B (nine months $8,262M) |
| Adjusted EPS | $7.65 to $7.85 | $8.00 to $8.10 | $1.87 to $1.97 (nine months $6.13) |
| Free cash flow | $8.9B to $9.2B | $9.1B to $9.4B | $2.37B to $2.67B |
| Adjusted revenue growth | high-teens | about 19% to 20% | n/a |
| Commercial Engines & Services profit | $10.25B to $10.35B | $10.5B to $10.6B | n/a |
| Defense & Propulsion profit | $1.6B to $1.7B | $1.6B to $1.7B | unchanged |
GE Aerospace Q3 Actual vs Q4 Implied By Guidance, $B And $ (Self-Made)
The raise lifts the EPS midpoint by about $0.30, or 3.9% (d), but nine-month adjusted EPS is already $6.13, so the guide implies Q4 EPS of $1.87 to $1.97, 12% to 17% below Q3's $2.25 (d). A guide that sits below the Q3 run-rate may be conservative, and I cannot tell from the release. If the guide is exactly right, Q4 would be a sequential decline in profit and EPS after an 18% revenue gain.
Why it matters. Investors sometimes treat a raised guide as proof of momentum. Here the arithmetic points to a softer Q4. Either the guide is cautious, which would leave room for a beat, or Q3 included favourable items that would not repeat.
Source: GE Aerospace Q3 2026 earnings release. Implied Q4 is the guidance range less nine-month actuals (d).
Valuation Snapshot
TradingView shows GE Aerospace at $297.66, up 3.20% on the day, with a market cap of $298.05B and a year-to-date decline of 3.90%. The all-time high shown is $388.84 on Aug 6, 2026. The page says "market closed".
| Measure | Figure |
|---|---|
| Share price (TradingView) | $297.66 |
| Market cap (TradingView) | $298.05B |
| Price vs all-time high (d) | about -23.5% |
| Price / 2026 adjusted EPS guide midpoint ($8.05) (d) | about 37.0 times |
| 2026 free cash flow guide midpoint ($9.25B) / market cap (d) | about 3.1% |
| 2026 operating profit guide midpoint ($10.95B) / market cap (d) | about 3.7% |
The share price is 23.5% below its August peak even as guidance was raised, which could mean the market had priced a lot of the growth already or is reacting to the Q4 implications above. The page does not explain the move.
What has to be true. At about 37 times guided EPS and a 3.1% free cash flow yield, the price assumes services growth in the low double digits continues into 2027, as management expects, and that equipment growth does not dilute margins further. The $170B services backlog supports the first assumption.
Risks: What Would Break The Thesis
- Q4 implied decline. The guide implies lower operating profit and EPS than Q3.
- Cash conversion. Free cash flow was 68% of operating profit in Q3 (d), against 103% a year earlier.
- Mix. Equipment revenue growth of 38% against services at 17%, with segment margin flat.
- Quality of the margin gain. About 22% of the profit increase came from corporate and other.
- Valuation. About 37 times guided EPS.
- Data limits. The extract did not include buybacks, dividends or the non-GAAP reconciliation.
The risks are mostly about the rate of change, not the franchise. The installed base and backlog are not in question in this release. What can disappoint is how quickly growth and cash flow translate into earnings per share.
What To Watch Next
- Q4 operating profit against the implied $2.64B to $2.74B and EPS against $1.87 to $1.97.
- Free cash flow against the $9.1B to $9.4B guide, which needs $2.4B to $2.7B in Q4.
- Commercial Engines & Services margin against 27.9%, as equipment grows faster than services.
- Services growth against 17% and the low double-digit expectation for 2027.
- LEAP deliveries against the 26% year-to-date growth and the 5% Q3 growth.
- The corporate and other line, which supplied about 22% of the Q3 increase.

Sandeep Gupta
Independent equity research analyst publishing forensic theses on US-listed stocks. MBA, Politecnico di Milano School of Management (Milan, Italy).
Get new research in your inbox
Subscribe to receive forensic equity research the moment it's published. Free, no spam.
Related Research
 HON
Honeywell (HON): Adjusted EPS Up 34%, GAAP EPS Down 20%, And Operating Cash Flow Down 74%
 LMT
Lockheed Martin (LMT): Backlog Up 51% To $292B On A Missile Award, But F-35 Deliveries Fell And Free Cash Flow Slipped 10%
 UPS
Discussion
Be the first to comment.