
Investment Thesis
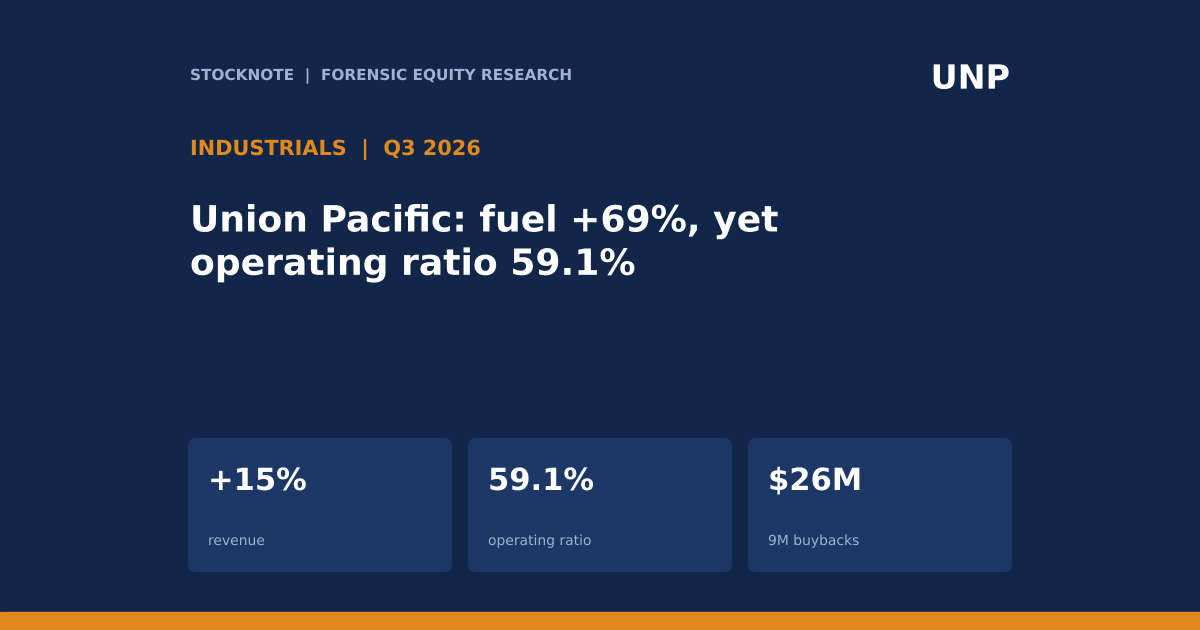
Union Pacific grew Q3 2026 operating revenue 15% to $7,197M and held its operating ratio at 59.1% (59.2%) even though fuel expense rose 69%. The railway's pricing, volume and cost control absorbed a fuel shock; the cash flow statement shows the company has also stopped buying back stock while its Norfolk Southern acquisition is pending.
- Revenue and profit. Operating revenue $7,197M (+15% (d)); operating income $2,943M (+15%); net income $2,076M (+16%); diluted EPS $3.49 ($3.01); adjusted EPS $3.53 ($3.08).
- Operating ratio. Reported 59.1% vs 59.2%; adjusted 58.8% vs 58.5%. The company says higher fuel prices worsened the ratio by 140 basis points.
- Volume and price. Carloads 2,293K (+6% (d)); average revenue per car $2,971 (+8.4% (d)).
- Fuel. Fuel expense $1,040M vs $616M (+69% (d)); average price $4.21 vs $2.56 per gallon.
- Capital. Nine-month buybacks $26M vs $2,679M; dividends declared $1.42 per share (+3%). Norfolk Southern acquisition-related expense $22M in Q3 ($93M year to date).
- This article contains no rating, price target or investment advice. Derived figures are marked (d).
Bottom line. Revenue growth of 15% equals volume growth of 6% multiplied by revenue-per-car growth of 8.4% (d). Costs other than fuel grew 4.4% (d), less than volume, so cost per carload excluding fuel fell 1.5% (d). The unit economics were improving before the fuel effect.
Source: Union Pacific Q3 2026 earnings release.
Q3 2026 At A Glance
| Measure | Q3 2026 | Q3 2025 | Change |
|---|---|---|---|
| Operating revenue | $7,197M | $6,244M | +15% |
| Operating income | $2,943M | $2,549M | +15% |
| Operating ratio (reported) | 59.1% | 59.2% | -0.1 pts |
| Operating ratio (adjusted) | 58.8% | 58.5% | +0.3 pts |
| Diluted EPS | $3.49 | $3.01 | +16% |
| Adjusted diluted EPS | $3.53 | $3.08 | +15% |
| Revenue carloads | 2,293K | 2,163K | +6% |
| Average revenue per car | $2,971 | $2,740 | +8% |
Source: Union Pacific Q3 2026 earnings release.
What The Market Believes vs. What The Data Actually Shows
| Belief | What the data show |
|---|---|
| A 69% fuel increase must hurt margin | The reported operating ratio improved by 0.1 point; the company says fuel cost it 140 basis points, so other factors offset about 150 basis points (d). |
| Growth is a price story | Carloads rose 6% and revenue per car 8.4% (d); revenue per car also includes mix and any fuel surcharge, which the extract does not separate. |
| Bulk is the growth engine | Bulk carloads were flat (529K vs 530K); premium carloads rose 9% and industrial 6%. |
| The Norfolk Southern deal is a minor cost | It cost 0.3 points of operating ratio in Q3 (0.7 points a year earlier) and $0.04 of EPS. |
| Capital return is steady | Buybacks were $26M in nine months against $2,679M, and dividends paid exceeded the company's free cash flow measure. |
Forensic #1: Fuel And The Cost Structure
Rail has a high share of fixed costs (track, locomotives, crews), so the operating ratio reacts strongly to volume, price and fuel. Fuel is the main cost that can swing independently, and railroads usually recover part of it through fuel surcharges recorded in revenue. That makes the 140-basis-point headwind a net concept, and it also means revenue per car is inflated by fuel pass-through.
| $ millions | Q3 2026 | Q3 2025 | Change |
|---|---|---|---|
| Compensation and benefits | 1,264 | 1,214 | +4% |
| Fuel | 1,040 | 616 | +69% |
| Purchased services and materials | 746 | 683 | +9% |
| Depreciation | 643 | 618 | +4% |
| Equipment and other rents | 206 | 212 | -3% |
| Total operating expenses | 4,254 | 3,695 | +15% |
| Total excluding fuel (d) | 3,214 | 3,079 | +4.4% |
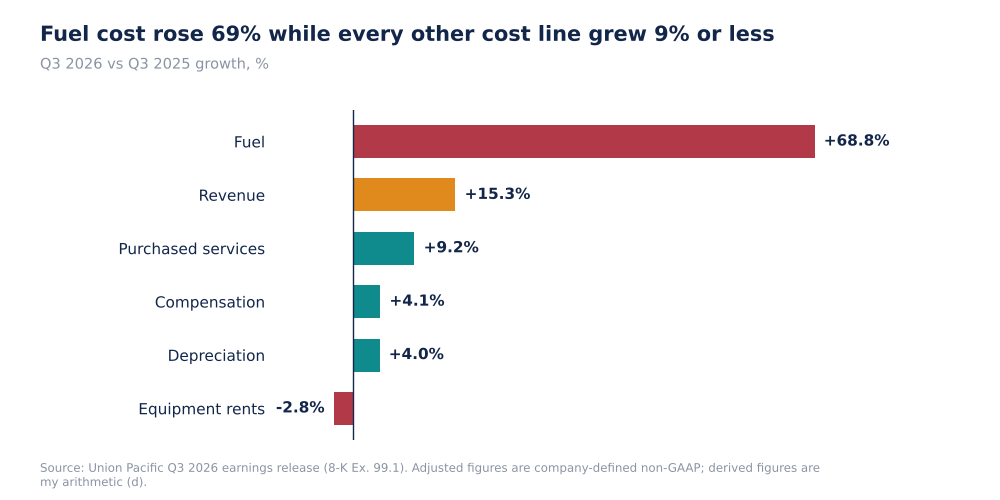
Union Pacific Q3 2026 expense growth by line vs revenue growth
Fuel cost per carload was $454 against $285 (d), a 59% (d) increase. All other expenses per carload were $1,402 against $1,423 (d), down 1.5% (d). Spreading a mostly fixed cost base over 6% more cars is the operating leverage that kept the ratio stable.
Why it matters. If fuel falls back, the 140 basis points should return, while volume leverage persists. If volume stalls, there is less to offset the next fuel spike.
Source: Union Pacific Q3 2026 earnings release (8-K Ex. 99.1). Adjusted figures are company-defined non-GAAP; derived figures are my arithmetic (d).
Forensic #2: Volume, Price And Mix By Commodity Group
| Group | Revenue Q3 2026 | Change | Carloads (K) | Revenue per car change (d) |
|---|---|---|---|---|
| Bulk | $2,116M | +10% | 529 | +9.8% |
| Industrial | $2,509M | +14% | 606 | +8.3% |
| Premium | $2,188M | +21% | 1,158 | +11.0% |
| Total freight | $6,813M | +15% | 2,293 | +8.4% (all groups, d) |
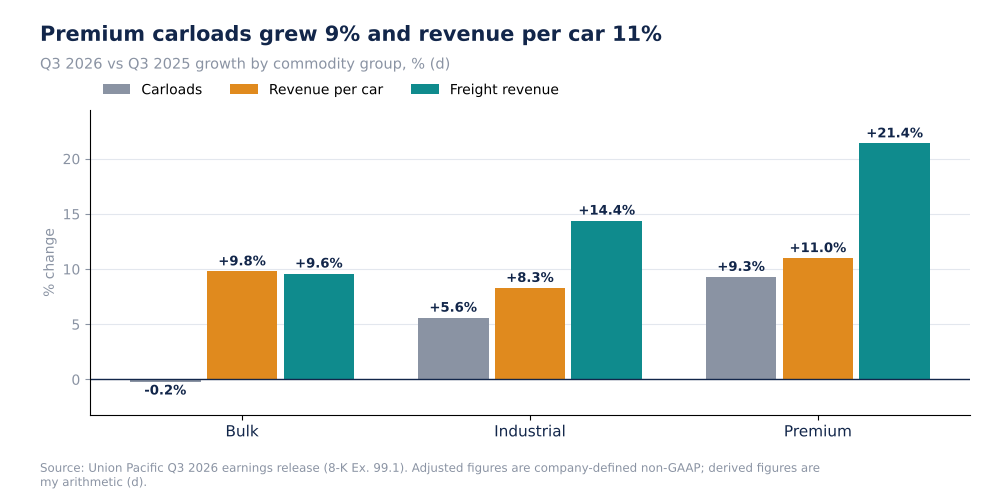
Union Pacific carloads, revenue per car and freight revenue growth by group, Q3 2026 (d)
Revenue per car rose in every group, between 8.3% and 11.0% (d). Premium carries the fastest volume growth, but premium cars earn far less per car ($1,890 (d)) than bulk ($4,000 (d)), because premium, which at railroads typically includes intermodal, moves lower-revenue units. Faster growth in the lower-revenue-per-car group means the total revenue-per-car figure understates like-for-like pricing; a company-wide average moves with mix as well as price.
Why it matters. Mix toward intermodal grows revenue with a lower revenue per unit, so the operating ratio can improve only if the incremental cost per unit is lower still.
Source: Union Pacific Q3 2026 earnings release (8-K Ex. 99.1). Adjusted figures are company-defined non-GAAP; derived figures are my arithmetic (d).
Forensic #3: Cash Flow And Capital Return
| Nine months, $ millions | 2026 | 2025 | Change (d) |
|---|---|---|---|
| Cash from operations | 8,302 | 7,065 | +17.5% |
| Capital investments | 2,834 | 2,792 | +1.5% |
| Dividends paid | 2,484 | 2,418 | +2.7% |
| Share repurchases | 26 | 2,679 | -99% |
| Free cash flow (company measure) | 2,362 | 1,856 | +27% |
| Operations minus capex (d) | 5,468 | 4,273 | +28% |
| Operations minus capex minus dividends (d) | 2,984 | 1,855 | n/a |
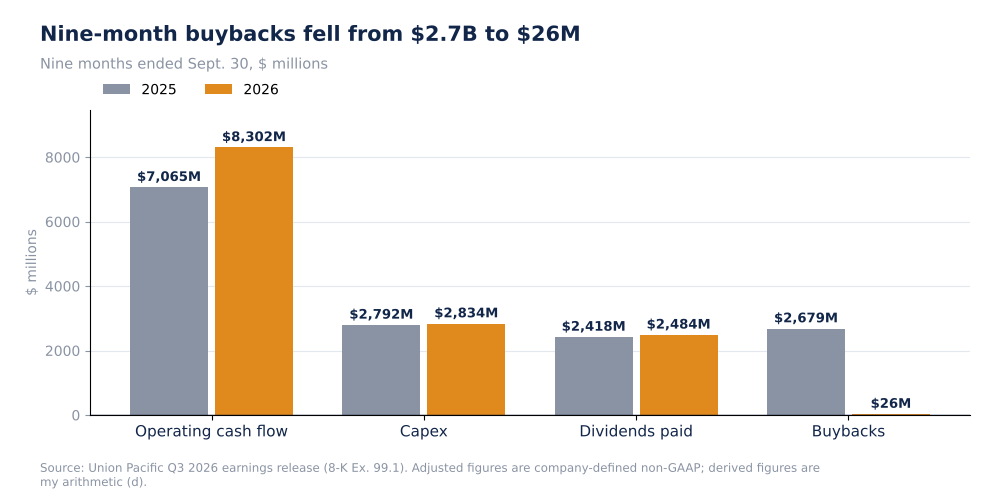
Union Pacific nine-month cash flow, capex, dividends and buybacks
The company's free cash flow measure matches operations minus capex minus dividends in 2025 ($1,855M (d) vs $1,856M reported) but not in 2026: the same calculation gives $2,984M (d) against $2,362M reported, a $622M (d) difference that my extract does not explain. It may reflect a definitional adjustment (for example, merger-related cash items); the 8-K reconciliation should be checked. Whichever measure is used, the pattern holds: operating cash flow rose 18% and the company returned almost nothing through buybacks.
Why it matters. The pause in repurchases leaves about $2.65B (d) more cash over nine months than 2025's pace would have used, but my extract does not say whether it is deal-related.
Source: Union Pacific Q3 2026 earnings release (8-K Ex. 99.1). Adjusted figures are company-defined non-GAAP; derived figures are my arithmetic (d).
Forensic #4: Reported Versus Adjusted
| Measure | Reported | Adjusted | Gap (d) |
|---|---|---|---|
| Operating ratio Q3 2026 | 59.1% | 58.8% | 0.3 pts |
| Operating ratio Q3 2025 | 59.2% | 58.5% | 0.7 pts |
| Diluted EPS Q3 2026 | $3.49 | $3.53 | $0.04 |
| Diluted EPS Q3 2025 | $3.01 | $3.08 | $0.07 |
The gap is almost entirely the Norfolk Southern acquisition expense ($22M in 2026, $41M in 2025; 0.3 and 0.7 points of operating ratio; $0.04 and $0.07 of EPS). On the adjusted basis the operating ratio actually worsened by 0.3 points, while on the reported basis it improved by 0.1, because the deal costs shrank. The reported improvement is therefore partly a fall in deal expense, not operating progress.
Why it matters. The adjusted ratio is the cleaner read of the railway, and it shows a small deterioration under a 140-basis-point fuel headwind.
Source: Union Pacific Q3 2026 earnings release (8-K Ex. 99.1). Adjusted figures are company-defined non-GAAP; derived figures are my arithmetic (d).
Valuation Snapshot
My source has no share price, so I cannot calculate multiples. The operating measures to track are below.
| Measure | Latest |
|---|---|
| Adjusted operating ratio | 58.8% |
| Cost per carload excluding fuel (d) | $1,402 vs $1,423 |
| Revenue carload growth | +6% (d) |
| Nine-month operating cash flow | $8,302M (+18% (d)) |
| 2026 capital plan | $3.5B |
What has to be true. Volume growth must continue to dilute fixed costs, and fuel must not rise further, for the operating ratio to hold near 59%.
Risks: What Would Break The Thesis
- Fuel. Another rise would pressure the ratio if surcharges lag.
- Mix. Growth is in premium, the lowest revenue-per-car group.
- Deal costs. Merger expense of $93M year to date may rise.
- Cash definition. The $622M difference in free cash flow is not explained here.
- Data limits. No share price, no surcharge revenue and no segment profit in the extract.
The reading would be wrong if the filing shows that fuel surcharge revenue explains most of the revenue-per-car gain.
What To Watch Next
- Fuel price per gallon against $4.21 and the stated operating ratio effect.
- Premium and industrial carload growth against +9% and +6%.
- Adjusted operating ratio against 58.8%.
- Resumption or continued pause of repurchases.
- Reconciliation of 2026 free cash flow in the 8-K.
- Acquisition-related expense against $93M year to date.

Sandeep Gupta
Independent equity research analyst publishing forensic theses on US-listed stocks. MBA, Politecnico di Milano School of Management (Milan, Italy).
Get new research in your inbox
Subscribe to receive forensic equity research the moment it's published. Free, no spam.
Discussion
Be the first to comment.