
Investment Thesis
Northrop Grumman reported Q3 2026 sales of $11,122M (+7%), segment operating income of $1,345M (+5%) and GAAP EPS of $7.89 ($7.67). Backlog rose to $109.6B on $16.4B of awards, a book-to-bill ratio of 1.5x. The earnings quality question is about mix: the segments that grew fastest earn less than the segments that grew slowest, so the margin slipped even as profit rose, and a $371M equipment sale flattered free cash flow.
- Sales and profit. Sales $11,122M vs $10,423M (+6.7% (d)); segment operating income $1,345M (+5%); total operating income $1,269M (+2%); net earnings $1,124M (+2%).
- Margin. Segment operating margin 12.1% vs 12.3%; total operating margin 11.4% vs 11.9%.
- Backlog. $109.6B at Sept. 30 (+15% from $95.7B at year-end); funded $50.1B; unfunded $59.5B; Q3 net awards $16.4B.
- Cash. Operating cash flow $1,745M vs $1,557M; adjusted free cash flow $1,810M vs $1,256M, including $371M proceeds from an equipment sale to a customer.
- Guidance. 2026 segment operating income $4,940M to $5,040M (raised); EPS (MTM-adjusted) $29.35 to $29.75 (raised); adjusted free cash flow $3,100M to $3,500M.
- This article contains no rating, price target or investment advice. Derived figures are marked (d).
Bottom line. Growth is strong and the order book is rising, but margin is moving the wrong way because growth is concentrated in lower-margin segments. Free cash flow excluding the equipment sale was $1,439M (d), still up 15% (d) but a third lower than the headline figure suggests.
Source: Northrop Grumman Q3 2026 earnings release.
Q3 2026 At A Glance
| Measure | Q3 2026 | Q3 2025 | Change |
|---|---|---|---|
| Sales | $11,122M | $10,423M | +7% |
| Segment operating income | $1,345M | $1,277M | +5% |
| Segment operating margin | 12.1% | 12.3% | -20 bp |
| Total operating income | $1,269M | $1,242M | +2% |
| Diluted EPS (GAAP) | $7.89 | $7.67 | +3% |
| Operating cash flow | $1,745M | $1,557M | +12% (d) |
| Adjusted free cash flow | $1,810M | $1,256M | +44% (d) |
| Backlog (period end) | $109.6B | $95.7B (12/31/2025) | +15% |
Source: Northrop Grumman Q3 2026 earnings release.
What The Market Believes vs. What The Data Actually Shows
| Belief | What the data show |
|---|---|
| Faster growth means higher margin | Aeronautics (+14%) and Defense (+12%) grew fastest; Defense's margin fell 60 bp and the total segment margin fell 20 bp. |
| Segment profit growth flows to EPS | Segment operating income rose 5% but total operating income rose 2%, because the FAS/CAS operating adjustment fell to $15M from $67M. |
| Free cash flow +44% is organic | $371M was proceeds from an equipment sale; excluding it, Q3 free cash flow was $1,439M (d), up 15% (d). |
| A 1.5x book-to-bill guarantees growth | Awards of $16.4B included $4.6B of restricted programs and $2.0B for Sentinel; backlog equals about 2.5 years of guided 2026 sales (d). |
| Buybacks are resuming | Nine-month repurchases were $68M against $1,168M a year earlier. |
Forensic #1: Segment Mix Versus Margin Rate
A consolidated margin changes for two reasons: the margin within each segment (rate), and the share of sales each segment represents (mix). Separating them shows whether the business got worse or just changed shape. Here I weight segments by sales before intersegment eliminations.
| Segment | Sales Q3 2026 | Sales growth | Margin 2025 to 2026 | Share of segment sales 2025 to 2026 (d) |
|---|---|---|---|---|
| Aeronautics | $3,575M | +14% | 9.7% to 10.5% | 28.6% to 30.3% |
| Defense | $2,307M | +12% | 11.4% to 10.8% | 18.8% to 19.6% |
| Mission | $3,155M | +2% | 16.7% to 15.8% | 28.2% to 26.8% |
| Space | $2,749M | +2% | 11.0% to 11.3% | 24.5% to 23.3% |
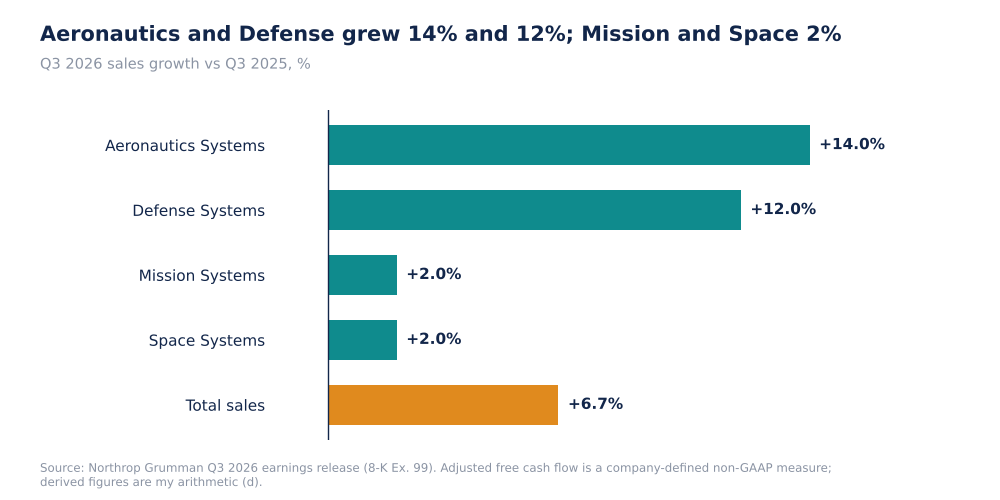
Northrop Grumman sales growth by segment, Q3 2026 vs Q3 2025
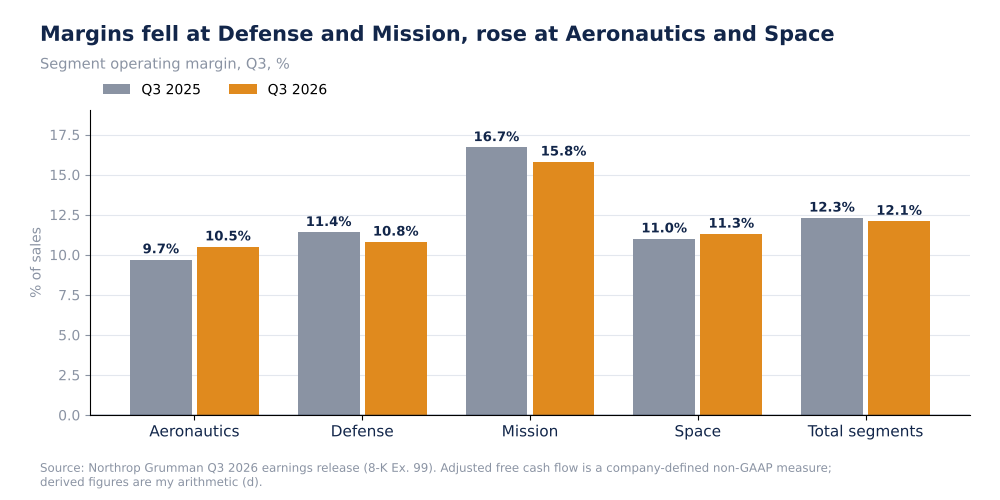
Northrop Grumman segment operating margins, Q3 2025 vs Q3 2026
Weighted by segment sales, the margin moved from 12.31% to 12.16% (d), a change of -14 bp (d). Of that, mix explains -10 bp (d) and within-segment rate changes -5 bp (d). Mix is negative because Mission Systems, the highest-margin segment at about 16%, fell from 28.2% to 26.8% of segment sales (d). The within-segment rate effect is also negative, driven by Mission (-90 bp) and Defense (-60 bp), partly offset by Aeronautics (+80 bp). The weighted result differs slightly from the company's reported 12.3% to 12.1% because of rounding in my back-solved prior-year sales.
Why it matters. Mix dilution is not a sign of weak execution, but it means margin cannot expand unless the high-margin segments accelerate.
Source: Northrop Grumman Q3 2026 earnings release (8-K Ex. 99). Adjusted free cash flow is a company-defined non-GAAP measure; derived figures are my arithmetic (d).
Forensic #2: From Segment Profit To Net Earnings
| $ millions | Q3 2026 | Q3 2025 | Change |
|---|---|---|---|
| Segment operating income | 1,345 | 1,277 | +5% |
| FAS/CAS operating adjustment | 15 | 67 | -78% |
| Intersegment eliminations and other (d) | (91) | (102) | n/a |
| Total operating income | 1,269 | 1,242 | +2% |
| Non-operating FAS pension benefit | 167 | 136 | +23% |
| Effective tax rate | 13.4% | 16.9% | -350 bp |
| Net earnings | 1,124 | 1,100 | +2% |
The FAS/CAS operating adjustment, a pension-related reconciliation between accounting and contract-cost rules, fell by $52M (d), which absorbed about 0.5 point of total margin and explains why total operating income grew 2% against 5% for segments. Lower taxes (13.4% vs 16.9%) and a higher non-operating pension benefit ($167M vs $136M) then supported net earnings. Backing out the tax rate, implied pretax income was about $1,298M (d) against $1,324M (d), a change of -2% (d). Net earnings rose 2% only because the tax rate fell 350 bp; pretax income did not grow.
Why it matters. Segment growth of 5% became EPS growth of 3% after pension and tax effects: the lines between segment profit and EPS are where earnings quality is decided.
Source: Northrop Grumman Q3 2026 earnings release (8-K Ex. 99). Adjusted free cash flow is a company-defined non-GAAP measure; derived figures are my arithmetic (d).
Forensic #3: Cash Flow Quality
| $ millions | Q3 2026 | Q3 2025 | Nine months 2026 | Nine months 2025 |
|---|---|---|---|---|
| Operating cash flow | 1,745 | 1,557 | 1,369 | 860 |
| Capital expenditures | (306) | (301) | (775) | (788) |
| Operating cash flow minus capex (d) | 1,439 | 1,256 | 594 | 72 |
| Equipment-sale proceeds | 371 | none | 371 | none |
| Adjusted free cash flow | 1,810 | 1,256 | 965 | 72 |
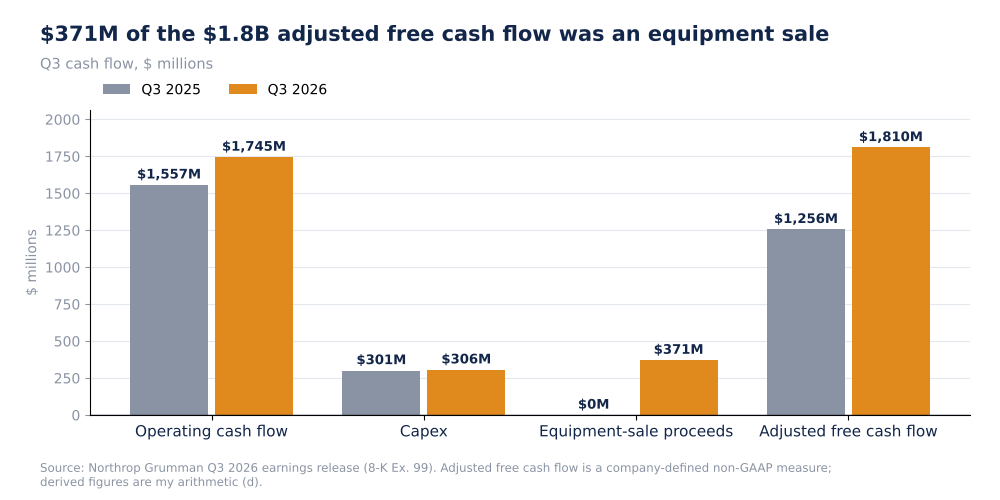
Northrop Grumman Q3 cash flow with equipment-sale proceeds separated
The $371M is 20% (d) of Q3 adjusted free cash flow and 38% (d) of the nine-month figure. Excluding it, nine-month free cash flow is $594M (d) against $72M a year earlier. The full-year guide of $3,100M to $3,500M therefore implies fourth-quarter adjusted free cash flow of $2,135M to $2,535M (d), more than Q3's $1,810M including the equipment sale. The cash is back-end loaded.
Why it matters. The year's cash target depends on a Q4 that is larger than any quarter so far; a miss would show up there.
Source: Northrop Grumman Q3 2026 earnings release (8-K Ex. 99). Adjusted free cash flow is a company-defined non-GAAP measure; derived figures are my arithmetic (d).
Forensic #4: Backlog, Awards And Guidance
| Backlog, $B | Amount | Share (d) |
|---|---|---|
| Aeronautics | 26.8 | 24% |
| Defense | 36.5 | 33% |
| Mission | 20.0 | 18% |
| Space | 26.3 | 24% |
| Total | 109.6 | 100% |
| Funded / unfunded | 50.1 / 59.5 | 46% funded (d) |
Backlog of $109.6B is about 2.5 years (d) of guided 2026 sales, and 54% (d) of it is unfunded, meaning not yet appropriated or obligated. Q3 awards of $16.4B exceeded sales by about $5.3B (d), which explains the sequential growth. Guidance for segment operating income was raised at the midpoint by about $65M (d) (1.3%) and EPS by about $0.70 (d) (2.4%), while the guide for the Aeronautics margin was nudged to "high 9%" from "mid to high 9%" and Mission to "mid 15%" from about 15%.
Why it matters. A growing unfunded backlog is a measure of future demand but also of dependence on appropriations timing.
Source: Northrop Grumman Q3 2026 earnings release (8-K Ex. 99). Adjusted free cash flow is a company-defined non-GAAP measure; derived figures are my arithmetic (d).
Valuation Snapshot
My source has no share price, so I cannot calculate multiples. The measures to track are below.
| Measure | Latest |
|---|---|
| Backlog / guided 2026 sales | 2.5x (d) |
| Segment operating margin, Q3 | 12.1% |
| Free cash flow Q3 excluding equipment sale | $1,439M (d) |
| 2026 adjusted free cash flow guide | $3,100M to $3,500M |
| Implied Q4 adjusted free cash flow | $2,135M to $2,535M (d) |
What has to be true. Q4 cash flow must be much stronger than any quarter this year, and the mix shift away from Mission must not push margin below the guided levels.
Risks: What Would Break The Thesis
- Mix dilution. Growth is concentrated in lower-margin segments.
- Cash back-loading. Q4 must deliver about $2.1B to $2.5B (d).
- Equipment sale. $371M is non-recurring.
- Unfunded backlog. 54% (d) of backlog is unfunded.
- Data limits. No MTM-adjusted EPS for Q3, no share price and no quarterly buyback figure in the extract.
The reading would be wrong if the filing shows that Q4 cash receipts are contractually scheduled and that segment mix reverses.
What To Watch Next
- Fourth-quarter adjusted free cash flow against the implied $2.1B to $2.5B (d).
- Mission Systems margin against 15.8%, and Defense Systems against 10.8%.
- Backlog against $109.6B and funded share against 46% (d).
- FAS/CAS operating adjustment against $15M.
- Effective tax rate against 13.4%.
- Share repurchases against $68M in nine months.

Sandeep Gupta
Independent equity research analyst publishing forensic theses on US-listed stocks. MBA, Politecnico di Milano School of Management (Milan, Italy).
Get new research in your inbox
Subscribe to receive forensic equity research the moment it's published. Free, no spam.
Discussion
Be the first to comment.