
Investment Thesis
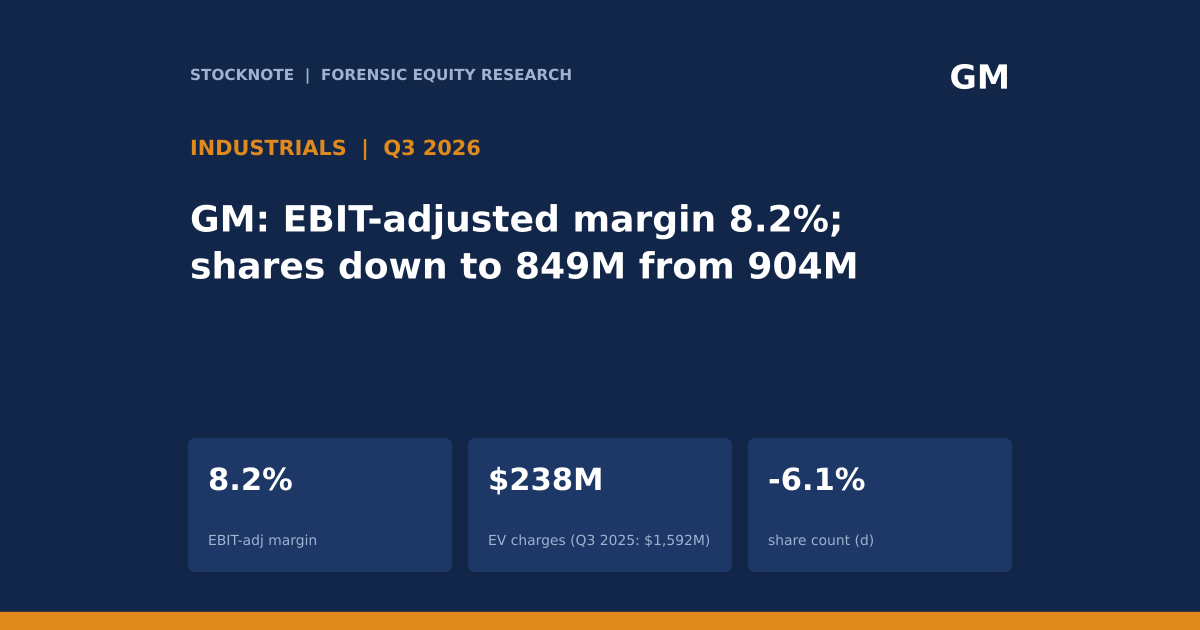
General Motors reported third-quarter 2026 revenue of $50,015 million, net income of $3,335 million (against $1,327 million a year earlier) and EBIT-adjusted of $4,106 million, an 8.2% margin. Diluted EPS was $3.73 and adjusted EPS $3.70. The improvement in net income is largely explained by a fall in EV realignment charges, from $1,592 million in the third quarter of 2025 to $238 million. Underneath the profit, vehicle volumes tell a different story: wholesale shipments rose 5.2% to 1,028,000 but worldwide sales fell 11.1% to 1,390,000, with China sales down 23.7%. Meanwhile buybacks reduced the share count to 849 million from 904 million.
- Profit. Revenue $50,015M; net income $3,335M; EBIT-adjusted $4,106M (8.2%); diluted EPS $3.73; adjusted EPS $3.70.
- Segments. GM North America $3,592M (8.7% margin); GM International $28M; GM Financial $668M.
- Cash. Automotive operating cash flow $8,049M; adjusted automotive free cash flow $5,882M.
- Capital return. Nine-month buybacks $5,301M; shares 849M against 904M a year earlier; new $20B authorization.
- Guidance. EBIT-adjusted $14.5B to $15.5B; adjusted automotive free cash flow $11.5B to $12.5B; adjusted EPS $12.75 to $13.75.
- This article contains no rating, price target or investment advice. Derived figures are marked (d).
Bottom line. GM's profit is being made in North America and is being helped by lower EV write-downs and a shrinking share count. Neither of those is a sign that demand is growing. Sales fell 11.1% worldwide while wholesale shipments rose 5.2%, and until those two volume measures are reconciled the quarter's strength is hard to judge.
Source: GM Q3 2026 8-K earnings release.
Q3 2026 At A Glance
| Q3 2026 | Value |
|---|---|
| Revenue | $50,015M |
| Net income | $3,335M (Q3 2025: $1,327M) |
| EBIT-adjusted / margin | $4,106M / 8.2% |
| GM North America EBIT-adjusted / margin | $3,592M / 8.7% |
| GM International / GM Financial | $28M / $668M |
| Diluted EPS / adjusted EPS | $3.73 / $3.70 |
| EV realignment charges | $238M (Q3 2025: $1,592M; nine months $3,594M) |
| Automotive operating cash flow / adjusted automotive FCF | $8,049M / $5,882M |
| Wholesale / worldwide sales | 1,028K (+5.2%) / 1,390K (-11.1%) |
| US market share / fleet share of sales | 16.1% / 19.2% |
Source: GM.
What The Market Believes vs. What The Data Actually Shows
| Belief | What the data show |
|---|---|
| Earnings more than doubled, so the business is accelerating | Net income rose $2,008M (d), and the EV charge fell $1,354M (d) in the same period, so about two thirds of the increase (67%, d) is a smaller write-down, before tax effects. |
| The 8.2% margin is a structural level | EBIT-adjusted excludes charges such as EV realignment, which were $3,594M in nine months; the margin is before those costs. |
| Volume is growing | Wholesale was +5.2% but worldwide sales were -11.1% and China sales -23.7%. |
| Buybacks are a sign of excess cash | Nine-month buybacks were $5,301M, and guided adjusted automotive free cash flow is $11.5B to $12.5B. |
| Fleet is a minor channel | Fleet was 19.2% of sales, so about one in five vehicles sold went to fleet customers. |
Forensic #1: Where The Profit Is Made
| Q3 2026 EBIT-adjusted ($M) | Amount | Share of total (d) |
|---|---|---|
| GM North America | 3,592 | 87% |
| GM Financial | 668 | 16% |
| GM International | 28 | 0.7% |
| Corporate and other (d) | -182 | -4% |
| Total | 4,106 | 100% |
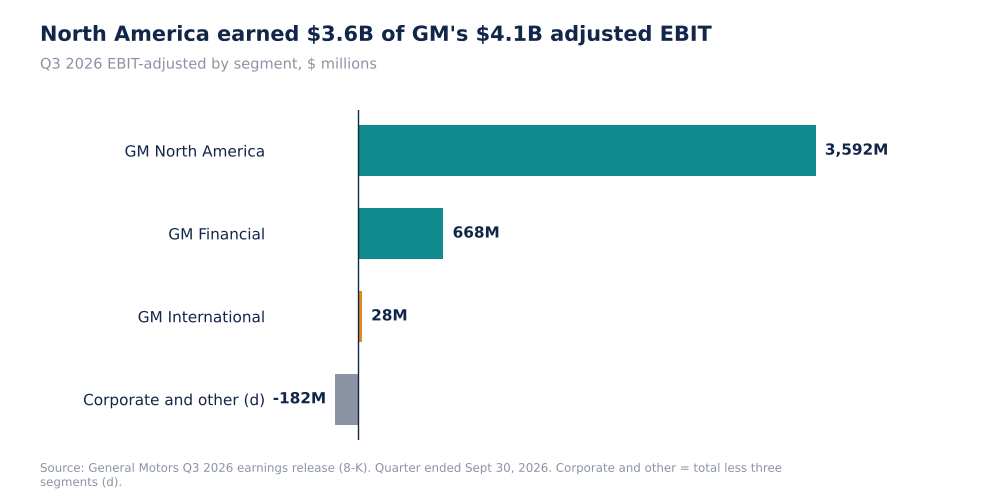
GM Q3 2026 EBIT-Adjusted By Segment, $M (Self-Made, GM Data, Corporate Line d)
North America supplied 87% of the total (d), GM Financial 16% (d) and International under 1% (d). The three segments sum to $4,288 million, so corporate and other accounts for a negative $182 million (d). The profit pool is therefore concentrated in one region and in a financing arm whose earnings depend on credit conditions and interest margins.
Why it matters. A manufacturer with 8.7% margins in one region and break-even elsewhere is exposed to anything that touches that region: tariffs, pricing and mix. The worldwide sales decline sits mostly outside the profit pool, which is why it does not yet show in earnings.
Source: GM. Shares and corporate line are my arithmetic (d).
Forensic #2: What Changed In Net Income
| $ millions | Q3 2025 | Q3 2026 | Change (d) |
|---|---|---|---|
| EV realignment charges | 1,592 | 238 | -1,354 |
| Net income | 1,327 | 3,335 | +2,008 |
| Change in charges as % of change in net income (d) | 67% |
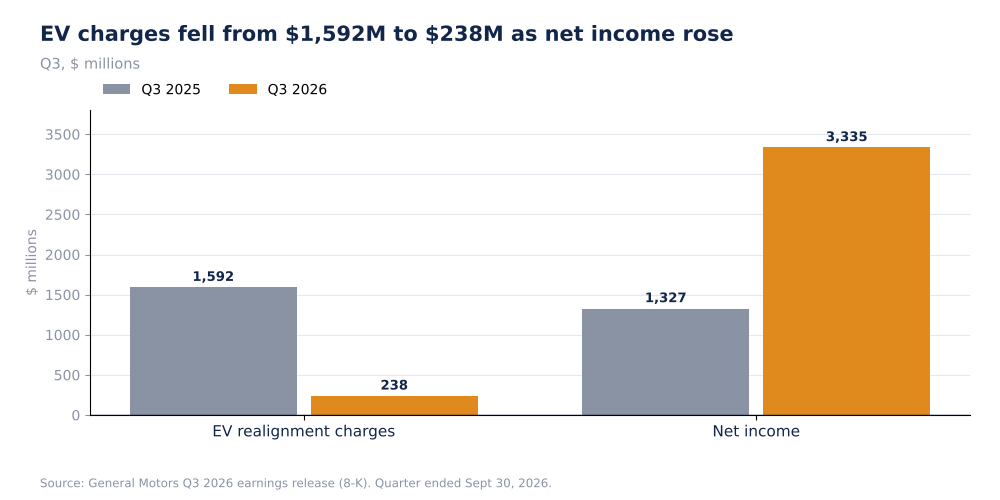
GM EV Realignment Charges And Net Income, Q3 2025 Vs Q3 2026, $M (Self-Made)
The comparison mixes a pre-tax charge with after-tax net income, so the 67% is a rough indicator and not an exact attribution. Even so, the direction is clear: charges fell by $1,354 million, and net income rose by $2,008 million. The charge is not a one-off in the nine-month view: $3,594 million has been taken in nine months of 2026, so the third quarter's $238 million is a lower quarter within a year in which EV write-downs have been large. The extract does not say how much more is expected.
Why it matters. A recurring item that is excluded from adjusted earnings is still a real cost to shareholders. The more useful comparison of operating progress is EBIT-adjusted, but the cash cost of EV realignment belongs in any assessment of free cash flow.
Source: GM. Changes are my subtraction (d).
Forensic #3: Wholesale, Sales And The Gap
| Q3 2026 volume | Units / change |
|---|---|
| Wholesale | 1,028K (+5.2%) |
| Worldwide sales | 1,390K (-11.1%) |
| China sales | -23.7% |
| US market share | 16.1% |
| Fleet as % of sales | 19.2% |
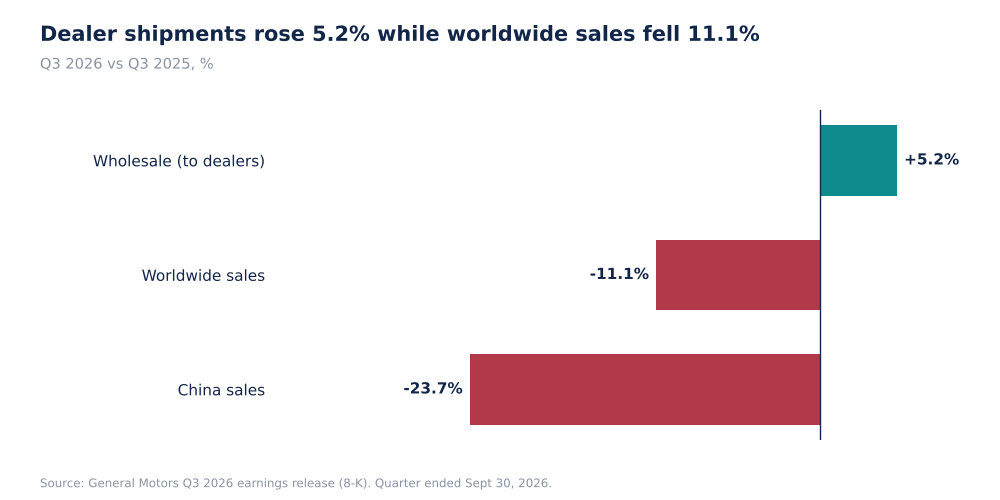
GM Q3 2026 Volume Change Vs Q3 2025, % (Self-Made, GM Data)
Wholesale counts vehicles shipped to dealers and sales counts vehicles sold to end customers, and the two measures also cover different scopes: worldwide sales are reported at 1,390K, larger than wholesale at 1,028K. The extract does not reconcile them, but the two numbers moving in opposite directions (+5.2% and -11.1%) is the pattern that deserves explanation. A fall in China sales of 23.7% is consistent with the weaker worldwide total, though the extract does not give China's share of it.
Why it matters. Revenue is recognised when vehicles are wholesaled, so revenue and profit can run ahead of end-customer sales for a time. If dealers hold more inventory it can reverse. The extract does not give dealer inventory, so I cannot measure it.
Source: GM.
Forensic #4: Cash And Buybacks
| Measure | Value |
|---|---|
| Automotive operating cash flow, Q3 | $8,049M |
| Adjusted automotive free cash flow, Q3 | $5,882M |
| Nine-month buybacks | $5,301M |
| Shares outstanding | 849M (a year earlier 904M) |
| Reduction in share count (d) | 6.1% |
| Per-share lift from fewer shares, same earnings (d) | 6.5% |
| Guided adjusted automotive FCF, 2026 | $11.5B to $12.5B |
Buying back 6.1% of the shares (d) raises earnings per share by about 6.5% (d: 904 / 849) with no change in profit. In a quarter where worldwide sales fell 11.1%, that mechanical effect supports EPS. Automotive free cash flow of $5,882 million in the quarter is large against the nine-month buyback of $5,301 million, and a new $20 billion authorization is in place. I do not have dividend amounts or full-year capex, so I cannot compute the full payout ratio.
Why it matters. The quality of the per-share growth depends on the price paid for the shares: buying back at lower prices raises the benefit. The extract has no share price or average repurchase price, so I cannot test that.
Source: GM. Percentages are my arithmetic (d).
Valuation Snapshot
I have no GM share price in my sources, so I do not calculate multiples. The guidance range gives the earnings and cash base:
| 2026 guidance | Low | High |
|---|---|---|
| EBIT-adjusted | $14.5B | $15.5B |
| Adjusted automotive free cash flow | $11.5B | $12.5B |
| Adjusted EPS | $12.75 | $13.75 |
What has to be true. The guidance holds only if North America keeps earning near 8.7% on its volume, if tariffs and pricing do not shift, and if the end-customer sales decline does not force wholesale to fall. The extract does not give nine-month EBIT-adjusted, so the implied fourth quarter cannot be calculated here.
Risks: What Would Break The Thesis
- Volume. Worldwide sales -11.1% and China -23.7% are not yet in profit.
- Concentration. North America earned 87% of EBIT-adjusted (d).
- EV charges. $3,594M in nine months; more could follow.
- Scope difference. Wholesale and sales are not reconciled in my extract.
- Financing arm. GM Financial earned $668M, which depends on credit quality.
- No valuation. No price data in my sources.
The reading would be wrong if wholesale and sales converged because dealer inventory was already low, or if EV charges ended.
What To Watch Next
- Fourth-quarter results and the 2026 guidance range.
- Wholesale against sales and dealer inventory.
- EV realignment charges after $3,594M year to date.
- Share count against 849M and use of the new $20B authorization.
- China sales after -23.7%.
- GM Financial earnings against $668M.

Sandeep Gupta
Independent equity research analyst publishing forensic theses on US-listed stocks. MBA, Politecnico di Milano School of Management (Milan, Italy).
Get new research in your inbox
Subscribe to receive forensic equity research the moment it's published. Free, no spam.
Related Research

Latest earnings releases: GM
— GM releases 2026 third-quarter results and updates full-year 2026 guidance
Discussion
Be the first to comment.