

Investment Thesis
GM beat on Q3 profit and raised its cash flow guide, but its EBIT midpoint did not move, the guide implies a much weaker Q4, and a third of this year's adjusted free cash flow is add-backs.
- Earnings. Revenue was $50.0B (+2.9%). EBIT-adjusted rose 21.6% to $4,106M, an 8.2% margin vs 6.9%. Adjusted EPS was $3.70 vs $2.80 (+32%), and GAAP EPS was $3.73 vs $1.35.
- The guide. EBIT-adjusted guidance narrowed to $14.5B to $15.5B from $14.0B to $16.0B, and adjusted EPS to $12.75 to $13.75 from $12.00 to $14.00. The EBIT midpoint is unchanged at $15.0B and the EPS midpoint rose only $0.25, from $13.00 to $13.25. Adjusted automotive free cash flow was raised to $11.5B to $12.5B from $9.5B to $11.5B.
- Implied Q4. Subtracting nine-month actuals gives Q4 EBIT-adjusted of $2.2B to $3.2B (22% to 46% below Q3's $4.1B) and adjusted automotive free cash flow of -$0.7B to +$0.3B, against $5.9B in Q3 (derived).
- Free cash flow quality. Nine-month adjusted automotive free cash flow was $12.2B, but operating cash flow minus capex was $7.9B. The $4.3B gap, 35% of the adjusted figure, is add-backs, against $0.8B a year earlier (derived).
- EPS quality. About 10 points of the 32% adjusted EPS growth came from a smaller share count. Without it, growth would have been about 21.6%, the same as EBIT growth (derived).
- Where profit came from. GM North America produced 87% of EBIT-adjusted. International fell 88%, GM Financial fell 17% and China equity income fell 60%.
- Buyback. The new $20B authorization is about 31% of the $65.4B market value at the Oct 20 close (derived). Shares outstanding are 849M, down 29% from 1.2B at the end of 2023.
- Stock. It fell 6.84% to $77.09 on Oct 20. That is about 5.8x the midpoint of adjusted EPS guidance (derived).
- This article contains no price target or rating. Every figure comes from GM's release or a named source, and anything I calculated is marked.
Source: GM releases 2026 third-quarter results and updates full-year 2026 guidance, Oct 20, 2026.
Q3 2026 At A Glance
Revenue grew 2.9% to $50.0B, while adjusted profit measures grew much faster, helped by lower EV charges, a smaller share count and North America margin.
| Metric (quarter ended Sept 30) | Q3 2026 | Q3 2025 | Change |
|---|---|---|---|
| Revenue | $50,015M | $48,591M | +2.9% |
| Net income attributable to stockholders | $3,335M | $1,327M | +151% |
| Diluted EPS (GAAP) | $3.73 | $1.35 | +176% (d) |
| EBIT-adjusted | $4,106M | $3,376M | +21.6% |
| EBIT-adjusted margin | 8.2% | 6.9% | +1.3 pts |
| EPS-diluted-adjusted | $3.70 | $2.80 | +32% |
| EV strategic realignment charges excluded | $238M | $1,592M | -$1,354M (d) |
| Automotive operating cash flow | $8,049M | $6,070M | +33% |
| Capex, automotive | $2,333M | $2,113M | +10% |
| Adjusted automotive free cash flow | $5,882M | $4,201M | +40% |
| Diluted weighted-average shares | 887M | 964M | -8.0% (d) |
| Effective tax rate (GAAP / adjusted) | 14.3% / 19.9% | 8.9% / 19.8% | n/m |
(d) = derived. Q3 2025 net income and EPS were depressed by $1.59B of EV charges, so the GAAP growth rates are not like-for-like. Source: GM Q3 2026 release tables via Stock Titan, Oct 20, 2026.
What The Market Believes vs. What The Data Actually Shows
The shares fell 6.84% on a quarter that beat on revenue and raised the cash flow guide, because the profit ranges narrowed around the same midpoints and the arithmetic points to a weaker Q4.
| 2026 guidance | Prior | Updated | Midpoint change |
|---|---|---|---|
| EBIT-adjusted | $14.0B to $16.0B | $14.5B to $15.5B | none ($15.0B) |
| EPS-diluted-adjusted | $12.00 to $14.00 | $12.75 to $13.75 | +$0.25 ($13.00 to $13.25) (d) |
| Net income attributable | $8.4B to $9.8B | $8.9B to $9.5B | +$0.1B (d) |
| Automotive operating cash flow | $15.4B to $19.4B | $17.3B to $20.3B | +$1.4B (d) |
| Adjusted automotive free cash flow | $9.5B to $11.5B | $11.5B to $12.5B | +$1.5B (d) |
| Capital expenditures | $10.0B to $12.0B | $10.0B to $12.0B (lower half, per the call) | none |
The EBIT-adjusted midpoint is unchanged at $15.0B, while the adjusted EPS midpoint rose $0.25. With unchanged EBIT, that fits the smaller share count (my reading, derived). TIKR describes both midpoints as unchanged; the release's own ranges give $13.00 and $13.25 for the EPS midpoint.
| Implied Q4 2026 (d) | 9M 2026 actual | FY2026 guidance | Implied Q4 | Q3 actual |
|---|---|---|---|---|
| EBIT-adjusted | $12,302M | $14.5B to $15.5B | $2,198M to $3,198M | $4,106M |
| EPS-diluted-adjusted | $10.97 | $12.75 to $13.75 | $1.78 to $2.78 | $3.70 |
| Automotive operating cash flow | $13,653M | $17.3B to $20.3B | $3,647M to $6,647M | $8,049M |
| Adjusted automotive free cash flow | $12,184M | $11.5B to $12.5B | -$684M to +$316M | $5,882M |
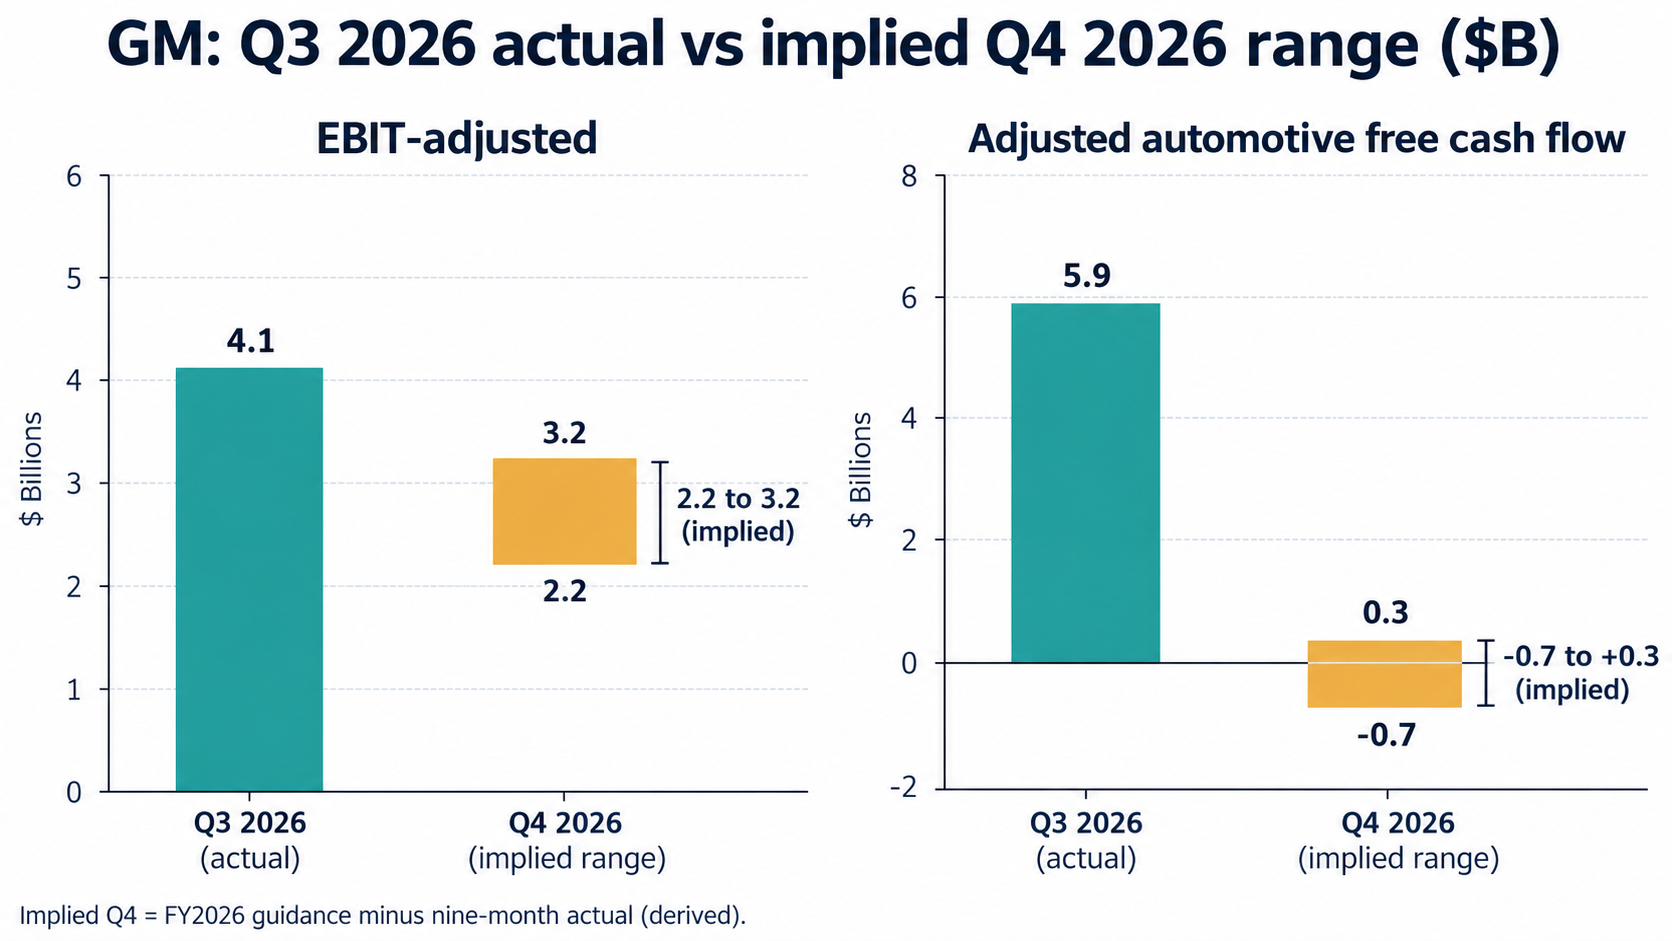
Q3 2026 Actuals vs Implied Q4 2026 Ranges: EBIT-Adjusted and Free Cash Flow (Self-Made)
Implied Q4 EBIT-adjusted is 22% to 46% below Q3, and implied Q4 EPS 25% to 52% below (derived). TIKR puts Q4 2025 EBIT-adjusted at about $2.8B, so the implied range is roughly 21% below to 14% above last year's Q4 (derived from that third-party figure). TIKR also notes that Q3's cash flow benefited from payables, which it says are up about $5.8B since December; I could not confirm that figure in the release tables I read.
Consensus context: adjusted EPS of $3.70 is described as a beat against $3.57 (TIKR, citing Bloomberg) and $3.69 (Investing.com), but a slight miss against $3.74 (Money365). Revenue of $50.0B beat consensus of $48.5B to $48.8B on both sources. The sources do not agree on the EPS consensus, so I treat the EPS result as roughly in line.
(d) = my arithmetic: full-year guidance minus nine-month actuals. Sources: GM Q3 2026 release via Stock Titan; TIKR, Oct 21; TIKR, Oct 20; Investing.com call summary.
Forensic #1: A Third Of The Free Cash Flow Is Add-Backs
GM's headline adjusted automotive free cash flow grew 55% over nine months, but operating cash flow minus capex grew only 12%.
| Nine months ($M) | 2026 | 2025 | Change |
|---|---|---|---|
| Automotive operating cash flow | 13,653 | 13,127 | +4% |
| Capital expenditures | 5,758 | 6,054 | -5% |
| Operating cash flow minus capex (d) | 7,895 | 7,073 | +12% |
| Adjusted automotive free cash flow | 12,184 | 7,840 | +55% |
| Difference: add-backs (d) | 4,289 | 767 | +$3.5B |
| Add-backs as % of adjusted figure (d) | 35% | 10% |
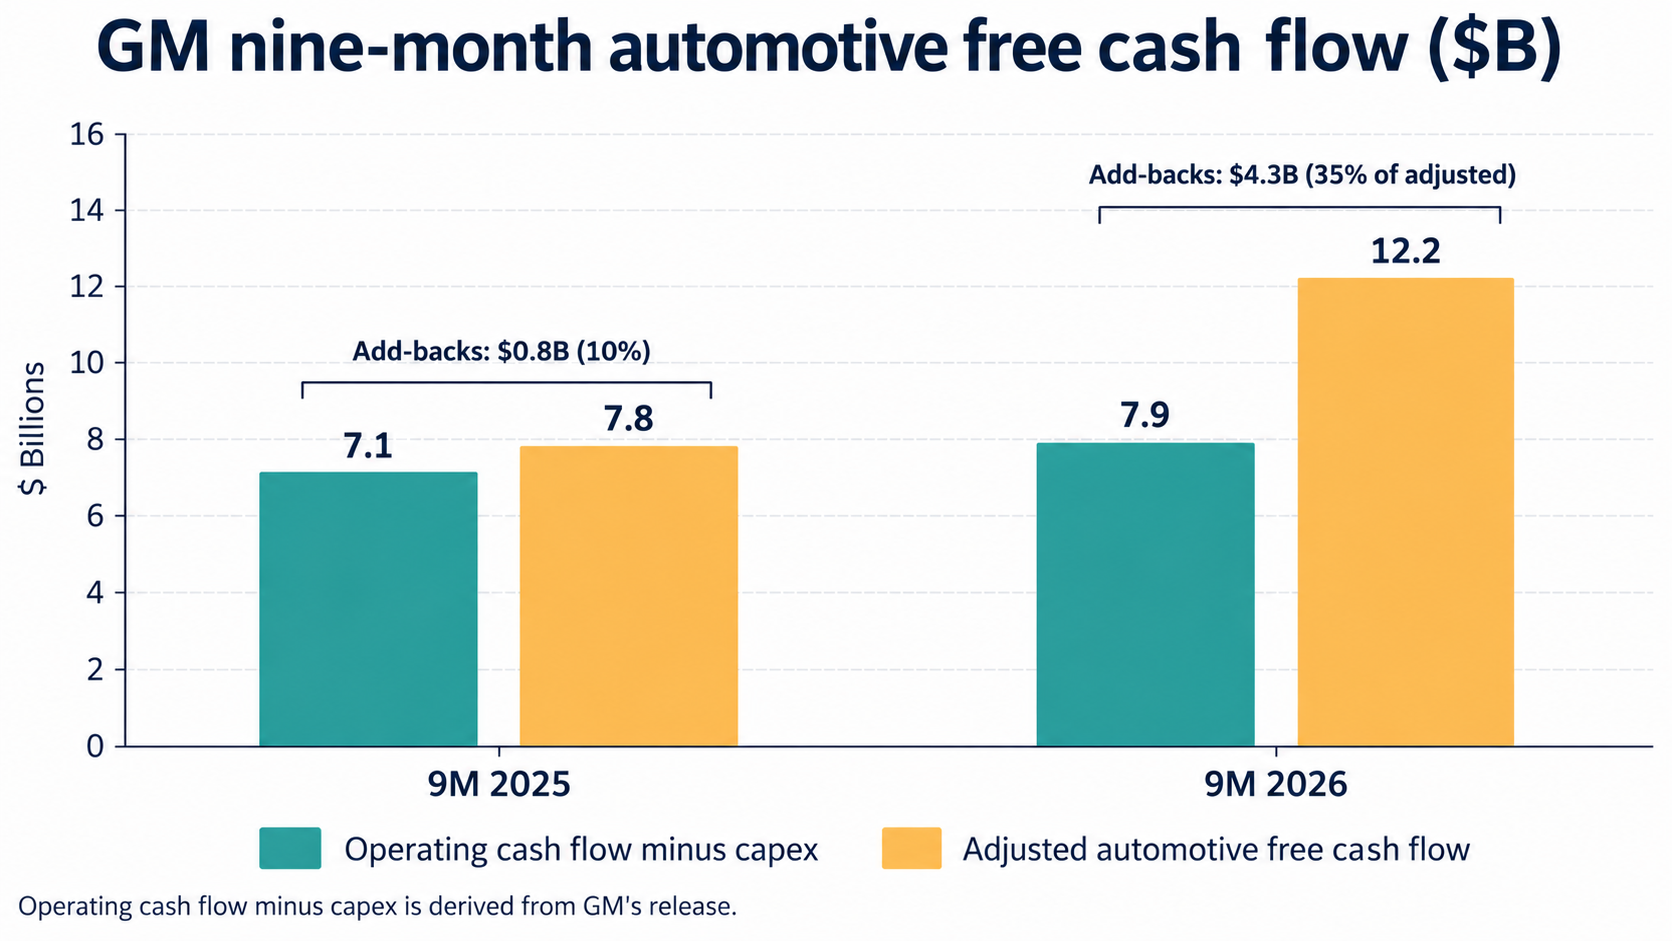
Nine-Month Free Cash Flow: Operating Cash Flow Minus Capex vs Adjusted, 2025 and 2026 (Self-Made)
The guidance table shows the same pattern for the full year: adjusted automotive free cash flow of $11.5B to $12.5B includes a $4.2B adjustment, which leaves $7.3B to $8.3B of operating cash flow minus capex (derived). At the Oct 20 close the guide equals a 17.6% to 19.1% yield on adjusted free cash flow, but 11.2% to 12.7% without the add-back (derived).
GM's release says the adjustments relate to EV strategic realignment: $139M of EV-related cash add-back in Q3 against none a year ago. On the call, the CFO said total EV cash charges have reached $7.4B, with $4.6B paid, about $1B expected in Q4 and the rest in 2027. The release excerpt I read does not itemise the remaining add-backs.
Q3 itself: operating cash flow of $8,049M minus capex of $2,333M is $5,716M, against an adjusted figure of $5,882M (derived). The cash is real, but Q4 is guided to roughly zero adjusted free cash flow, so Q3 was the high point. Capex is guided to the lower half of $10B to $12B, which leaves about $4.2B to $5.2B for Q4 (derived).
(d) = my arithmetic from the release's cash flow reconciliation. Sources: GM Q3 2026 release via Stock Titan; Investing.com call summary.
Forensic #2: North America Earned 87% Of The Profit
GM North America EBIT-adjusted rose 43% to $3,592M, while every other profit line was lower.
| EBIT-adjusted by segment ($M) | Q3 2026 | Q3 2025 | Change | 9M 2026 | 9M 2025 |
|---|---|---|---|---|---|
| GM North America | 3,592 | 2,506 | +43% | 10,699 | 8,207 |
| GM International | 28 | 226 | -88% | 342 | 460 |
| GM Financial (EBT-adjusted) | 668 | 804 | -17% | 1,962 | 2,193 |
| Corporate and eliminations | -183 | -160 | n/m | -700 | -684 |
| Cruise | 0 | 0 | n/m | 0 | -273 |
| Total EBIT-adjusted | 4,106 | 3,376 | +22% | 12,302 | 9,903 |
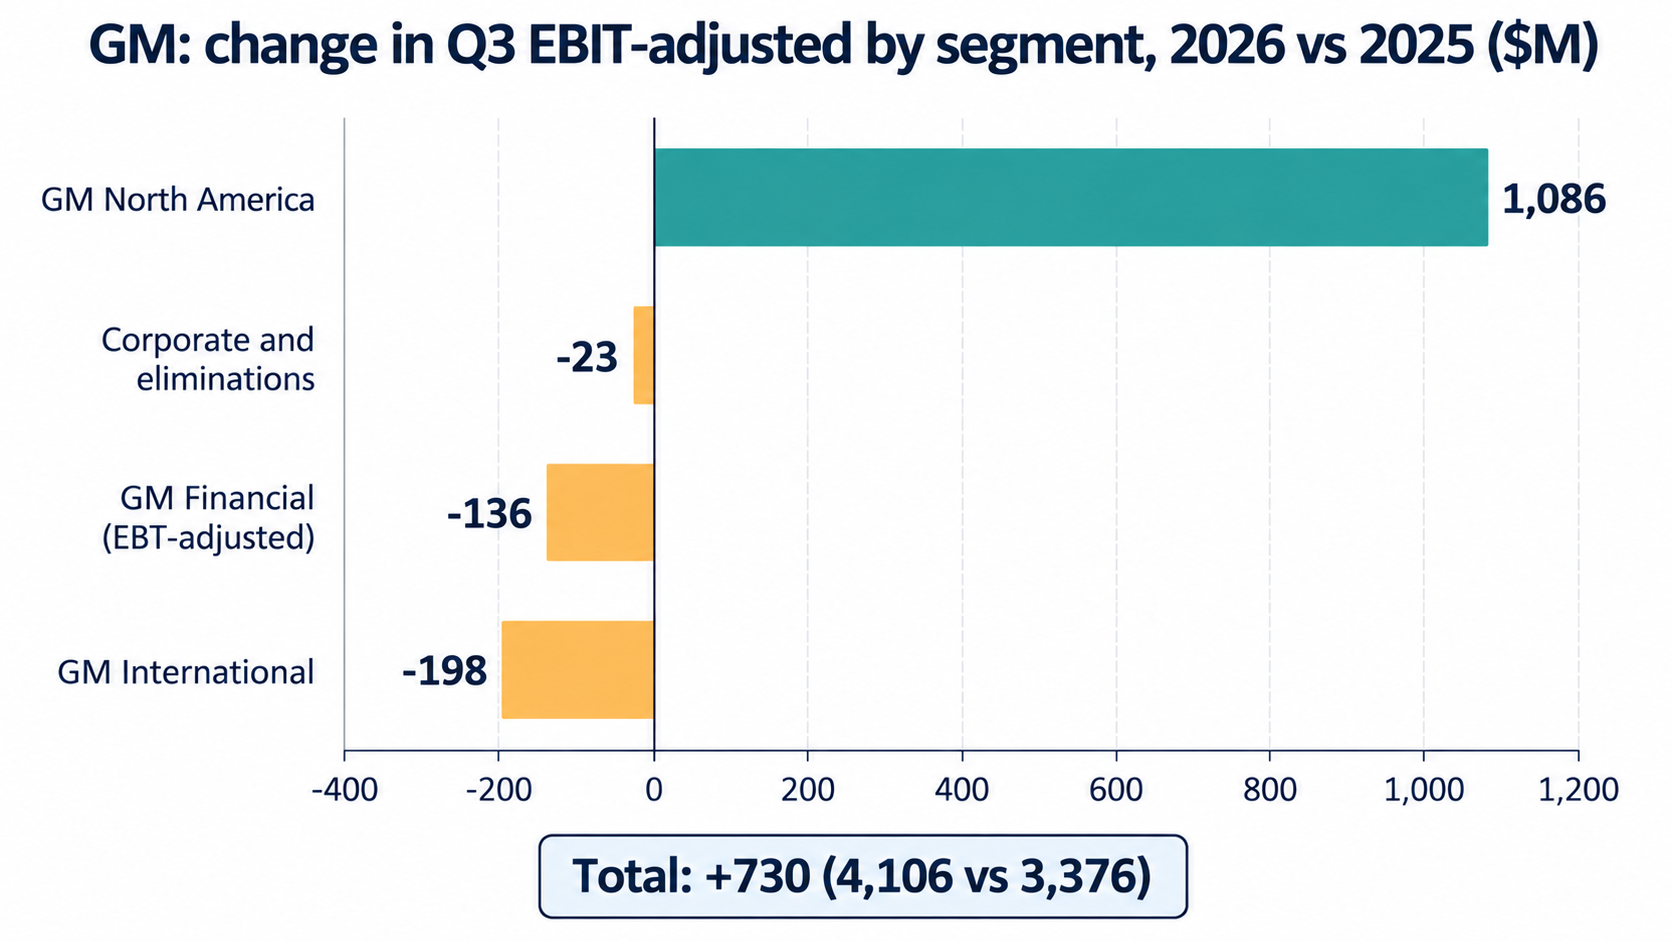
Change in Q3 EBIT-Adjusted by Segment, 2026 vs 2025 (Self-Made)
GM North America's margin rose to 8.7% from 6.2%, and its EBIT-adjusted was 87.5% of the total (derived). On the call, management said North American pricing is up $400M year to date, and that warranty costs improved by $600M in Q3, tracking toward the high end of a $1B to $1.5B full-year improvement.
The rest of the portfolio is weaker. GM International earned $28M against $226M; the call said excluding China it was breakeven, with a roughly $100M negative Momenta mark-to-market adjustment included. China equity income was $32M (-60%), though management called it an eighth straight profitable quarter. Volumes are soft outside wholesale: US sales were 671K (-5.5%) with market share of 16.1% vs 16.8%, China sales were 358K (-24%), and total sales in GM markets were 1,390K (-11%) (derived growth rates). Wholesale volume rose 5.2% to 1,028K, and GM North America wholesale rose 3.6% to 870K, but wholesale counts vehicles shipped to dealers and covers more than US retail, so the two are not like-for-like.
Fleet sales were 267K, 19.2% of the total against 16.7% a year earlier. Management targets 50 to 60 days of inventory at year end.
(d) = my arithmetic. Sources: GM Q3 2026 release; Investing.com call summary.
Forensic #3: A Third Of Adjusted EPS Growth Came From Fewer Shares
Adjusted EPS grew 32%, but about 10 points of that came from a smaller diluted share count, and adjusted figures exclude $3.6B of EV charges over nine months.
| EPS growth bridge, Q3 (d) | Value |
|---|---|
| Adjusted EPS growth | +32.1% ($3.70 vs $2.80) |
| Diluted share count change | -8.0% (887M vs 964M) |
| EPS growth from fewer shares alone | about +8.7% |
| EPS growth excluding the share count effect | about +21.6% |
| Points of the 32.1% from the share count | about 10.5 |
| EBIT-adjusted growth | +21.6% |
The share count effect and EBIT growth account for the whole increase, and the adjusted tax rate was flat (19.9% vs 19.8%). Shares outstanding were 849M at Sept 30, against 904M at the end of 2025, 995M at the end of 2024 and 1.2B at the end of 2023.
| EV strategic realignment excluded from adjusted results ($M) | Q3 2026 | Q3 2025 | 9M 2026 | 9M 2025 |
|---|---|---|---|---|
| Amount | 238 | 1,592 | 3,594 | 1,922 |
| As % of EBIT-adjusted (d) | 5.8% | 47.2% | 29.2% | 19.4% |
Nine-month EV charges of $3.6B are 29% of nine-month EBIT-adjusted, up from 19% (derived). GM's guidance also shows $3.7B of adjustments to EBIT for the full year, which is why the full-year GAAP EPS guide of $9.72 to $10.72 is $3.03 below the adjusted guide. The call said EV losses should fall by $1B to $1.5B in 2026, with a smaller benefit in 2027 and a larger improvement in 2028 to 2029 as new cell chemistry arrives.
The Q3 GAAP effective tax rate was 14.3% against 19.9% adjusted, which is why GAAP EPS of $3.73 is slightly above adjusted EPS of $3.70: the $0.27 per share of adjustments is roughly offset by a $0.06 tax effect and $0.23 of tax adjustments. The call guided Q4 tax to 25% to 27%, against a full-year rate of 20% to 21%.
(d) = my arithmetic. Sources: GM Q3 2026 release via Stock Titan; Investing.com call summary.
Forensic #4: Q4 Carries Cost And Volume Headwinds
Management listed specific Q4 and 2027 headwinds on the call: commodity and memory chip costs, a pickup changeover, a higher tax rate and a smaller regulatory benefit.
| Item | What management said |
|---|---|
| Commodity, logistics and DRAM costs | About $2B headwind for 2026, about $1.3B incurred so far, leaving about $0.7B for Q4 (d). If recent inflation is annualised, 2027 faces another $1B to $1.5B |
| Tariffs | About $1.8B incurred year to date net of IEEPA reversal benefits. Gross full-year cost expected at the low end of $2.5B to $3.5B. A $500M IEEPA credit is about 60% received; $600M to $800M expected including supplier refunds |
| Full-size pickup changeover | About 35,000 units of Q4 volume headwind |
| Onshoring and supply chain | $1B to $1.5B of investment this year |
| Regulatory benefit | Cut to about $500M from up to $750M (TIKR) |
| Q4 tax rate | 25% to 27%, against 14.3% in Q3 |
| Pricing | North America up $400M year to date; half-percent full-year tailwind with the rest in Q4. The CFO cautioned against using 2018 to 2019 pricing patterns for the new trucks |
CEO Mary Barra said on the call that GM expects to build roughly the same number of trucks in 2027 as in 2026, and that 2027 will be "better than 2026." GM will give 2027 guidance with Q4 results in early 2027 (TIKR).
(d) = my arithmetic. Sources: Investing.com call summary; TIKR.
The Buyback And Valuation Snapshot
At the Oct 20 close of $77.09, GM's market value is about $65.4B, and the new $20B authorization alone is about 31% of it.
| Measure | Value | Basis |
|---|---|---|
| Close, Oct 19 (before the report) | $82.75 | Investing.com, Money365 |
| Close, Oct 20 | $77.09, -6.84%, volume 3.6x the 20-day average | Money365 |
| Market value (d) | $65.4B | $77.09 times 849M shares outstanding |
| 52-week range (as of Oct 14, before the drop) | $56.81 to $91.85; now 16.1% below the high and 35.7% above the low (d) | Investing.com |
| FY2026 adjusted EPS guidance | $12.75 to $13.75; 5.6x to 6.0x at $77.09 (d) | GM release |
| Adjusted automotive free cash flow yield (d) | 17.6% to 19.1% | $11.5B to $12.5B over market value |
| Free cash flow yield without the $4.2B add-back (d) | 11.2% to 12.7% | $7.3B to $8.3B over market value |
| New buyback authorization (d) | $20B, 30.6% of market value; no expiry; can be suspended | GM release |
| Dividend | $0.18 a quarter; about 0.9% yield (d) | Payable Dec 17 to holders of Dec 4 |
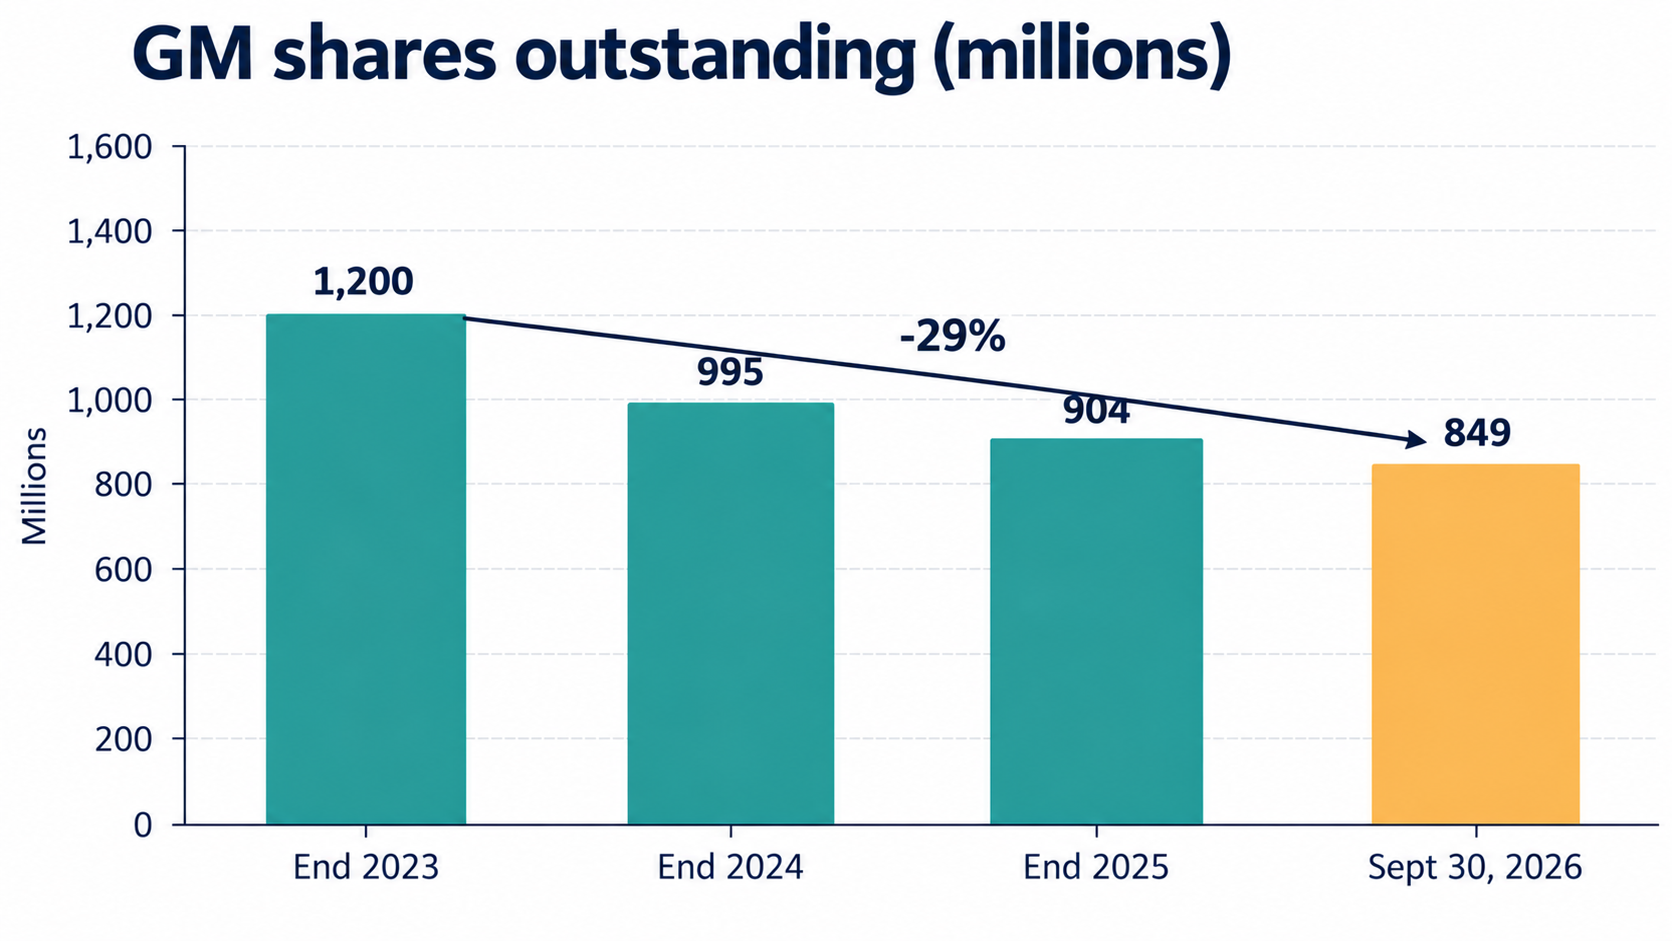
GM Shares Outstanding at Year End, 2023 to Sept 30, 2026 (Self-Made)
Buyback pace: GM completed its $6.0B program, repurchased $2.5B in Q3 to retire 29M shares (about $86 a share on average, derived), and bought another $1B in October. Nine-month cash spent on repurchases was $5,301M against $3,512M a year earlier, equal to 44% of adjusted free cash flow (derived). Management gave no timeline for the new $20B.
Two cautions on the multiples. The EPS guide is a full-year figure and excludes special items, and a low multiple can reflect the market pricing a cyclical peak. And the free cash flow yield depends on the add-back. A later quote on Stock Titan's page shows $75.92 and a $64.46B market value, but the page does not date it; update the price before publishing.
Third-party views, for context only: before the report, TIKR gave a mean analyst target of $104.17 (13 buy, 7 outperform, 4 hold, lowest target $75, as of Oct 16). Dan Ives of Yorkville Ives & Co. said investors wanted another raise and "got a narrowed range instead." Neither is independently verified here.
This article gives no price target. Any target depends on Q4 delivery, 2027 guidance, and whether EV add-backs fade as management expects.
(d) = my arithmetic. Sources: Money365; Investing.com; TIKR, Oct 19; Stock Titan; TIKR, Oct 20.
Risks: What Would Break The Thesis
Five items could make the Q3 beat harder to repeat.
| Risk | What the data shows |
|---|---|
| Q4 earnings step-down | Implied Q4 EBIT-adjusted $2.2B to $3.2B vs $4.1B in Q3 (d); implied Q4 adjusted EPS $1.78 to $2.78 vs $3.70 |
| Working capital reversal | Implied Q4 adjusted free cash flow of -$0.7B to +$0.3B; TIKR says payables are up about $5.8B since December (not confirmed in the release tables) |
| Cost inflation | About $2B of 2026 commodity, logistics and memory chip costs, plus a possible $1B to $1.5B more in 2027 |
| Weak non-North America profit | International $28M (-88%), GM Financial -17%, China equity income -60%, China sales -24% |
| EV charges and add-backs | $3.6B excluded over nine months; $7.4B total cash charges, $4.6B paid; about $1B expected in Q4 and the rest in 2027 |
(d) = my arithmetic. Sources: Investing.com call summary; TIKR; GM release via Stock Titan.
What To Watch Next
GM's Q4 report and 2027 guidance, expected in early 2027 (the sources I read do not give a date), will test most of these at once.
| Check | Where the data stands | The test |
|---|---|---|
| Q4 EBIT-adjusted | Implied $2.2B to $3.2B | Whether it lands at the top of the range ($3.2B) or the bottom ($2.2B) |
| Q4 free cash flow | Implied -$0.7B to +$0.3B | Whether Q3's working capital benefit reverses |
| 2027 guidance | Management says 2027 will be better than 2026; no figures given | Whether the EBIT-adjusted range sits above $15B despite $1B to $1.5B of extra cost inflation |
| EV add-backs | $4.3B in nine months vs $0.8B (d); about $1B of cash charges due in Q4 | Whether the gap between adjusted and unadjusted free cash flow narrows in 2027 |
| Buyback pace | $2.5B in Q3 and $1B in October; $20B authorization | Quarterly share count against 849M |
| Non-North America profit | GM International $28M; China equity income $32M | Whether these recover or keep shrinking |
| Industry costs | Ford reports on Oct 28 (per TIKR) | Whether the same commodity and memory chip pressures appear in its results |
Also worth tracking: GM's Form 10-Q for the quarter, which should itemise the free cash flow adjustments, the working capital movements and the tariff accounting that the press release summarises.
Sources And Data Notes
Financial statement figures come from GM's Q3 2026 results release, read through two copies of it (a newswire copy and Stock Titan's tables), which agree with each other. GM reports on a calendar year, so Q3 2026 is the three months ended September 30, 2026. The results and call were on Oct 20, 2026; prices are as of the Oct 20 close and may have moved.
Primary source
- GM releases 2026 third-quarter results and updates full-year 2026 guidance, Oct 20, 2026
- GM Q3 2026 release tables via Stock Titan
Secondary sources
- Investing.com call summary, Oct 20: tariffs, cost headwinds, Q4 items, buyback pacing, quotes
- TIKR, Oct 21 and TIKR, Oct 20: consensus, regulatory benefit, payables, Q4 2025 comparison, analyst comment
- Money365: Oct 19 and Oct 20 closes
- Investing.com: 52-week range
- TIKR, Oct 19: analyst targets
Marked, not independently confirmed
- Call commentary (tariffs, commodity costs, Q4 headwinds, EV cash charges, pricing, warranty) comes from a call summary, not from the filed release.
- The $5.8B payables increase, the $500M regulatory benefit, the Q4 2025 EBIT-adjusted of about $2.8B and the analyst data are from TIKR.
Where sources disagree
- Guidance midpoint: TIKR says both profit midpoints are unchanged; the release's ranges show the EPS midpoint moving from $13.00 to $13.25. I use the release.
- Adjusted EPS consensus: $3.57 (TIKR), $3.69 (Investing.com) and $3.74 (Money365). Revenue consensus: $48.5B to $48.8B.
- Oct 20 intraday low: TIKR reports about -8.3% at $75.79 during the session, and Stock Titan reports a -12.9% trough. The close of $77.09 (-6.84%) is consistent across two sources.
Left out
- I did not open the Form 10-Q, so free cash flow add-backs, working capital and tariff accounting are not confirmed from the filing.
Derived figures are my arithmetic from the release and are marked (d), "derived" or "my arithmetic".

Sandeep Gupta
Independent equity research analyst publishing forensic theses on US-listed stocks. MBA, Politecnico di Milano School of Management (Milan, Italy).
Get new research in your inbox
Subscribe to receive forensic equity research the moment it's published. Free, no spam.
Related Research
 HON
Honeywell (HON): Adjusted EPS Up 34%, GAAP EPS Down 20%, And Operating Cash Flow Down 74%
 GE
GE Aerospace (GE): Orders Up 49% And Adjusted EPS Up 36%, But Free Cash Flow Fell 14% And The Guide Implies A Softer Q4
 LMT
Lockheed Martin (LMT): Backlog Up 51% To $292B On A Missile Award, But F-35 Deliveries Fell And Free Cash Flow Slipped 10%
Latest earnings releases: GM
— GM releases 2026 third-quarter results and updates full-year 2026 guidance
Discussion
Be the first to comment.