
Investment Thesis
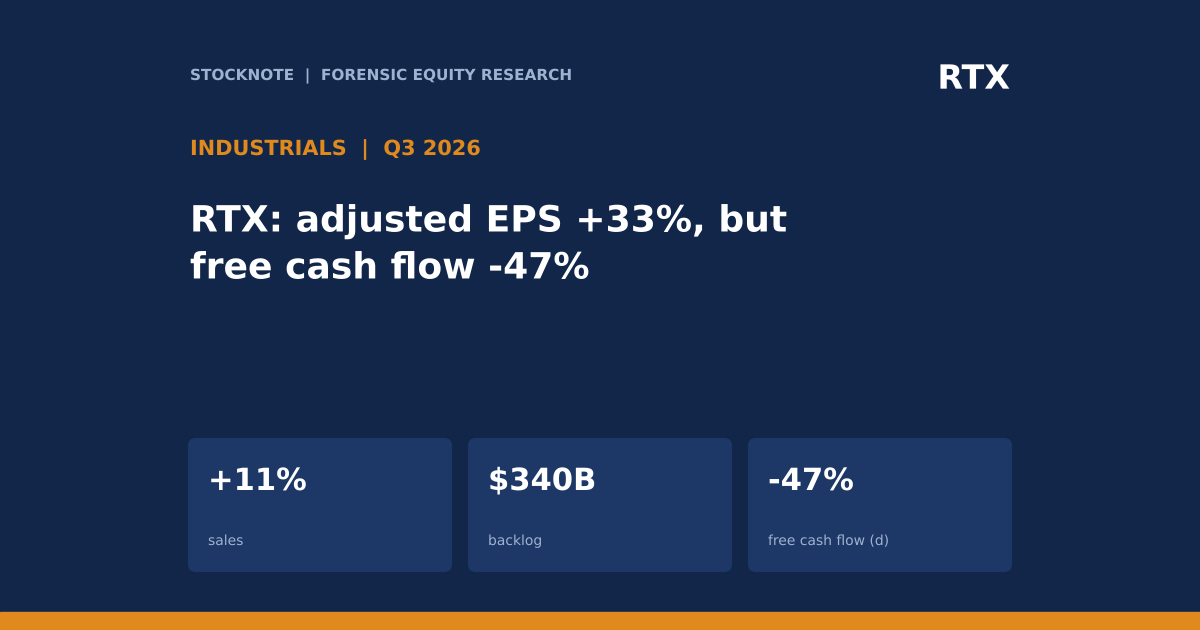
RTX reported Q3 2026 sales of $24,965M (+11%, +12% organic) and adjusted EPS of $2.26 against $1.70. The headline is strong, and the margin gains at Collins Aerospace and Pratt & Whitney are large. Two details change how to read it: $0.25 of adjusted EPS came from IEEPA cost recovery, and free cash flow fell from $4,025M to $2,119M.
- Sales and EPS. Sales $24,965M vs $22,478M (+11.1% (d)); GAAP EPS $1.89 vs $1.41; adjusted EPS $2.26 vs $1.70, including $0.25 from IEEPA cost recovery.
- Margins. Adjusted segment margin 15.2% vs 12.1% (d), with Collins at 21.3% (15.7%), Raytheon at 14.1% (12.2%) and Pratt & Whitney at 10.5% (8.9%).
- Cash. Operating cash flow $2,868M (-38% (d)), capex $749M (+22% (d)), free cash flow $2,119M (-47% (d)).
- Backlog. $340B ($176B commercial, $164B defense), about 3.5 years (d) of the midpoint of 2026 adjusted sales guidance.
- Outlook. 2026 adjusted EPS raised to $7.65 to $7.75 (from $7.10 to $7.25) and free cash flow to $9.0B to $9.2B (from $8.50B to $8.75B).
- This article contains no rating, price target or investment advice. Derived figures are marked (d).
Bottom line. Without the $0.25 recovery, adjusted EPS would have been about $2.01 (+18% (d)), still a strong quarter. The open question is not profit but cash: the release extract does not explain the drop in operating cash flow, so the cash flow statement is the place to look for working capital or timing effects.
Source: RTX Q3 2026 earnings release.
Q3 2026 At A Glance
| Measure | Q3 2026 | Q3 2025 | Change |
|---|---|---|---|
| Sales | $24,965M | $22,478M | +11.1% (d) |
| GAAP EPS | $1.89 | $1.41 | +34% (d) |
| Adjusted EPS | $2.26 | $1.70 | +33% |
| Operating cash flow | $2,868M | $4,639M | -38% (d) |
| Free cash flow | $2,119M | $4,025M | -47% (d) |
| Backlog | $340B | Not in extract | Commercial $176B, defense $164B |
| Share repurchases | $0 | $0 | No repurchases in the first nine months of 2026 |
Source: RTX Q3 2026 earnings release.
What The Market Believes vs. What The Data Actually Shows
| Belief | What the data show |
|---|---|
| Adjusted EPS +33% is all operating strength | $0.25 of the $2.26 came from IEEPA cost recovery. Without it, EPS is about $2.01, up 18% (d). |
| Margin expansion is broad | All three segments improved, but Collins accounts for the most: its adjusted profit rose 78% of its incremental sales (d). |
| Earnings growth turns into cash | Free cash flow fell 47% (d) while adjusted EPS rose 33%. |
| The backlog guarantees growth | Backlog of $340B is 3.5 years of guided 2026 sales (d); about 52% (d) is commercial and tied to airline and engine-fleet activity. |
| Capital return is a catalyst | RTX repurchased no shares in Q3 or the first nine months of 2026. |
Forensic #1: Segment Margins And Incremental Margin
Operating leverage is the idea that when revenue rises and part of the cost base is fixed, profit grows faster than sales. Incremental margin, the change in profit divided by the change in sales, is the cleanest test. If it is well above the starting margin, costs are being absorbed or recovered; if it is below, growth is being bought with lower-margin work.
| Segment | Sales change | Adjusted profit change | Incremental margin (d) |
|---|---|---|---|
| Collins | $761M | $594M | 78% |
| Pratt & Whitney | $808M | $217M | 27% |
| Raytheon | $986M | $275M | 28% |
| Total segments (d) | $2,555M | $1,086M | 43% |
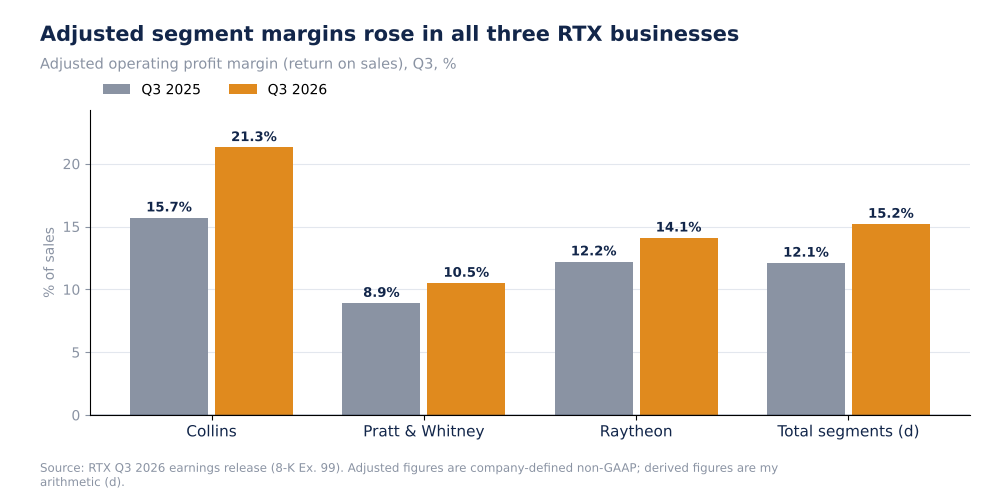
RTX adjusted segment margins, Q3 2025 vs Q3 2026
Across the three segments, adjusted profit rose $1,086M on $2,555M of added sales, an incremental margin of 43% (d) against a starting margin of 12.1% (d). Collins is the outlier at 78% (d), a figure that is too high to come from volume alone. The extract does not allocate the IEEPA recovery across segments, so some of that margin may be recovery and not run-rate profit.
Why it matters. A margin step of this size is only repeatable if it comes from pricing, mix and productivity. If part of it is a one-time recovery, the base for next year is lower than the Q3 margin implies.
Source: RTX Q3 2026 earnings release (8-K Ex. 99). Adjusted figures are company-defined non-GAAP; derived figures are my arithmetic (d). Segment sums exclude eliminations and corporate items (d).
Forensic #2: GAAP, Adjusted And The IEEPA Recovery
| Diluted EPS | Q3 2025 | Q3 2026 | Change |
|---|---|---|---|
| GAAP | $1.41 | $1.89 | +34% (d) |
| Adjusted | $1.70 | $2.26 | +33% |
| Adjusted excluding $0.25 recovery (d) | $1.70 | $2.01 | +18% |
| Gap, adjusted minus GAAP (d) | $0.29 | $0.37 | +$0.08 |
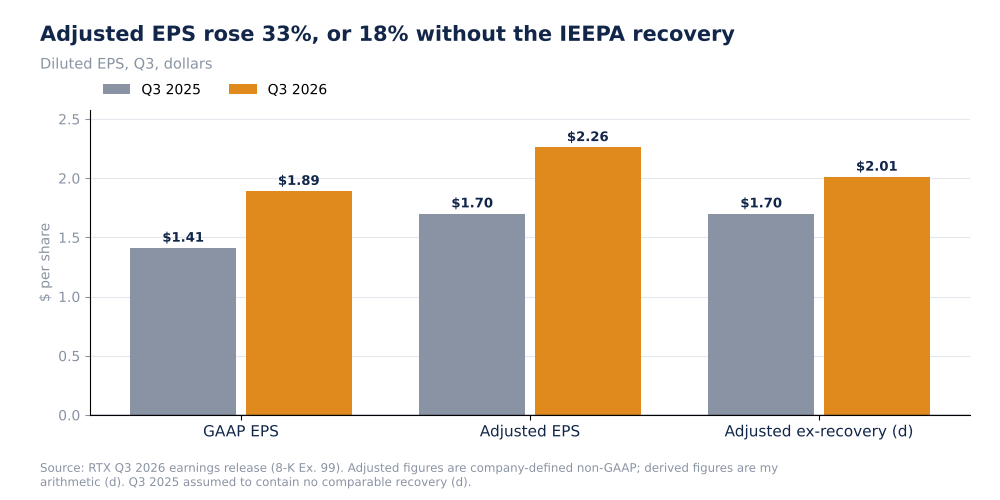
RTX GAAP and adjusted EPS, with the IEEPA recovery removed (d)
The adjusted-minus-GAAP gap widened from $0.29 to $0.37 (d), so excluded items grew slightly. The more important adjustment is inside the adjusted number: a $0.25 recovery that I would treat as non-recurring unless RTX says otherwise. I take IEEPA to refer to tariffs under the International Emergency Economic Powers Act, but the extract does not describe the item, so the nature of the recovery should be confirmed in the filing. Pratt & Whitney illustrates the adjustment gap: its reported operating profit was $608M against $968M adjusted (a $360M (d) difference), compared with $751M on both bases a year earlier.
Why it matters. The growth rate investors should extrapolate is the one without the recovery, +18% (d), not +33%.
Source: RTX Q3 2026 earnings release (8-K Ex. 99). Adjusted figures are company-defined non-GAAP; derived figures are my arithmetic (d).
Forensic #3: Cash Conversion
| $ millions | Q3 2025 | Q3 2026 | Change (d) |
|---|---|---|---|
| Operating cash flow | 4,639 | 2,868 | -38% |
| Capital expenditures | 614 | 749 | +22% |
| Free cash flow | 4,025 | 2,119 | -47% |
| Free cash flow / operating cash flow | 87% | 74% | n/a |
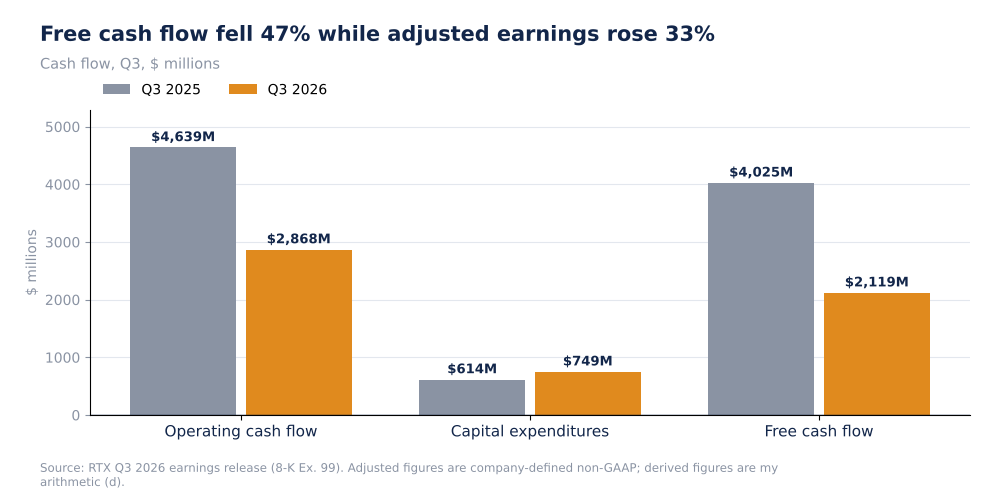
RTX operating cash flow, capex and free cash flow, Q3
A drop of $1,771M (d) in operating cash flow with higher earnings points to a working-capital or timing effect, because profit and cash can diverge sharply in long-cycle businesses (advance payments, inventory build, contract assets). One quarter does not establish a trend: the full-year free cash flow guidance of $9.0B to $9.2B was raised, which the company would not do if it expected the Q3 weakness to persist. The nine-month cash flow was not in my extract, so I cannot compute what Q4 needs to deliver.
Why it matters. Cash is what funds dividends, debt reduction and future repurchases. A raised guide alongside a weak quarter shifts the test to Q4.
Source: RTX Q3 2026 earnings release (8-K Ex. 99). Adjusted figures are company-defined non-GAAP; derived figures are my arithmetic (d).
Forensic #4: Backlog And The Guidance Raise
| 2026 guidance | Prior | Current | Midpoint change (d) |
|---|---|---|---|
| Adjusted sales | $95.0B to $96.0B | $97.0B to $97.5B | +$1.75B |
| Organic sales growth | 8% to 9% | 10% to 11% | +2 points |
| Adjusted EPS | $7.10 to $7.25 | $7.65 to $7.75 | +$0.53 (+7.3%) |
| Free cash flow | $8.50B to $8.75B | $9.0B to $9.2B | +$0.47B (+5.5%) |
The EPS raise is about four times as large in percentage terms as the sales raise, which is consistent with the margin step in Forensic #1 and probably with the $0.25 recovery as well. Backlog is split $176B commercial and $164B defense, so 52% (d) of the order book depends on commercial aerospace demand and aftermarket activity.
Why it matters. A guidance raise that is mostly margin and recovery is a different quality of upgrade from one driven by volume.
Source: RTX Q3 2026 earnings release (8-K Ex. 99). Adjusted figures are company-defined non-GAAP; derived figures are my arithmetic (d).
Valuation Snapshot
My source has no share price, so I cannot calculate earnings or cash flow multiples. The operating measures that define the setup are below.
| Measure | Latest |
|---|---|
| Backlog / guided 2026 adjusted sales | 3.5x (d) |
| Adjusted segment margin, Q3 | 15.2% (d) |
| Adjusted EPS excluding recovery, Q3 | $2.01 (d) |
| 2026 free cash flow guide | $9.0B to $9.2B |
| Q3 free cash flow | $2,119M (-47% y/y (d)) |
What has to be true. The Q3 margin level must hold without the recovery, and cash conversion must recover enough in Q4 to meet the raised full-year guide.
Risks: What Would Break The Thesis
- One-time recovery. The $0.25 may not repeat.
- Cash timing. The Q3 cash shortfall could be structural, not timing.
- Commercial exposure. 52% (d) of backlog depends on commercial aerospace.
- Unallocated recovery. Segment margins may include part of it.
- Data limits. No nine-month cash flow, share price or net income figure in the extract.
The reading would be wrong if the filing shows that the cash drop was a one-off and that the recovery was small within segment margins.
What To Watch Next
- Operating cash flow and free cash flow in Q4 against the $9.0B to $9.2B guide.
- Whether IEEPA recoveries are described as recurring.
- Collins and Pratt & Whitney adjusted margins against 21.3% and 10.5%.
- Reported-to-adjusted operating profit gap at Pratt & Whitney (about $360M in Q3 (d)).
- Commercial backlog of $176B against defense backlog of $164B.
- Any resumption of share repurchases.

Sandeep Gupta
Independent equity research analyst publishing forensic theses on US-listed stocks. MBA, Politecnico di Milano School of Management (Milan, Italy).
Get new research in your inbox
Subscribe to receive forensic equity research the moment it's published. Free, no spam.
Discussion
Be the first to comment.