
Investment Thesis
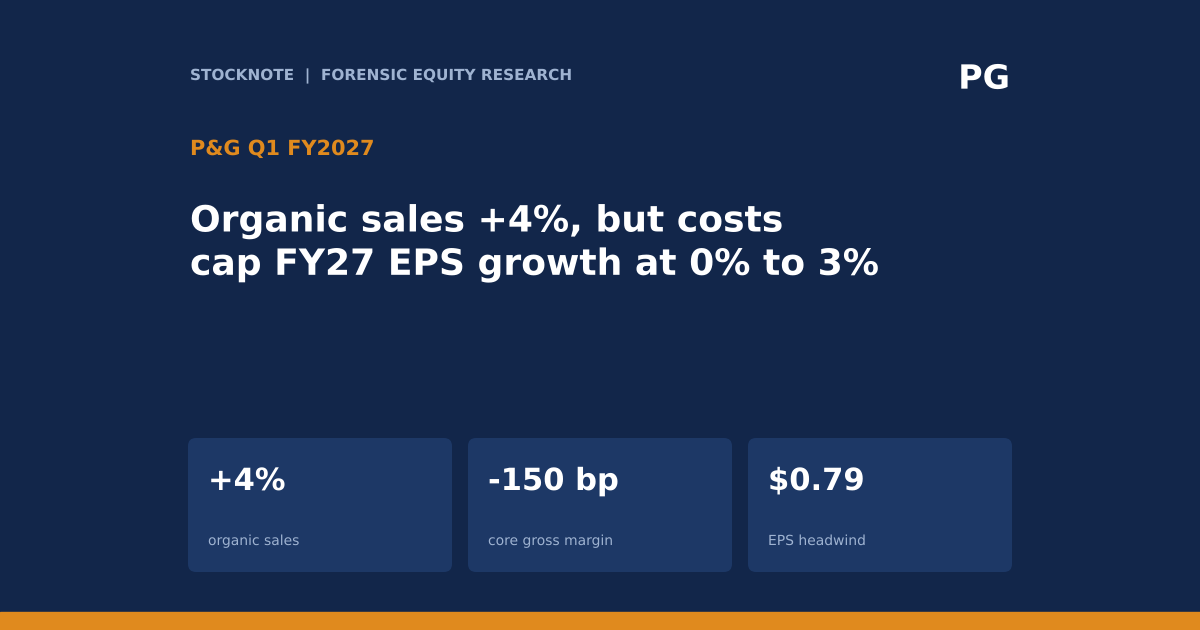
Procter & Gamble reported organic sales growth of 4.0% in its fiscal first quarter of 2027 (the quarter to September 2026), driven by 2.4 points of volume, 0.4 points of price and about a point of mix. Core gross margin fell 150 basis points and core operating margin fell 80 basis points, and management kept its full-year guide at organic growth of 1% to 3% and core EPS growth of 0% to 3%. It also raised its estimate of cost and currency headwinds to $0.79 a share, from $0.56 in July. The company is delivering growth with little price, and the arithmetic of the guide shows how much of the underlying growth is being absorbed by costs.
- Sales. Organic sales +4.0%: volume +2.4 points, price +0.4 points, mix about +1 point (d). All 10 categories grew.
- Margins. Core gross margin -150 basis points, core operating margin -80 basis points (-90 constant currency), against productivity savings of 250 basis points.
- Earnings and cash. Core EPS about $2, up 1 point (the figure is cut off in the transcript). Free cash flow productivity 93%. Cash returned $3.9B ($2.6B dividends, $1.3B buybacks).
- Regions. Greater China +8%, IMEA +8%, Europe +4%, Latin America +4%, North America +3% (volume +3 points), APAC Enterprise +2%.
- Costs. Q1 commodity headwind about 5% year over year. FY27 commodity, energy and freight headwind about $1.4B after tax (8% of earnings), assuming Brent at $100 a barrel.
- Combined headwind. About $1.9B after tax, or $0.79 a share (11% of FY26 core EPS), up from $0.56 (8%) in July.
- FY27 guide (maintained). Organic sales +1% to +3% (first half about +3%), core EPS $6.89 to $7.11 (0% to +3%), free cash flow productivity 85% to 90%, shareowner returns of about $15B.
- This article contains no price target or rating. The source is a machine-generated transcript with some garbled currency symbols; I use only figures that are internally consistent.
Bottom line. The quarter is healthy on the top line and strained on margin. The best way to see the squeeze is the guide: with $0.79 a share of headwinds, core EPS growth of 0% to 3% implies underlying growth before those costs of about 13% (d). That is a strong business absorbing a large external cost wave, and the question is how long the cost wave lasts, because the headwind is tied to an assumption of Brent at $100 a barrel.
Source: P&G Q1 fiscal 2027 earnings call transcript, Bullfincher, Oct 22, 2026.
Q1 FY2027 At A Glance
| Metric (Q1 FY2027) | Result | Detail |
|---|---|---|
| Organic sales growth | +4.0% | volume +2.4, price +0.4, mix about +1 (d) |
| Core gross margin | -150 bp | productivity of 250 bp did not offset it |
| Core operating margin | -80 bp | -90 bp at constant currency |
| Core EPS | about $2 | up 1 point; exact figure cut off |
| Free cash flow productivity | 93% | n/a |
| Cash returned | $3.9B | $2.6B dividends, $1.3B buybacks |
| Commodity headwind, Q1 | about 5% | year over year |
| Market share | flat globally | 29 of top 50 category-country pairs held or grew share |
| Tariff refund (IEEPA), second part | about $90M | received in Q1 |
Source: P&G Q1 FY2027 call transcript. I did not read the final part of the transcript (the end of the Q&A).
What The Market Believes vs. What The Data Actually Shows
| Belief | What the call shows |
|---|---|
| P&G grows through pricing | Price added only 0.4 points. Volume added 2.4 points and mix about 1. |
| Productivity protects margin | Productivity improved 250 bp, yet core gross margin still fell 150 bp and core operating margin 80 bp. |
| The cost outlook is stabilising | The FY27 combined headwind was raised to $0.79 a share from $0.56 in July, and it assumes Brent at $100. |
| Guide of 0% to 3% EPS growth means a weak business | Before the headwinds the guide implies underlying growth of about 13% (d). |
| Share is being lost to private label | Global share was flat, 29 of the top 50 category-country combinations held or grew share (from 25), and over 70% of top U.S. customers held or grew share. |
The common summary of a staples company with slow growth misses that P&G's volume growth of 2.4% is positive in a year of low pricing, and that the guide is constrained by costs, not by demand. The guide on organic growth, however, is only 1% to 3% for the year, so the cost wave is not the only factor.
Forensic #1: Growth Came From Volume And Mix, Not Price
| Component of organic growth | Q1 FY2027 |
|---|---|
| Volume | +2.4 points |
| Price | +0.4 points |
| Mix | about +1 point (d) |
| Total organic | +4.0% |
| Categories growing | all 10 |
| Share, global aggregate | flat |
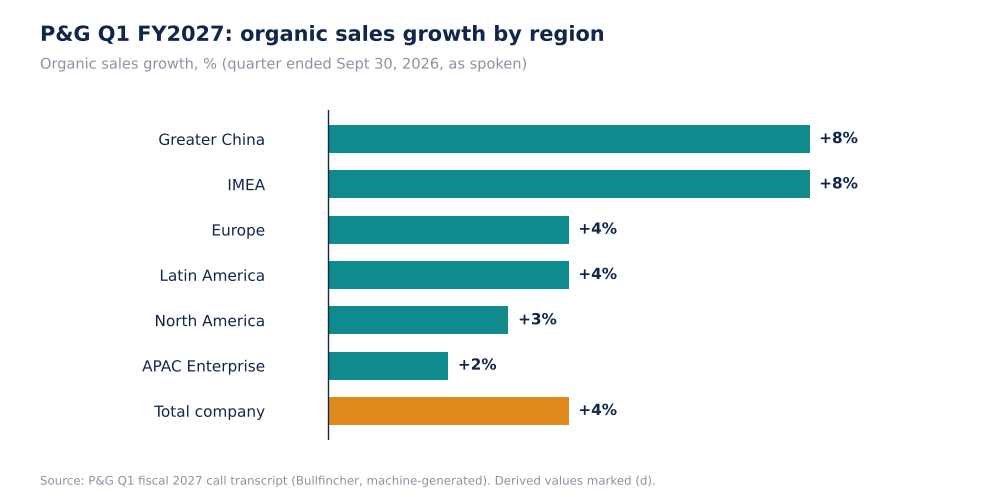
P&G Q1 FY2027 Organic Sales Growth By Region, % (Self-Made)
Volume-led growth with flat share means the categories themselves are growing, which is a different signal from share gains. North America, the largest market, grew 3% with volume up 3 points and a U.S. market growth of 3%, so P&G is growing in line with its market there. The fastest regions are Greater China (+8%, with SK-II +12% and Pampers close to +50%) and IMEA (+8%), though each is a single quarter.
Why it matters. With price at 0.4 points and commodity costs up about 5%, the company cannot recover cost inflation through price in this quarter, which is why margin is the pressure point.
Source: P&G Q1 FY2027 call transcript. Mix is derived as total organic less volume and price.
Forensic #2: Margins Fell Despite 250 Basis Points Of Productivity
| Item | Q1 FY2027 |
|---|---|
| Productivity improvement | +250 bp |
| Core gross margin | -150 bp |
| Core operating margin | -80 bp (-90 bp constant currency) |
| Commodity headwind, year over year | about 5% |
| Implied cost and other drag on gross margin (d) | about 400 bp (250 bp productivity plus 150 bp decline) |
| Tariff refund, second part | about $90M |
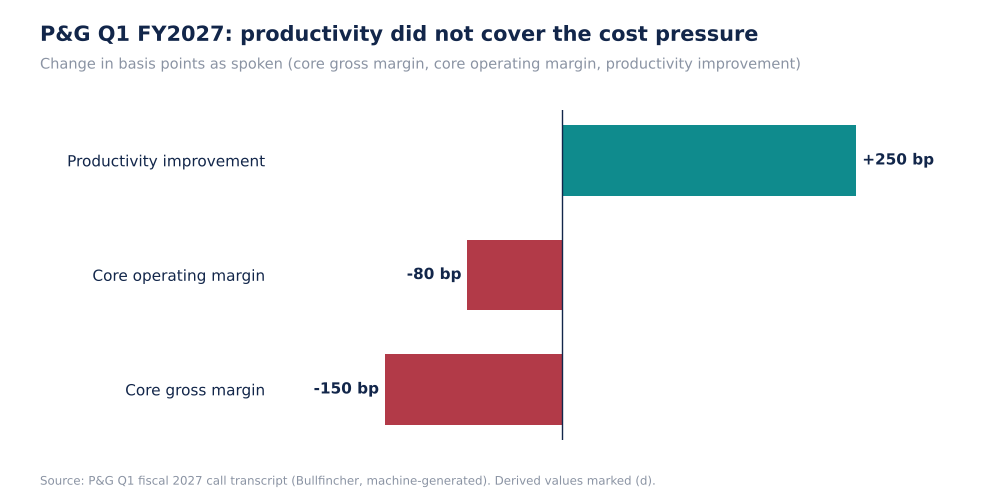
P&G Q1 FY2027 Margin Changes, Basis Points (Self-Made)
If productivity added 250 basis points and gross margin still fell 150, other factors removed about 400 basis points (d), mainly commodity costs, and perhaps mix, currency and other costs; the transcript does not break this down. Core operating margin fell only 80 basis points, so overhead and advertising leverage recovered about 70 basis points of the gross margin decline (d). The tariff refund of about $90M, the second part of an IEEPA refund, is a one-time benefit; if it sits inside core results, which the transcript does not confirm, the underlying margin trend is slightly worse than reported.
Why it matters. Productivity programmes are meant to fund price cuts, innovation and margin. When they are absorbed entirely by input costs, none of the savings reaches shareholders. An investor should watch whether gross margin stabilises as the commodity headwind eases or deepens if Brent stays at $100.
Source: P&G Q1 FY2027 call transcript. The 400 basis point figure is derived arithmetic, not a stated number.
Forensic #3: The FY27 EPS Guide Hides Strong Underlying Growth
| Item | Figure |
|---|---|
| FY27 core EPS guide | $6.89 to $7.11 (0% to +3%) |
| Combined headwinds (cost, FX, below-the-line) | about $1.9B after tax, or $0.79 a share |
| Headwind as share of FY26 core EPS | 11% (8% in July) |
| Of which commodity, energy and freight | about $1.4B after tax (8% of earnings) |
| FX headwind | about $50M after tax |
| Higher net interest expense | about $300M after tax |
| Lower non-operating income | about $150M after tax |
| Underlying growth before headwinds at midpoint (d) | about $0.90 a share, or about 13% |
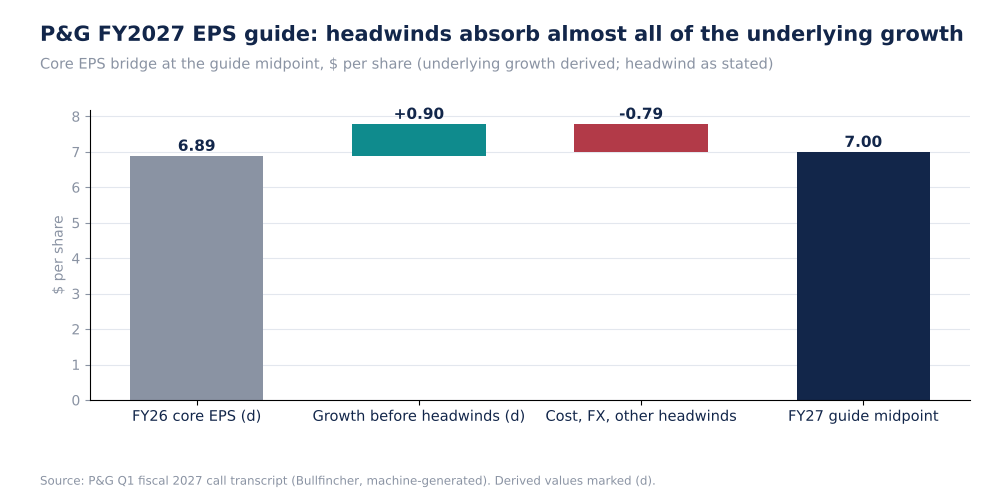
P&G FY27 Core EPS Bridge At The Guide Midpoint, $ Per Share (Self-Made)
The bridge treats the full $0.79 as an offset inside the guide, so the underlying growth is an illustration, not a forecast. The lower base of the guide range, $6.89, equals FY26 core EPS if growth is 0%. The headwinds are about 3.6 times the largest guided EPS increase of $0.22 (d, $7.11 less $6.89). Interest expense, FX and lower non-operating income together account for about $500M after tax (d), roughly a quarter of the $1.9B, which is not tied to Brent.
Why it matters. The guide is more sensitive to oil than a 0% to 3% range suggests: the commodity portion is assumed at Brent of $100 a barrel, so a lower oil price would lift EPS and a higher one would cut it. The $0.23 increase in the headwind since July, from $0.56 to $0.79, was larger than the whole upside of the EPS range.
Source: P&G Q1 FY2027 call transcript. Several currency symbols in the transcript are garbled; the amounts are consistent with U.S. dollars.
Forensic #4: Cash Returns And The Slower Second Half
| Item | Figure |
|---|---|
| Q1 cash returned | $3.9B ($2.6B dividends, $1.3B buybacks) |
| FY27 shareowner returns guide | about $15B (over $10B dividends, about $5B buybacks) |
| Free cash flow productivity: Q1 / FY27 guide | 93% / 85% to 90% |
| Capital spending guide | 4.5% to 5.5% of sales |
| Organic sales guide: FY27 / first half | 1% to 3% / about 3% |
| Implied second-half organic growth at midpoint (d) | about 1% |
| Product and market exits | 30 to 50 bp headwind to organic growth |
The first-half guide of about 3% organic growth against a full-year midpoint of 2% implies roughly 1% in the second half (d). That is a slowdown from 4.0% in Q1, partly from exits of products and markets that take away 30 to 50 basis points. Q1 buybacks of $1.3B are on pace with the $5B annual plan, since four times $1.3B is $5.2B (d). Annual returns of $15B equal about 4.0% of the TradingView market cap (d).
Why it matters. The dividend and buyback plan is stable, and the cash conversion guide of 85% to 90% is below Q1's 93%, which may reflect caution on working capital or spending, though the call extract does not say. The second-half slowdown is the key assumption for revenue, since it is sharper than the Q1 trend.
Source: P&G Q1 FY2027 call transcript.
Valuation Snapshot
TradingView shows Procter & Gamble at $161.57 with a market cap of $372.21B and a year-to-date gain of 12.90%. The page gives two different day changes (0.61% and 1.47%), so I do not use them. The all-time high shown is $180.43 on Nov 27, 2024.
| Measure | Figure |
|---|---|
| Share price (TradingView) | $161.57 |
| Market cap (TradingView) | $372.21B |
| Price vs all-time high (d) | about -10% |
| Price / FY27 core EPS guide midpoint ($7.00) (d) | about 23.1 times |
| FY27 shareowner returns of about $15B / market cap (d) | about 4.0% |
| FY27 dividends of over $10B / market cap (d) | about 2.7% |
A multiple of 23 times guided earnings is a premium for a business guiding to low single-digit organic growth and flat EPS growth at the midpoint, and it relies on the headwinds being temporary.
What has to be true. At about 23 times FY27 guided EPS, the price assumes that the $0.79 headwind fades and EPS growth returns toward the underlying 13% (d) in later years. If Brent stays at $100 and commodity costs keep rising, the guide has little room for error, while a fall in oil would lift earnings directly.
Risks: What Would Break The Thesis
- Costs. The headwind rose from $0.56 to $0.79 in one quarter, and it is tied to an oil price assumption.
- Pricing power. Price added only 0.4 points, so inflation is not being passed through.
- Second-half slowdown. The guide implies about 1% organic growth in the second half.
- Margin. Core gross margin fell 150 bp despite 250 bp of productivity.
- Valuation. About 23 times guided EPS for flat-to-3% growth.
- Data limits. The transcript is machine-generated, the core EPS figure is cut off, and I did not read the end of the Q&A.
The risks are about cost and the timing of recovery, not about demand, where all 10 categories grew and share held. That is an uncommon position for a risk list, and it is why the debate is about how long the squeeze lasts.
What To Watch Next
- Core gross margin against -150 bp, and whether productivity of 250 bp continues.
- The combined headwind against $0.79 a share, and the oil price assumption of $100 a barrel.
- Price contribution against 0.4 points, and any new pricing announcements.
- Organic growth against the guided first-half rate of about 3%.
- Greater China growth after +8% and Pampers near +50%.
- Free cash flow productivity against the 85% to 90% guide.

Sandeep Gupta
Independent equity research analyst publishing forensic theses on US-listed stocks. MBA, Politecnico di Milano School of Management (Milan, Italy).
Get new research in your inbox
Subscribe to receive forensic equity research the moment it's published. Free, no spam.
Related Research
 KO
Coca-Cola (KO): Organic Revenue Up 7% On Volume, With Price/Mix At 1% And An 8-Point 2027 Headwind
 GIS
General Mills Beat Estimates By 16% But The Market Saw Only The Impairment — The $3B Cost Program Is Being Ignored (GIS)
 KHC
Discussion
Be the first to comment.