
Investment Thesis
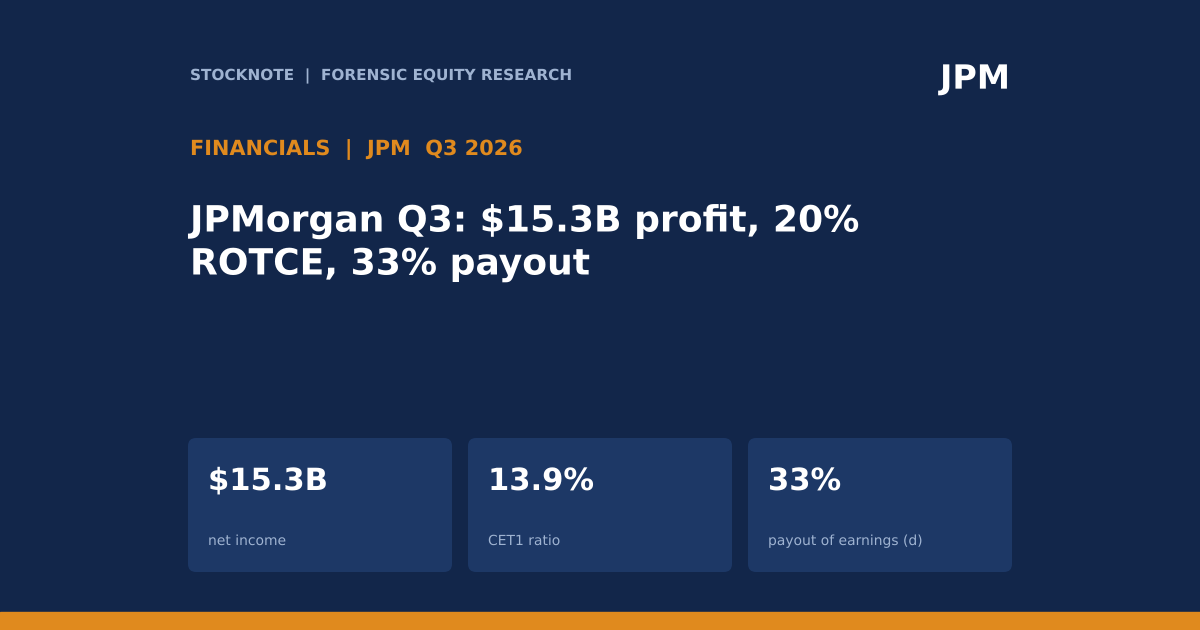
JPMorgan Chase reported third-quarter 2026 net income of $15.3 billion ($5.57 per share; $5.75 excluding $658 million of pre-tax securities losses), on reported revenue of $50.2 billion, with a 20% return on tangible common equity (21% excluding the losses). With the 10-year Treasury yield at 5.02% and the Fed funds range at 3.75% to 4.00%, the quarter is a useful case study of how a large bank earns money in a high-rate economy and what it keeps. This article decomposes the quarter into net interest income, fee and markets revenue, expenses, credit costs and capital return, and compares them with the guidance for 2026 and 2027.
- Revenue. Reported net revenue $50.172B; managed $50.907B. Net interest income (NII) $27.1B, of which $24.7B excluding Markets; noninterest revenue $23.8B, of which $15.9B excluding Markets.
- Expenses and credit. Noninterest expense $27.295B (overhead ratio 54%). Provision for credit losses $2.743B: net charge-offs $2.2B (down $389M year over year) plus a $539M reserve build.
- Returns and capital. ROTCE 20%, ROE 17%. CET1 ratio 13.9% (Standardized), 14.1% (Advanced). Net common repurchases $664M; common dividends $4.4B ($1.65 per share).
- Segments. Net income: Commercial & Investment Bank $8.247B; Consumer & Community Banking $5.670B; Asset & Wealth Management $1.843B; Corporate -$0.455B.
- Growth. Average loans $1.6T (+10% y/y, +2% q/q); average deposits +8% y/y.
- Outlook. Implied 2026 NII about $106.2B ($78.2B year to date plus about $28B in Q4); excluding Markets about $97.2B. Card net charge-off outlook about 3.2%.
- This article contains no rating, price target or investment advice. Every figure comes from a named source and anything I calculated is marked (d).
Bottom line. The earnings engine is balanced between interest income that depends on rates and balance-sheet growth (53% of managed revenue, d) and fee and markets revenue (47%, d). Credit costs are modest (the provision is 5.5% of reported revenue, d) and the capital ratio is high enough that the bank returned only a third of its earnings to shareholders (33%, d) in the quarter while loans grew 10%. The bank is holding capital to fund growth and absorb a possible downturn. For investors the questions are how NII evolves when the Fed and the 10-year yield move, and whether credit costs stay near 3.2% in cards.
Sources: JPMorgan Q3 2026 earnings release (narrative); JPMorgan Q3 2026 earnings presentation. Derived items are marked (d).
Q3 2026 At A Glance
| Metric | Q3 2026 |
|---|---|
| Net income | $15,305M |
| EPS (reported / excluding securities losses) | $5.57 / $5.75 |
| Net revenue (reported / managed) | $50,172M / $50,907M |
| Net interest income (managed) | $27.1B ($24.7B ex-Markets) |
| Noninterest revenue (managed) | $23.8B ($15.9B ex-Markets) |
| Noninterest expense | $27,295M |
| Provision for credit losses | $2,743M |
| ROTCE / ROE | 20% / 17% |
| CET1 ratio (Standardized / Advanced) | 13.9% / 14.1% |
| Card Services net charge-off rate | 2.91% |
Source: JPMorgan Q3 2026 earnings release.
What The Market Believes vs. What The Data Actually Shows
| Belief | What the data show |
|---|---|
| Higher rates are a windfall for banks | NII was $27.1B, 53% of managed revenue (d), but the deposit margin in consumer banking was 2.78%, slightly below 2.79% a year earlier, so that spread did not widen; balance growth (loans +10%, deposits +8%) is what the data show. |
| Credit is deteriorating | Net charge-offs were $2.2B, down $389M from a year earlier, and the card charge-off rate was 2.91% against 3.15% a year earlier. The reserve build was $539M. |
| Trading drives earnings | Markets revenue was $10.3B, about 20% of managed revenue (d), up 15% year over year but down $1.8B from Q2. |
| The bank returns most of its profit | Dividends $4.4B plus net repurchases $0.66B is $5.06B (d), 33% of net income. |
| Securities losses are a one-off | They were $658M pre-tax ($498M after tax) in this quarter; the release extract does not say whether it is a repositioning, so the next quarter's disclosures are the test. |
The deposit-margin comparison matters. At a time when the Fed's rate has risen, the consumer bank earned 2.78% on deposits against 2.79% a year earlier (2.70% in Q2): the spread was essentially flat. The extract does not give the 2026 start point for the funds rate, so I do not attribute the flat margin to a cause.
Forensic #1: Where The Revenue Comes From
| Source (managed, $B) | Q3 2026 | Share (d) |
|---|---|---|
| NII excluding Markets | 24.7 | 48.5% |
| Noninterest revenue excluding Markets | 15.9 | 31.2% |
| Markets revenue (NII 2.4 + noninterest 7.9, d) | 10.3 | 20.2% |
| Total managed revenue | 50.9 | 100% |
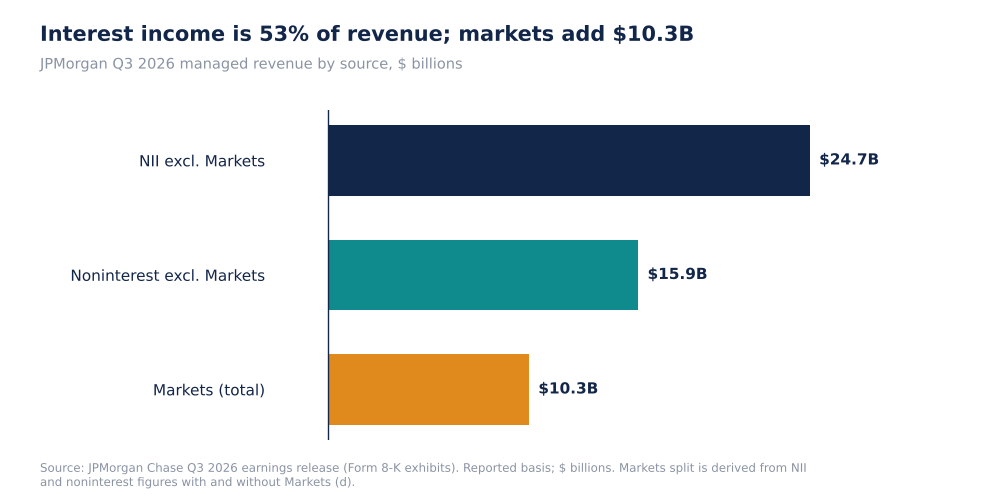
JPMorgan Managed Revenue By Source, Q3 2026, $B (Self-Made)
The $10.3B Markets total reconciles with the figures above (NII $27.1B less $24.7B ex-Markets is $2.4B; noninterest revenue $23.8B less $15.9B ex-Markets is $7.9B; the sum is $10.3B, d) and with the deck's Markets revenue of $10.3B. Within Markets, Equity was $5.0B (+49% year over year) and Fixed Income $5.4B (-4%). Investment banking fees were $3.005B, up 14% from $2.627B a year earlier (d) and down 8% from $3.277B in Q2 (d).
Why it matters. Nearly half of revenue (48.5%, d) is core interest income, and about 20% is market-sensitive. Core interest income grows with loans and deposits; Markets and investment banking depend on activity levels. A forecast needs separate drivers for each.
Sources: JPMorgan release; JPMorgan presentation. Shares and the Markets split are my arithmetic (d).
Forensic #2: From Revenue To Net Income
| Item ($B, reported basis) | Q3 2026 |
|---|---|
| Net revenue | 50.172 |
| Noninterest expense | -27.295 |
| Provision for credit losses | -2.743 |
| Pre-tax income (d) | 20.134 |
| Income taxes (d, remainder) | -4.829 |
| Net income | 15.305 |
| Implied tax rate (d) | 24.0% |
| Overhead ratio (expense / revenue, d) | 54.4% |
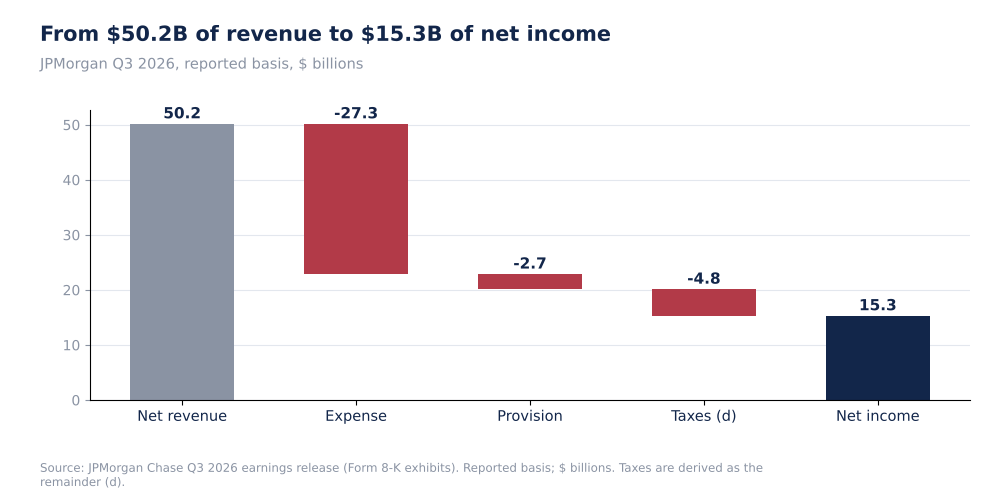
JPMorgan Q3 2026: Revenue To Net Income, $B (Self-Made)
Expense takes 54% of revenue, the provision 5.5% (d: 2.743 / 50.172) and taxes about 9.6% (d). The provision decomposes into $2.2B of net charge-offs plus a $539M reserve build, for $2.74B (d). The reserve build is smaller than in Q3 2025 ($0.8B) and larger than in Q2 2026 ($0.1B). The 24% tax rate is a remainder derived from reported income and not a disclosed figure.
Why it matters. With 54% of revenue consumed by expense, operating leverage (revenue growth versus expense growth) is the main driver of profit growth, and the guidance of about $108.6B of adjusted expense for 2026 (d: $81.1B year to date plus about $27.5B in Q4) shows costs rising roughly in line with the Q3 run rate. Credit costs are a smaller but more volatile item.
Sources: JPMorgan release; JPMorgan presentation. Tax and pre-tax income are my arithmetic (d).
Forensic #3: Segments And Capital
| Segment | Net income ($M) | Share of total (d) |
|---|---|---|
| Commercial & Investment Bank | 8,247 | 53.9% |
| Consumer & Community Banking | 5,670 | 37.0% |
| Asset & Wealth Management | 1,843 | 12.0% |
| Corporate | -455 | -3.0% |
| Total | 15,305 | 100% |
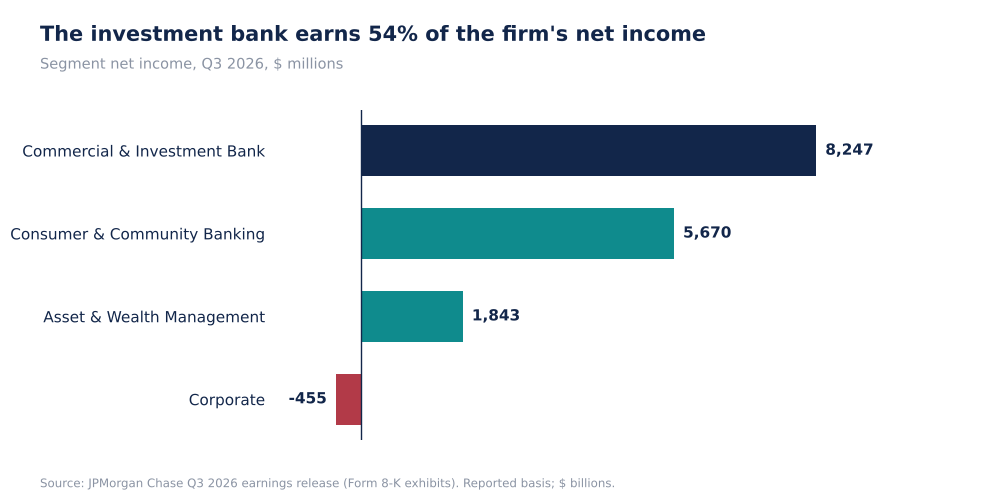
JPMorgan Segment Net Income, Q3 2026, $ Millions (Self-Made)
The segments add up to $15,305M (d), matching reported net income. The Commercial & Investment Bank, which houses Markets and investment banking, is 53.9% of the total (d), while Asset & Wealth Management loans grew 20% year over year to $301.6B. Capital: the CET1 ratio is 13.9% on the Standardized approach, with $304B of CET1 capital. Dividends of $4.4B and net repurchases of $0.66B equal 33% of net income (d), so the remaining roughly $10.2B (d) added to capital or funded growth, while average loans grew by about $145B over the year (d: $1.6T less $1.6T / 1.10, approximate).
Why it matters. The bank is retaining two thirds of its earnings while holding a 13.9% CET1 ratio, so it is either building a buffer ahead of capital rules or investing in growth, and the release extract does not say which. For shareholders, a payout of 33% when earnings are $15B a quarter implies more buyback capacity if the buffer is not needed.
Sources: JPMorgan release; JPMorgan presentation. Shares and the retained amount are my arithmetic (d).
Forensic #4: Outlook And Credit
| Item | Figure | Note |
|---|---|---|
| 2026 NII, implied | about $106.2B | $78.2B year to date + about $28B Q4 |
| 2026 NII ex-Markets, implied | about $97.2B | $71.7B + about $25.5B |
| 2027 NII ex-Markets (preliminary) | about $107B | Layout of the deck was ambiguous; confirm in the source |
| 2026 adjusted expense, implied | about $108.6B | $81.1B + about $27.5B |
| Card net charge-off rate | 2.91% (Q3 2026) | Outlook about 3.2%; 3.34% Q2; 3.15% Q3 2025 |
| Card Services loans | $250.1B | $243.5B in Q2; $234.4B a year ago |
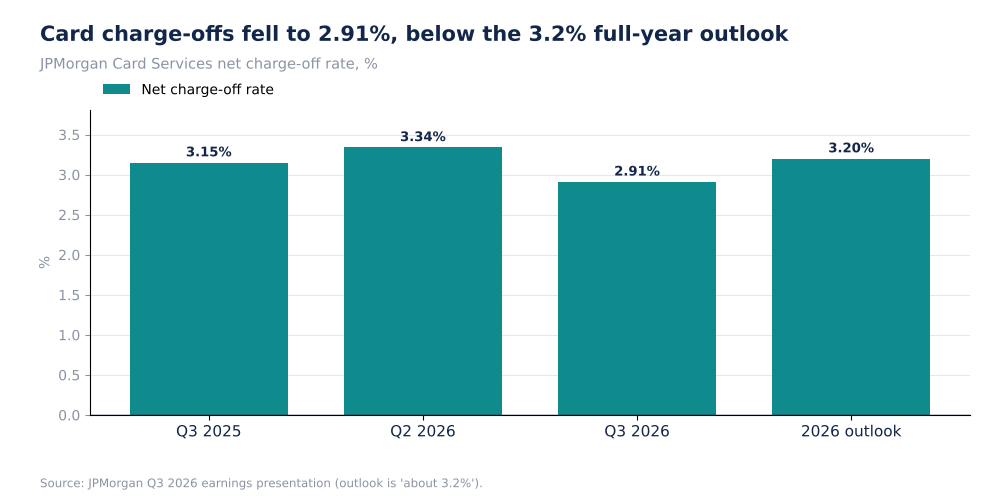
JPMorgan Card Net Charge-Off Rate, % (Self-Made)
The Q4 NII guidance of about $28B is higher than Q3's $27.1B by about 3% (d), and the 2027 ex-Markets figure of about $107B, if I have read the deck correctly, would be about 10% above the 2026 implied $97.2B (d). The deck's text attributes it to balance sheet growth and higher rates, but the layout was ambiguous in my extract. The card charge-off rate of 2.91% is below both its year-ago figure and the full-year outlook of about 3.2%, so either Q4 is expected to be higher or the first-half figures were. Stocknote's household credit article shows the national card delinquency flow at 6.97%, essentially flat.
Why it matters. Guidance of rising NII with rates near 5% for the 10-year suggests that management expects balance sheet growth to outweigh deposit costs. The 2027 figure is the number to confirm, because it carries most of the earnings growth in this year's forecasts.
Sources: JPMorgan Q3 2026 earnings presentation; JPMorgan release. Growth rates are my arithmetic (d).
Valuation Snapshot
I did not retrieve JPMorgan's share price or book value, so no multiples are given here. The metrics used by bank investors are listed below.
| Measure | Q3 2026 |
|---|---|
| ROTCE (reported / ex-securities losses) | 20% / 21% |
| CET1 (Standardized) | 13.9% |
| Payout (dividends + net buybacks) / net income (d) | 33% |
| Overhead ratio | 54% |
| Card net charge-off rate | 2.91% |
| Loans / deposits growth y/y | +10% / +8% |
What has to be true. For a 20% ROTCE to persist, NII needs to grow with loans (guided to about $106B in 2026), expense must stay near 54% of revenue, and credit costs, which were $2.74B in the quarter, must stay well below revenue growth. A recession that lifted the card charge-off rate far above the 3.2% outlook would change that.
Risks: What Would Break The Thesis
- Credit. Card charge-offs at 2.91% against a 3.2% outlook; the national flow into serious delinquency is 6.97%.
- Rates. NII guidance relies on rates and balance sheet growth; the Fed outlook is uncertain.
- Markets. $10.3B of Markets revenue is activity-dependent; Markets fell $1.8B from Q2.
- Securities. $658M of pre-tax losses in the quarter.
- Data limits. No share price, book value, or loan-level credit data were available; the 2027 figure came from an ambiguous deck layout.
The conclusion would be wrong if credit costs are understated by a thin reserve build ($539M) and if NII is flattered by markets-related interest, which makes up $2.4B (d) of the total.
What To Watch Next
- Q4 NII against about $28B and the 2027 ex-Markets guidance.
- The card net charge-off rate against the 3.2% outlook.
- Reserve build after $539M.
- Capital return after a 33% payout and 13.9% CET1.
- Markets revenue against $10.3B and investment banking fees against $3.0B.
- Deposit margin in consumer banking against 2.78%.

Sandeep Gupta
Independent equity research analyst publishing forensic theses on US-listed stocks. MBA, Politecnico di Milano School of Management (Milan, Italy).
Get new research in your inbox
Subscribe to receive forensic equity research the moment it's published. Free, no spam.
Discussion
Be the first to comment.