

Investment Thesis
IBM beat on revenue and raised its free cash flow outlook, but about half of software's growth was acquired, most of the nine-month cash flow gain is working capital, and tangible equity is deeply negative.
- Earnings. Revenue was $17,103M (+4.7%, +6% constant currency) against about $16.8B expected. Operating EPS was $2.95 vs $2.65 (+11%), above the $2.85 to $2.89 estimates. GAAP EPS from continuing operations was $2.31 vs $1.84 (+26%).
- Acquired growth. Software grew 8.2% to $7,804M, and the call said organic growth was "over four points" of the 9%, so roughly half was acquired (my reading; the call does not state the acquired share). IBM spent $11.4B on acquisitions in nine months, and goodwill rose $7.2B to $74.9B.
- Earnings quality. Operating EPS excludes $0.57 of acquisition-related charges (+19% on last year). A lower operating tax rate (14.7% vs 17.0%) added about 3 points to the 11% EPS growth, and operating gross margin fell to 58.5% from 58.7% (derived).
- Cash flow. Free cash flow was $3,027M (+28%) in Q3 and $7,787M (+8%) over nine months. Of the $2.6B nine-month rise in operating cash flow, $1.6B (61%) is a swing in working capital (derived).
- Guidance. Revenue growth guidance was unchanged at 4% to 5% in constant currency. The free cash flow outlook was raised to growth of more than $1B, which implies more than about $0.4B of growth in Q4 (derived). Management expects transaction processing to normalise after a +9% quarter.
- Balance sheet. Net debt rose about $5.9B in nine months to $52.7B (derived). Tangible equity, meaning IBM stockholders' equity minus goodwill and intangibles, is about -$53.0B (derived).
- Stock. It closed at $251.46 on Oct 21, up 3.94% before the report, and sources disagree on the Oct 22 move. At $251.46 it is about 21x annualised Q3 operating EPS (derived).
- This article contains no price target or rating. Every figure comes from IBM's release or a named source, and anything I calculated is marked.
Source: IBM Releases Third-Quarter Results, Oct 21, 2026.
Q3 2026 At A Glance
Revenue grew 4.7% to $17.1B, operating pre-tax income grew 8.6%, and free cash flow grew 28%.
| Metric (quarter ended Sept 30) | Q3 2026 | Q3 2025 | Change |
|---|---|---|---|
| Revenue | $17,103M | $16,331M | +4.7% (+6% constant currency) |
| Software revenue | $7,804M | $7,209M | +8.2% |
| Consulting revenue | $5,335M | $5,324M | +0.2% (+2% constant currency) |
| Infrastructure revenue | $3,707M | $3,559M | +4.2% |
| Gross margin (GAAP / operating) | 56.8% / 58.5% | 57.3% / 58.7% | -0.5 / -0.2 pts |
| Pre-tax income (operating) | $3,295M | $3,033M | +8.6% (d) |
| Pre-tax margin (operating) | 19.3% | 18.6% | +0.7 pts |
| Net income, continuing operations (GAAP) | $2,199M | $1,744M | +26% |
| Diluted EPS, continuing operations (GAAP) | $2.31 | $1.84 | +26% |
| Diluted EPS (operating) | $2.95 | $2.65 | +11% |
| Effective tax rate (GAAP / operating) | 11.9% / 14.7% | 28.2% / 17.0% | n/m |
| Net cash from operations | $4,025M | $3,081M | +31% (d) |
| Free cash flow | $3,027M | $2,373M | +$654M (+28%) (d) |
| Acquisitions, net of cash acquired | $884M | $58M | +$826M (d) |
| Dividends paid | $1,596M | $1,569M | +2% |
(d) = derived. Q3 2025 GAAP EPS included a $0.33 per share tax charge from tax reform, so the +26% GAAP change is not a like-for-like comparison. Source: IBM Q3 2026 release tables via Stock Titan, Oct 21, 2026.
What The Market Believes vs. What The Data Actually Shows
IBM beat on revenue and EPS and raised its cash flow outlook, yet the stock gave back its pre-report gain because the full-year revenue guide did not move.
| Item | Result or guide | Comparison |
|---|---|---|
| Revenue | $17.10B | Consensus about $16.82B (+1.7%) |
| Operating EPS | $2.95 | Estimates $2.85 to $2.89, depending on the provider |
| 2026 revenue growth, constant currency | 4% to 5% | Unchanged; currency expected to be neutral |
| 2026 free cash flow | Up more than $1B year over year | Raised; the release does not state the prior outlook |
| 2026 software growth | About 7% to 8%, base case about 7% | Per the call; Q4 software expected near the low end |
| 2026 operating pre-tax margin | About 100 basis points of expansion | Per the call |
Price reaction: IBM closed at $251.46 on Oct 21, up 3.94% ahead of the results (INDmoney). The reports on Oct 22 do not agree. StockStory had the shares down about 2% at $246.50 in the morning, after a 2.9% dip. INDmoney quoted $238.05 overnight, down 5.33% from the Oct 21 close. Stock Titan's trading data shows Oct 22 close-to-close at +0.26%, with an intraday range from -2.6% to +7.2%. I could not confirm the Oct 22 closing price, so the valuation below uses the Oct 21 close and shows a lower case.
The explanation StockStory gives is that investors hoped for a raised revenue forecast and much of the upside came from recovered delayed deals. Goldesel adds that investors remain wary after a July warning on revenue and profit, partly tied to the z17 mainframe cycle, and notes a weak day for tech stocks. The shares are down 15.4% year to date and 25.1% below the June 2026 high of $329.23 (StockStory).
Sources: IBM release; Motley Fool call transcript; INDmoney; StockStory; Goldesel; Stock Titan.
Forensic #1: About Half Of Software's Growth Was Acquired
Software grew 8% and earned 65% of segment profit, but the call put organic growth at "over four points," and IBM has spent $11.4B on acquisitions this year.
| Software, Q3 2026 | YoY | YoY, constant currency |
|---|---|---|
| Hybrid Cloud (Red Hat) | +11% | not given in the release |
| Automation | -3% | not given in the release |
| Data | +19% | +20% |
| Transaction Processing | +9% | +10% |
| Total software | +8.2% | +8.7% |
On the call, management said Data was driven by Confluent, that Confluent bookings grew about 20%, and that software growth was "over four points" organic within the total of about 9%. The call did not state the acquired share, so the remainder, roughly four to five points, is my inference. It also said it expects Q4 software growth near 7%, the low end of the 7% to 8% full-year range.
Acquisition spending was $11,364M in nine months against $7,903M a year earlier, though only $884M of it fell in Q3. Goodwill rose $7.2B (+10.6%) to $74.9B and intangibles rose $2.2B (+19.4%) to $13.6B (derived).
| Segment profit ($M) | Q3 2026 | Q3 2025 | Profit change (d) | Margin, 2026 vs 2025 |
|---|---|---|---|---|
| Software | 2,734 | 2,374 | +15.2% | 35.0% vs 32.9% |
| Consulting | 653 | 686 | -4.8% | 12.2% vs 12.9% |
| Infrastructure | 715 | 644 | +11.0% | 19.3% vs 18.1% |
| Financing | 108 | 123 | -12.2% | 56.1% vs 61.6% |
| Total of the four segments (d) | 4,210 | 3,827 | +10.0% |
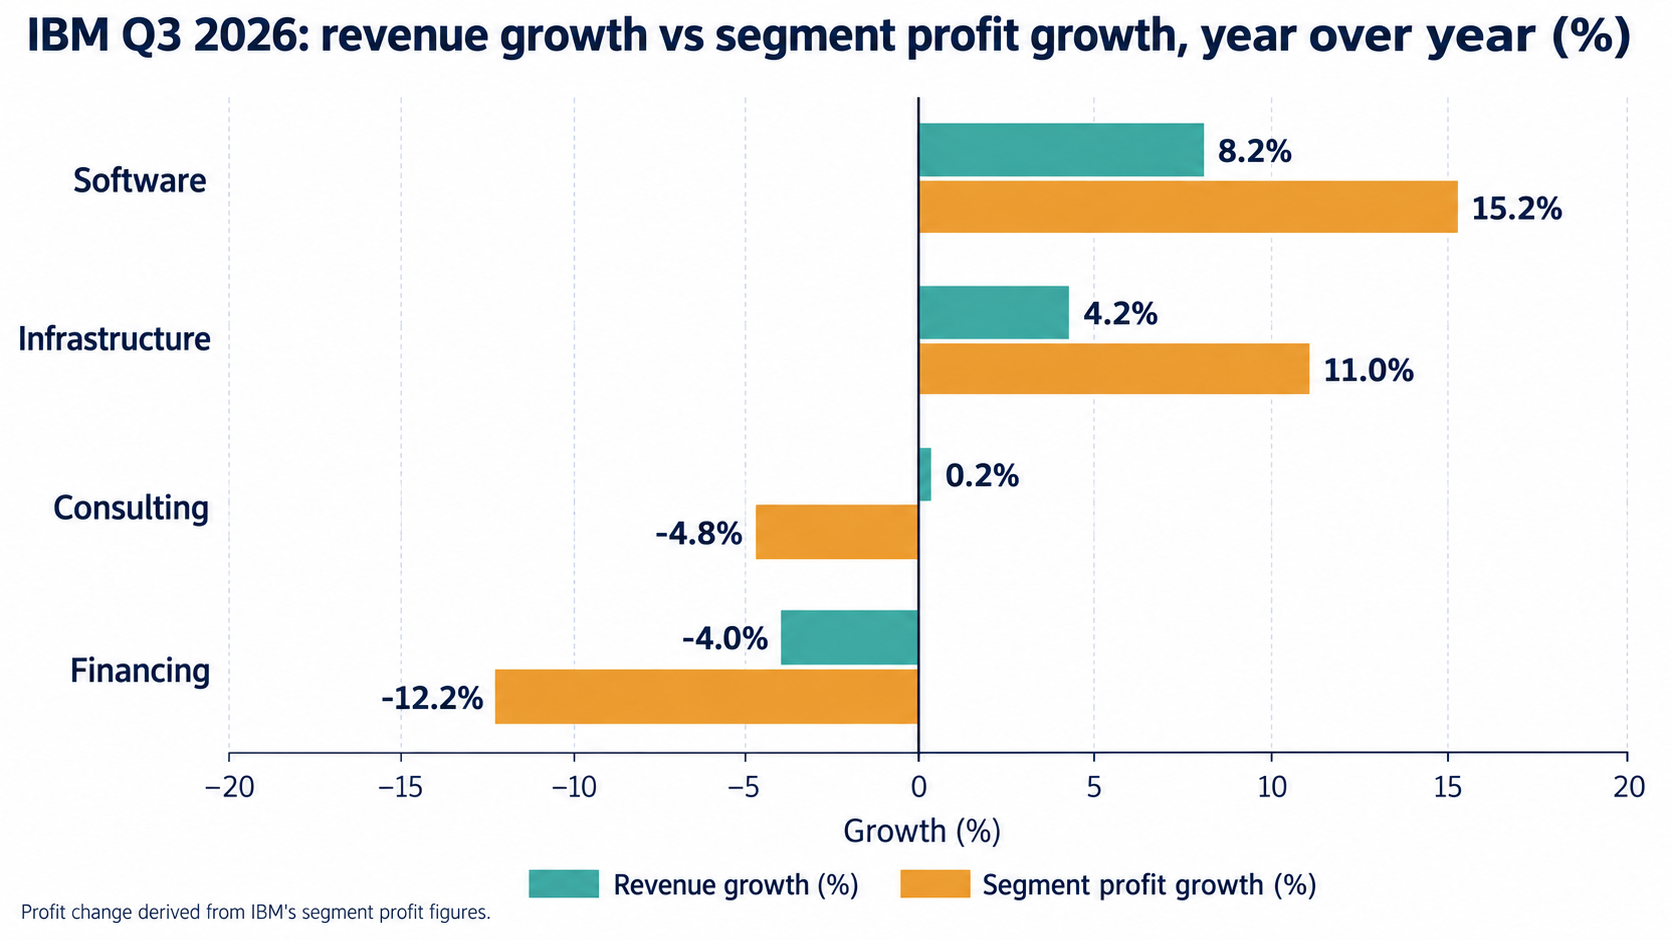
Q3 2026 Revenue Growth vs Profit Growth by Segment (Self-Made)
Software is 45.6% of revenue but 64.9% of segment profit, up from 62.0% a year ago (derived). Consulting revenue was flat ($5,335M vs $5,324M, +2% in constant currency) with segment gross margin of 27.4% against 29.3%; management said about 30% of consulting revenue and 35% of its backlog is AI-related, and that productivity gains were reinvested. In Infrastructure, IBM Z fell 20% (-19% in constant currency) while Distributed Infrastructure rose 31%. The release gives no Z or Distributed dollar figures and no generative AI book of business.
Transaction Processing rose 9% after a Q2 slowdown that management called timing. CEO Arvind Krishna said he does not expect the double-digit pace to continue, and management expects the full year to be flat.
(d) = my arithmetic. Sources: IBM Q3 2026 release tables; IBM release; Motley Fool call transcript; StorageNewsletter.
Forensic #2: Operating EPS Excludes $0.64 Of Charges, And Margin Growth Came From SG&A
Operating EPS of $2.95 is $0.64 above GAAP EPS of $2.31, mostly acquisition amortisation, and the 11% growth leans on a lower tax rate and lower selling costs, not gross margin.
| EPS bridge, continuing operations | Q3 2026 | Q3 2025 |
|---|---|---|
| Diluted EPS (GAAP) | $2.31 | $1.84 |
| Acquisition-related adjustments | $0.57 | $0.48 |
| Retirement-related adjustments | $0.07 | $0.01 |
| Tax reform | $0.00 | $0.33 |
| Diluted EPS (operating) | $2.95 | $2.65 |
| Acquisition-related as % of operating pre-tax income (d) | 21.5% | 19.5% |
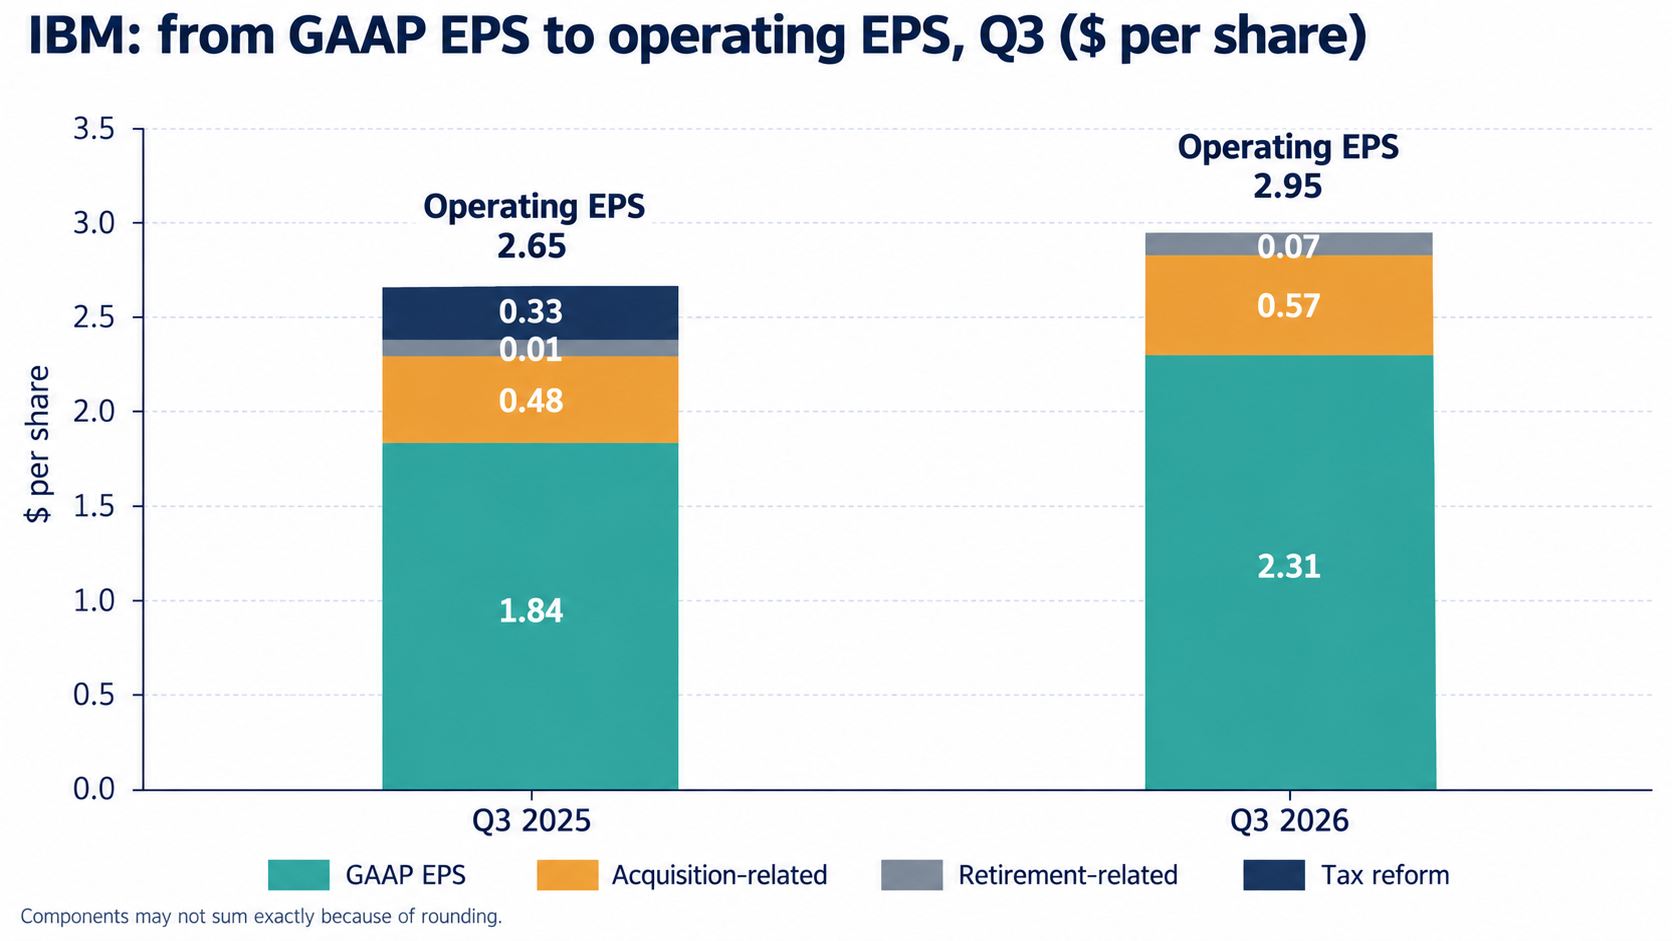
GAAP to Operating EPS Bridge, Q3 2025 and Q3 2026 (Self-Made)
Operating EPS grew 11.3% (derived). Operating pre-tax income grew 8.6%, a lower operating tax rate of 14.7% against 17.0% added about 2.8 points, and a 0.5% higher diluted share count (953.5M vs 948.9M) took away about 0.5 points (derived). Acquisition-related adjustments grew 19% ($0.57 vs $0.48), faster than operating EPS.
Gross margin did not drive the improvement. Operating gross margin was 58.5% against 58.7%, and GAAP gross margin 56.8% against 57.3%. By segment, gross margin fell in Software (82.5% vs 83.1%), Consulting (27.4% vs 29.3%), Infrastructure (56.7% vs 57.2%) and Financing (40.7% vs 45.6%). The gain came further down the income statement:
- Operating SG&A was $4,193M vs $4,394M (-4.6%); GAAP SG&A was $4,620M vs $4,748M (-2.7%).
- GAAP R&D rose 14.2% to $2,378M from $2,082M.
- IP and custom development income fell 25% to $164M from $219M.
- Total operating expense and other income rose 2.3% to $6,708M, against operating gross profit growth of 4.3% (derived).
The GAAP picture is flattered by tax. Q3 2025 GAAP tax was 28.2% because of a $309M tax reform charge, against 11.9% this quarter; GAAP pre-tax income grew only 2.8% (derived) while GAAP net income from continuing operations grew 26%.
(d) = my arithmetic from the release's reconciliations. Source: IBM Q3 2026 release tables via Stock Titan.
Forensic #3: 61% Of The Nine-Month Cash Flow Gain Is Working Capital
Nine-month operating cash flow rose $2.6B, but $1.6B of that is a change in operating assets and liabilities, and IBM's own free cash flow definition strips out another $1.9B.
| Nine months ($M) | 2026 | 2025 | Change (d) |
|---|---|---|---|
| Net cash from operating activities | 11,791 | 9,153 | +2,638 (+29%) |
| of which: changes in operating assets and liabilities | 804 | -804 | +1,608 |
| of which: net income, D&A, SBC and other | 10,987 | 9,957 | +1,030 |
| Less: change in IBM Financing receivables | 2,805 | 905 | +1,900 |
| Operating cash flow excluding Financing receivables | 8,986 | 8,248 | +738 (+9%) |
| Capital expenditures, net | 1,200 | 1,067 | +133 |
| Free cash flow | 7,787 | 7,181 | +606 (+8%) |
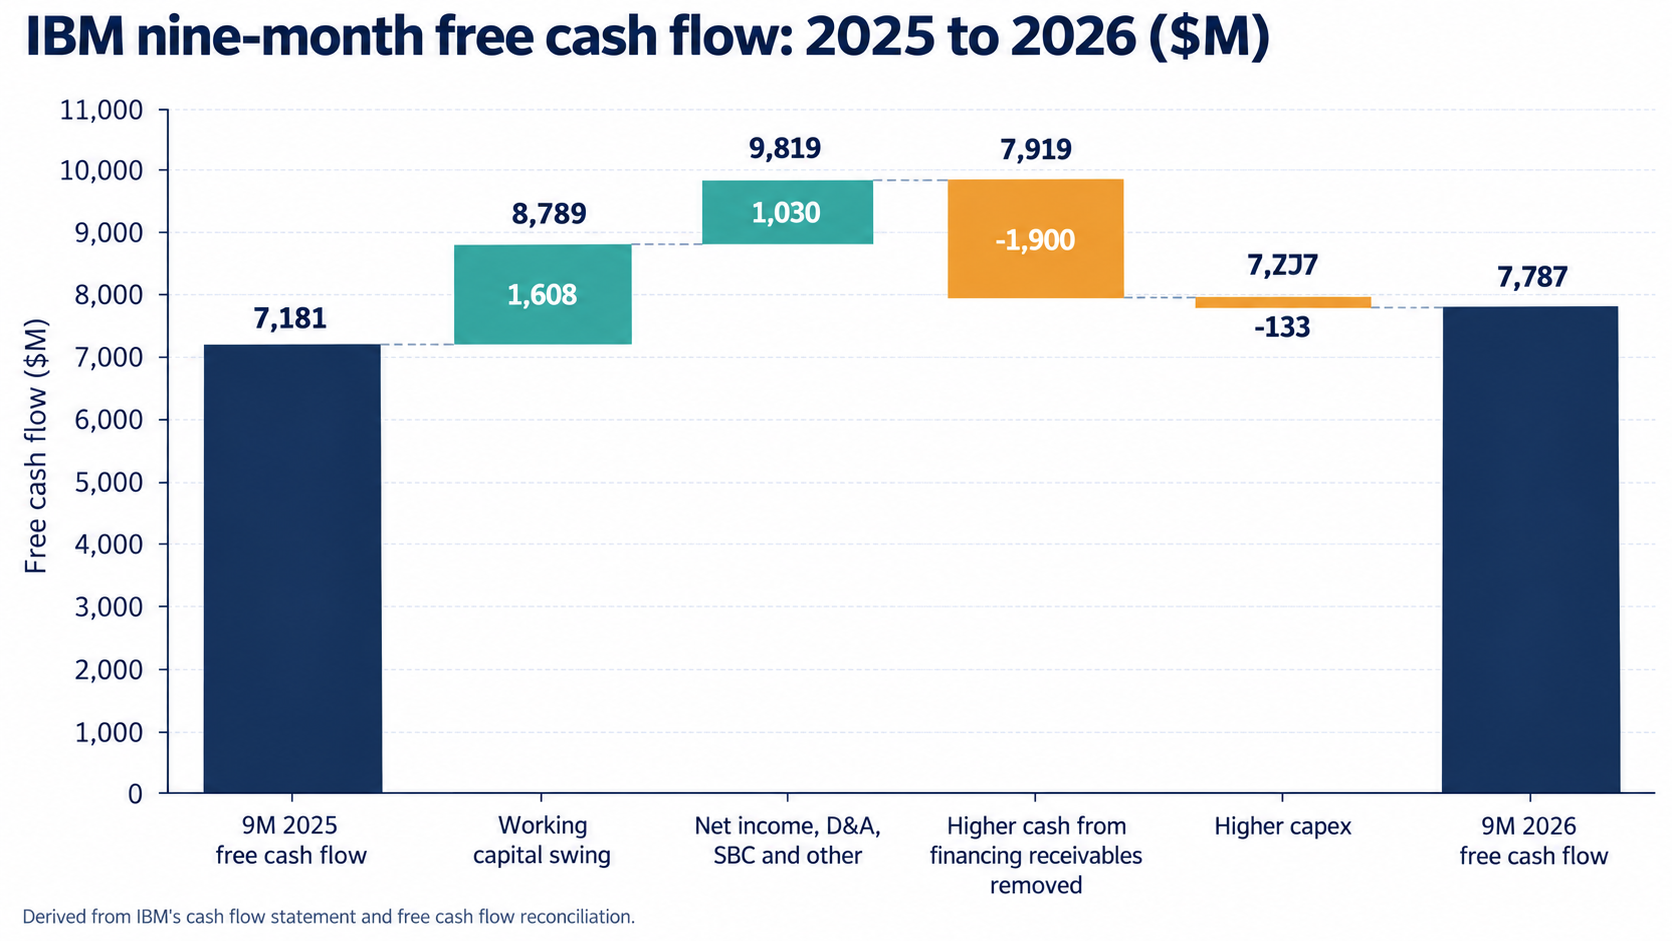
Nine-Month Free Cash Flow Bridge, 2025 to 2026 (Self-Made)
Without the working capital swing, nine-month free cash flow would have been roughly flat (derived: +$606M minus +$1,608M). IBM's definition removes cash released from financing receivables ($2.8B vs $0.9B), so reported free cash flow growth of 8% is much lower than operating cash flow growth of 29%, which is the more conservative treatment.
Q3 was stronger: operating cash flow excluding Financing receivables was $3,484M vs $2,783M (+25%), working capital was a -$31M drag against -$383M a year ago, and free cash flow was $3,027M vs $2,373M.
The guide: IBM expects free cash flow to rise by more than $1B in 2026. With $606M already added in nine months, that implies Q4 growth of more than about $394M over Q4 2025 (derived). Management cited higher adjusted EBITDA ($13.7B vs $12.7B over nine months), partly offset by higher capex, cash taxes and net interest expense.
Stock-based compensation was $535M in Q3 (+20%) and $1,539M in nine months (+20%), equal to about 20% of nine-month free cash flow. Free cash flow after stock-based compensation was about $6.25B (derived).
(d) = my arithmetic from the cash flow statement and free cash flow reconciliation. Sources: IBM Q3 2026 release tables via Stock Titan; Motley Fool call transcript.
Forensic #4: Acquisitions And Dividends Cost $16.9B Against $7.8B Of Free Cash Flow
IBM paid for the gap with $5.9B more net debt and a $3.4B fall in cash, and tangible equity is about -$53B.
| Balance sheet ($M unless noted) | Dec 31, 2025 | Sep 30, 2026 | Change |
|---|---|---|---|
| Cash, restricted cash and marketable securities | 14,471 (d) | 11,106 (d) | -3,365 |
| Total debt ($B) | 61.3 | 63.8 | +2.6 |
| Debt minus cash and securities ($B) (d) | 46.8 | 52.7 | +5.9 |
| Goodwill | 67,717 | 74,916 | +7,199 |
| Intangibles, net | 11,391 | 13,603 | +2,212 |
| IBM stockholders' equity | 32,648 | 35,537 | +2,889 |
| Equity minus goodwill and intangibles (d) | -46,460 | -52,982 | -6,522 |
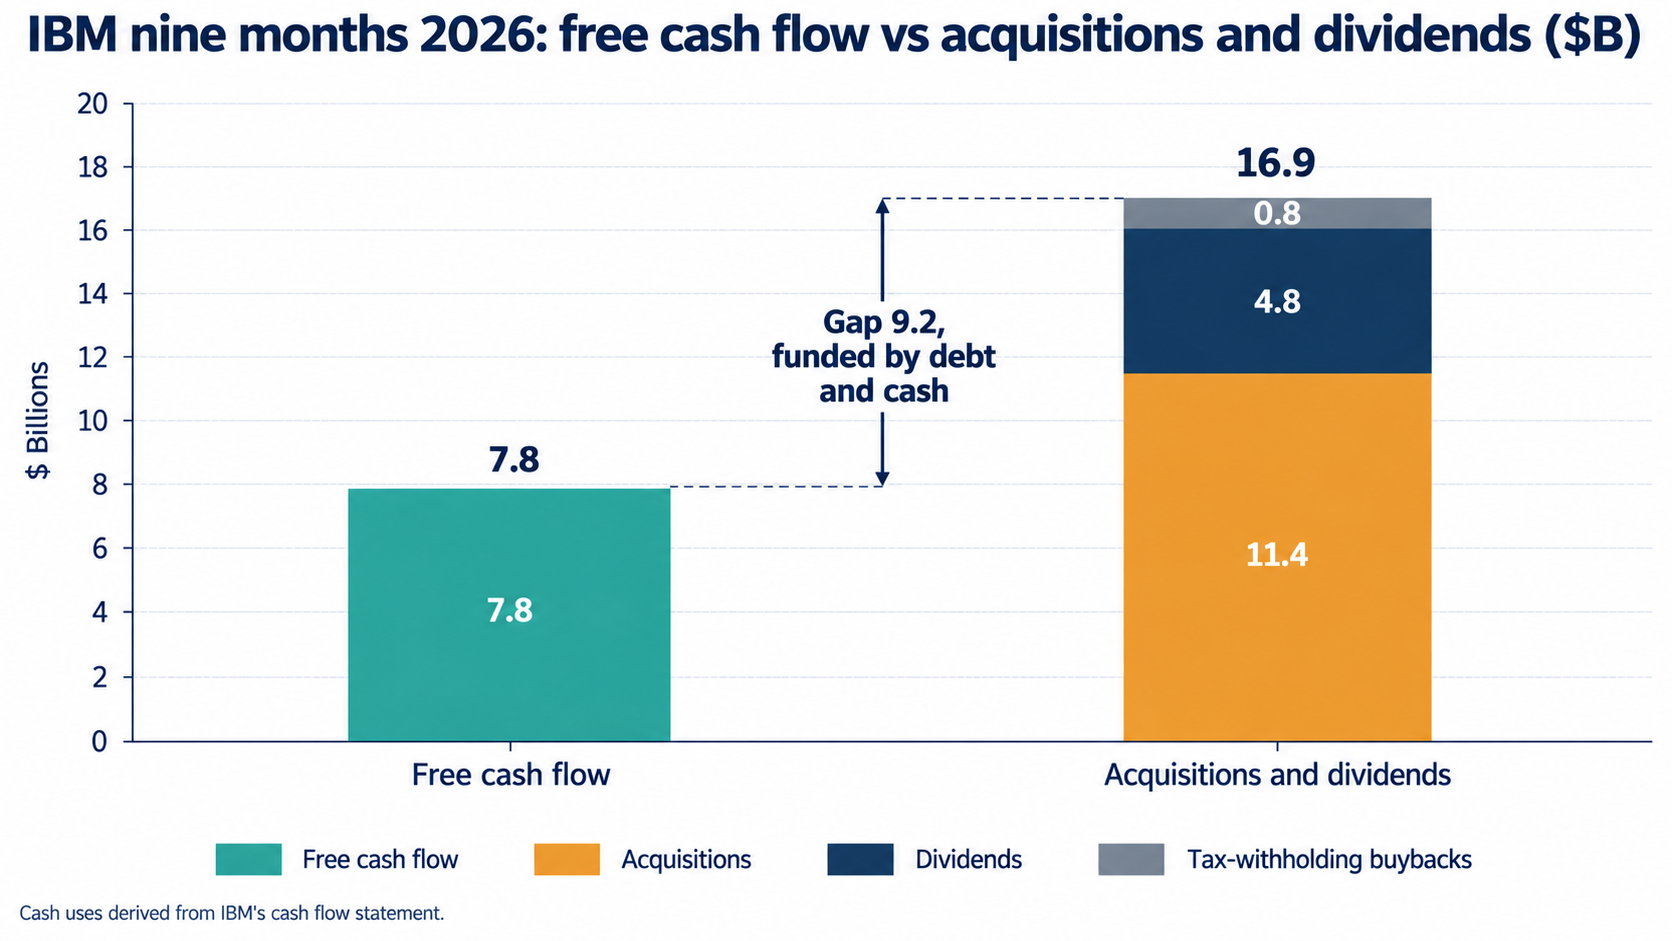
Nine-Month Cash Uses vs Free Cash Flow, 2026 (Self-Made)
Nine-month cash uses (derived): acquisitions of $11,364M, dividends of $4,762M and $817M of stock repurchased for tax withholdings add up to $16,943M, against $7,787M of free cash flow. Dividends alone were 61% of nine-month free cash flow and 53% of Q3's. The quarterly dividend is $1.69 a share, or about $6.4B a year on 953.5M diluted shares (derived).
Total debt of $63.8B includes $12.7B of IBM Financing debt, which backs financing receivables, so the non-financing portion is lower. Interest expense was $491M in Q3 and $1,451M over nine months, flat on a year ago. In Q3, IBM also recorded a $575M inflow from noncontrolling interest transactions, and noncontrolling interests rose to $669M from $93M at year end. The release does not explain either; the Form 10-Q should.
(d) = my arithmetic. "Equity minus goodwill and intangibles" is a simple tangible equity measure and ignores other assets. Source: IBM Q3 2026 release tables via Stock Titan.
Valuation Snapshot
At the pre-report close of $251.46, IBM trades at about 21x annualised Q3 operating EPS and 27x annualised GAAP EPS.
| Measure | At $251.46 (Oct 21 close) | At $238.05 (Oct 22 overnight quote) |
|---|---|---|
| Share price move | +3.94% on Oct 21 | -5.33% from the Oct 21 close |
| Market value (d) | about $239.8B | about $227.0B |
| Versus the 52-week high of $329.23 (d) | -23.6% | -27.7% |
| Q3 operating EPS annualised ($11.80) (d) | 21.3x | 20.2x |
| Q3 GAAP EPS annualised ($9.24) (d) | 27.2x | 25.8x |
| Nine-month free cash flow / market value (not annualised) (d) | 3.2% | 3.4% |
| Dividend yield ($6.76 a year) (d) | 2.7% | 2.8% |
Method: market value is the price times 953.5M weighted-average diluted shares from the release, because period-end shares outstanding were not in the tables I read. Two cautions: annualising a single quarter ignores seasonality in IBM's cash flow, and operating EPS excludes $0.57 of acquisition-related charges a share.
Third-party views, for context only: Goldesel lists targets of $275 (Evercore ISI), $277 (Barclays) and $269 (JPMorgan); Truist's $240 target dates from before the report (FMP, Oct 9). None is independently verified.
This article gives no price target. Any target depends on organic software growth, transaction processing after its Q3 rebound, and how acquisition spending and the dividend are funded.
(d) = my arithmetic. Sources: INDmoney (Oct 21 close and overnight quote); StockStory (52-week high); Goldesel; FMP.
Risks: What Would Break The Thesis
Six items could make the Q3 beat harder to repeat.
| Risk | What the data shows |
|---|---|
| Acquired growth fades | Organic software growth was "over four points" of about 9%; Q4 software guided near 7%; Confluent's contribution is acquired and will annualise |
| Transaction processing normalises | +9% in Q3 after a Q2 slowdown; full-year guide is flat; IBM Z revenue fell 20% |
| Consulting | Flat revenue, segment margin 12.2% vs 12.9%, gross margin 27.4% vs 29.3% |
| Cash flow quality | $1.6B of the $2.6B nine-month operating cash flow gain is working capital; Q4 needs more than about $394M of free cash flow growth (d) |
| Leverage | Net debt up about $5.9B in nine months; $11.4B spent on acquisitions; dividends were 61% of free cash flow (d) |
| Reported earnings | Operating EPS excludes $0.57 of charges a share; GAAP and operating tax rates are low (11.9% and 14.7%) |
(d) = my arithmetic. Sources: Motley Fool call transcript; IBM Q3 2026 release tables.
What To Watch Next
IBM's Q4 report, expected around late January 2027 (the sources I read do not give a date), will test most of these at once.
| Check | Where the data stands | The test |
|---|---|---|
| Software growth | +8.7% in constant currency in Q3; Q4 guided near 7% | Whether organic growth rises above about 4%, or growth falls to 7% as acquisitions annualise |
| Transaction processing | +10% in constant currency in Q3; full-year flat | How far Q4 falls after the Q3 rebound |
| Free cash flow | $7,787M in nine months (+$606M) | Q4 growth above about $394M to meet the guide (d) |
| Working capital | +$804M in nine months vs -$804M | Whether it reverses in Q4 |
| Consulting | +2% in constant currency, margin 12.2% | Full-year growth in the low to mid single digits, per management |
| Net debt | $52.7B at Sept 30 (d) | Whether it keeps rising with further acquisitions |
| Form 10-Q | Noncontrolling interest inflow of $575M not explained in the release | The explanation, plus the tax rate and financing receivables detail |
Also worth tracking: IBM's Quantum Day on Dec 10 and its DARPA Quantum Benchmarking Initiative Stage C selection. Neither has a revenue figure yet.
Sources And Data Notes
Financial statement figures come from IBM's Q3 2026 results release and its tables as reproduced by Stock Titan, which agree with each other. Q3 2026 is the three months ended September 30, 2026. IBM reported on Oct 21, 2026, after the close; prices below are from Oct 21 and Oct 22 and will have moved.
Primary sources
Secondary sources
- Motley Fool call transcript: organic software growth, Confluent, transaction processing, consulting AI share, free cash flow drivers, tax and margin guidance
- INDmoney: Oct 21 close, overnight quote, consensus
- StockStory: Oct 22 morning move, 52-week high, year-to-date move
- Goldesel: reaction explanation, analyst targets
- FMP: pre-report consensus and Truist target
- StorageNewsletter: infrastructure sub-segment detail
Marked, not independently confirmed
- Call commentary (organic software growth, Confluent bookings, transaction processing outlook, consulting AI share, margin and tax guidance) comes from a transcript summary, not from the filed release. The acquired share of software growth is my inference from it.
Where sources disagree
- The Oct 22 move: -2% in the morning (StockStory), -5.33% overnight (INDmoney), +0.26% close-to-close (Stock Titan), and -3.91% in Frankfurt trading (Goldesel). I could not confirm the closing price.
- Operating EPS estimates ranged from $2.85 to $2.89 across sources, and revenue consensus from about $16.79B to $16.82B.
- The release calls the Red Hat line "Hybrid Cloud (Red Hat)", and a call summary said Red Hat grew 11% in constant currency; the release's own reported growth is also 11%.
Left out
- A summary said management was comfortable with street estimates of "about $32 billion" of revenue. It does not reconcile with nine-month revenue of $50.2B, so I excluded it.
- A TechCrunch search result describing a different quarter's revenue miss, which I did not use.
- I did not open the Form 10-Q, so working capital, noncontrolling interests, financing receivables and tax details are not confirmed from the filing.
Derived figures are my arithmetic from the release and are marked (d), "derived" or "my arithmetic".

Sandeep Gupta
Independent equity research analyst publishing forensic theses on US-listed stocks. MBA, Politecnico di Milano School of Management (Milan, Italy).
Get new research in your inbox
Subscribe to receive forensic equity research the moment it's published. Free, no spam.
Discussion
Be the first to comment.