
Investment Thesis
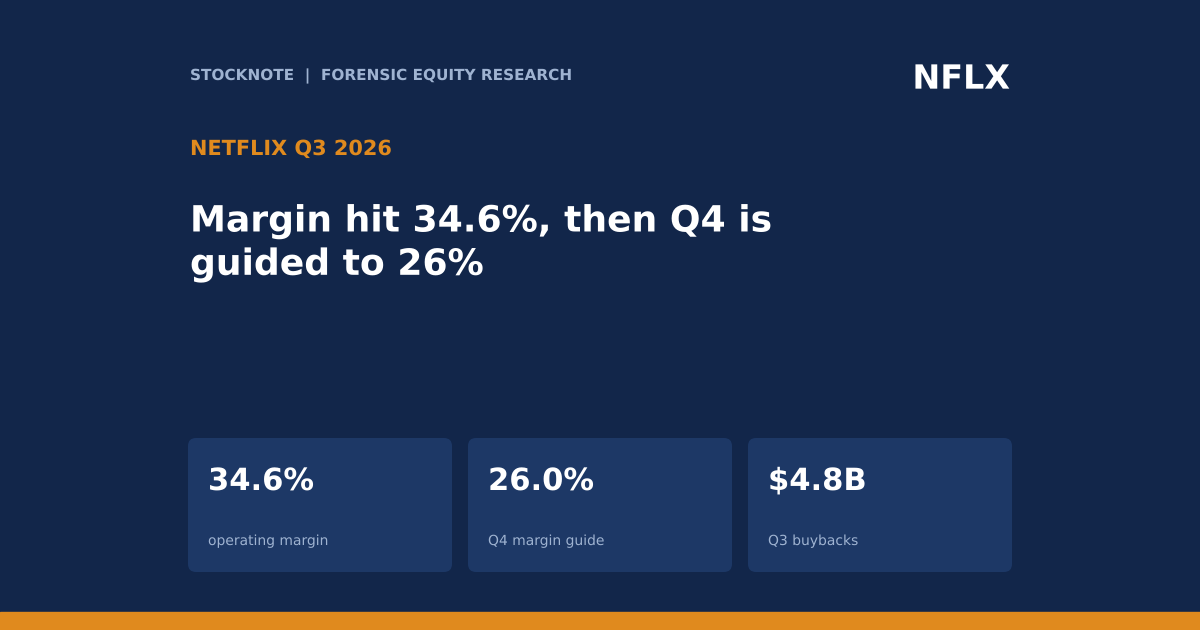
Netflix reported third-quarter revenue of $12,874M, up 12%, and operating income of $4,459M, up 37%, for a margin of 34.6% against 28.2% a year ago. Diluted EPS was $0.87 against $0.59. The same letter guides Q4 operating margin to 26.0%, cuts the 2026 free cash flow target to about $12.0B from $12.5B, and trims the 2026 advertising revenue target to about $2.7B from about $3B. The investor question is how much of the Q3 margin is a repeatable level and how much is timing.
- Results. Revenue $12,874M (+12%, +11% at constant currency), operating income $4,459M (+37%), net income $3,664M, diluted EPS $0.87 (+47%, d), on 4,195M diluted shares.
- Cash. Q3 free cash flow was $2,884M against $2,661M a year ago. Share repurchases were $4,797M for 63.9M shares, and $22.3B of authorization remains.
- Balance sheet. Cash $8.2B, total debt $15.1B, net debt $7.1B as the release states it, and streaming content obligations of $25.2B.
- Content. Additions to content assets were $5,160M against amortization of $4,236M, a ratio of 1.22 times (d). Management expects annual cash content spend of about 1.1 times amortization.
- Q4 guide. Revenue $13.4B (+12%), operating margin 26.0% including about 120 basis points from a headcount reduction, operating income $3.5B, EPS $0.67.
- 2026 guide. Revenue $51.1B (+13%), operating margin 31.5% against 29.5% in 2025, operating income growth above 20%, free cash flow about $12.0B, advertising revenue about $2.7B.
- Not disclosed. The letter does not report paid memberships. It cites an audience approaching one billion people, which is not a paid count.
- This article contains no price target or rating. Every figure comes from the named source, and anything I calculated is marked (d).
Bottom line. Netflix is converting growth into profit at a very high rate, with about 85% to 90% of the year-over-year revenue increase reaching operating income (d, rough). That cannot last, and the company says so: the Q4 margin guide is 8.6 points below Q3. Investors are therefore choosing between two different run-rates, a 34.6% quarter and a 31.5% year, and the Q4 guide shows which one management expects to hold.
Source: Netflix Q3 2026 shareholder letter, SEC Exhibit 99.1.
Q3 2026 At A Glance
| Metric (Q3 2026) | Result | Change |
|---|---|---|
| Revenue | $12,874M | +12% (+11% constant currency) |
| Operating income | $4,459M | +37% |
| Operating margin | 34.6% | +6.4 pts (28.2% a year ago) |
| Net income | $3,664M | n/a |
| Diluted EPS | $0.87 | +47% (d), from $0.59 |
| Free cash flow | $2,884M | +8% (d), from $2,661M |
| Share repurchases | $4,797M | 63.9M shares |
| Content asset additions / amortization | $5,160M / $4,236M | ratio 1.22 times (d) |
| Cash / total debt | $8.2B / $15.1B | net debt $7.1B as stated |
Source: Netflix Q3 2026 shareholder letter. Percentage changes marked (d) are my arithmetic on stated dollars.
What The Market Believes vs. What The Data Actually Shows
| Belief | What the letter shows |
|---|---|
| Margins keep rising | Q3 was 34.6%, but Q4 is guided to 26.0% and the full year to 31.5%. Headcount reduction costs explain about 1.2 points of Q4. |
| Advertising is a second growth engine | The 2026 advertising target was cut to about $2.7B from about $3B, a 10% reduction (d). |
| Free cash flow follows profit | Operating income is guided up more than 20% for the year, yet the free cash flow target was cut by $0.5B to about $12.0B. |
| Buybacks are covered by cash generation | Q3 repurchases of $4,797M were 1.66 times free cash flow of $2,884M (d). |
| Net income tracks operating income | Q3 net income was 82% of operating income, but in the first half it was 107% of operating income (d). |
The usual narrative is a compounding subscription business with steady margin expansion. The numbers support the expansion, but the guide breaks the straight line, and two of the three 2026 targets that relate to cash and advertising were reduced in the same letter that reported record margin.
Forensic #1: A Very High Incremental Margin, And Why It Is Guided To Fall
| Item | Q3 2025 | Q3 2026 | Change |
|---|---|---|---|
| Revenue (d, from 12%) | about $11,495M | $12,874M | about +$1,379M |
| Operating income (d, from 37%) | about $3,254M | $4,459M | about +$1,204M |
| Operating margin | 28.2% | 34.6% | +6.4 pts |
| Incremental margin (d, rough) | n/a | n/a | about 85% to 90% |
| Q4 2026 guide: operating margin | n/a | 26.0% | -8.6 pts vs Q3 (d) |
| Q4 2026 guide: operating income | n/a | $3,500M | -21% vs Q3 (d) |
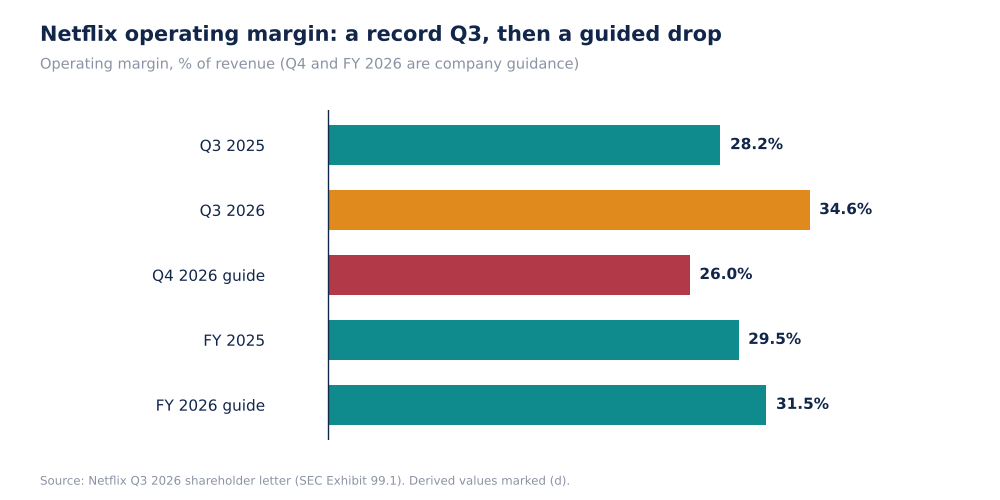
Netflix Operating Margin, Actual And Guided (Self-Made)
The prior-year dollars are backed out of rounded growth rates, so the incremental margin is a range, not a point. The point holds under any rounding: almost all of the added revenue became operating income. Q4 guided operating income of $3,500M is $959M below Q3 (d), on revenue that is $526M higher (d). The nine-month operating income of $12,608M plus the Q4 guide gives about $16.1B for the year, which matches the 31.5% margin on $51.1B of revenue (d).
Why it matters. A business that earns 87 cents of profit on each extra dollar of revenue is very sensitive when costs return. The guide says costs return in Q4, and about 1.2 points of the drop is a one-off headcount charge, which leaves a further 7 points or so that the letter does not itemise in the portion I read. Investors should anchor on the year, a 31.5% margin, rather than on the Q3 peak.
Source: Netflix Q3 2026 shareholder letter. Prior-year dollars and incremental margin are derived from rounded growth rates.
Forensic #2: Net Income Has Run Ahead Of Operating Income
| Period | Operating income | Net income | Net income / operating income (d) |
|---|---|---|---|
| Q3 2026 | $4,459M | $3,664M | 82% |
| First half 2026 (d) | $8,150M | $8,684M | 107% |
| Nine months 2026 | $12,608M | $12,348M | 98% |
| Nine-month diluted EPS | n/a | $2.90 | n/a |
| First-half diluted EPS (d) | n/a | $2.03 | n/a |
In Q3 net income was 82% of operating income, which is what a normal tax charge produces. In the first half net income was higher than operating income by about $535M (d), so non-operating gains must have exceeded the tax charge. The part of the letter I read does not state the cause. The practical consequence is that nine-month EPS of $2.90 is not a clean run-rate: the first half averaged about $1.02 a quarter (d), above Q3's $0.87 and well above the $0.67 Q4 guide.
Why it matters. An investor who annualises nine-month EPS gets about $3.87 (d) and a flattering multiple. The Q3 figure annualises to $3.48 (d), and the guide implies about $3.57 for the year (d, $2.90 plus $0.67). The gap between those numbers is the part of earnings that came from outside operations, and the filing, not the letter, is where its source can be checked.
Source: Netflix Q3 2026 shareholder letter. First-half values are nine-month figures less Q3 (d).
Forensic #3: Content Spending Is Running Ahead Of Amortization
| Item | Q3 2026 | Nine months 2026 |
|---|---|---|
| Additions to content assets | $5,160M | $14,934M |
| Amortization of content assets | $4,236M | $12,765M |
| Additions / amortization (d) | 1.22 times | 1.17 times |
| Company target, annual cash content spend / amortization | about 1.1 times | about 1.1 times |
| Streaming content obligations at Sept 30 | $25,223M | n/a |
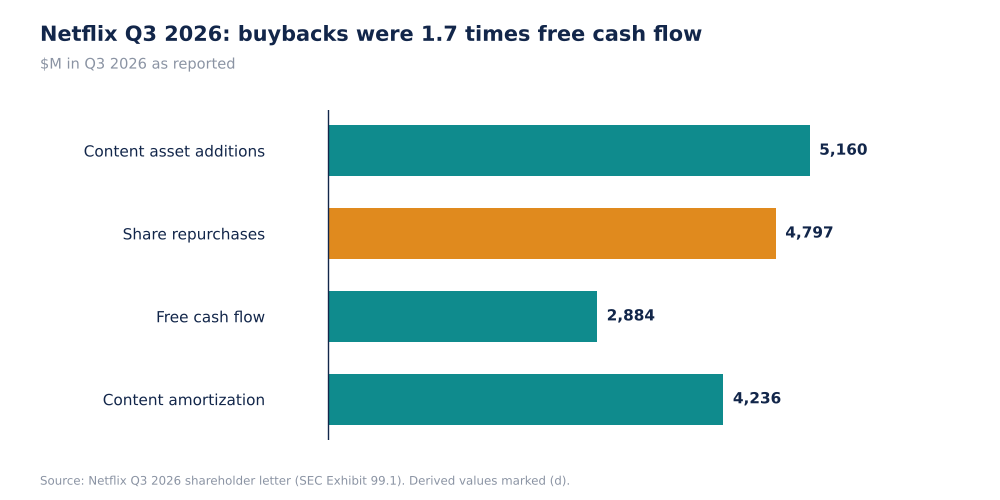
Netflix Q3 2026 Content, Buybacks And Free Cash Flow, $M (Self-Made)
The additions-to-amortization ratio is not the same measure as the cash content spend ratio the company targets, so the two should not be compared directly. They do point the same way: spending is above the expense recognised, and by $924M in Q3 alone (d). The cash side of this is already visible in the lower free cash flow target. Obligations of $25.2B are equal to about 4.9 quarters of Q3 additions (d).
Why it matters. Amortization is what reaches the income statement, so a business whose spend runs ahead of it will see operating margin pressure later even if margin is high now. This is one plausible reason for the lower free cash flow target alongside a higher operating income target, though the letter excerpt I read does not say so.
Source: Netflix Q3 2026 shareholder letter.
Forensic #4: Buybacks Exceeded Free Cash Flow
| Item | Figure |
|---|---|
| Q3 free cash flow | $2,884M |
| Q3 share repurchases | $4,797M (63.9M shares) |
| Repurchases / free cash flow (d) | 1.66 times |
| Average Q3 repurchase price (d) | about $75.06 |
| Remaining authorization | $22.3B |
| Cash / total debt (carrying) | $8,194M / $15,132M |
| Net debt as stated | $7,114M |
| Cash less debt by my subtraction (d) | $6,938M, a $176M gap I cannot explain from the extract |
| 2026 free cash flow target | about $12.0B (from $12.5B) |
| Implied Q4 free cash flow (d) | about $2.5B ($12.0B less $9.5B nine-month) |
Repurchases above free cash flow have to be funded from the balance sheet, and cash is $8.2B against $15.1B of debt. Management paid an average of about $75 a share in Q3 (d), against a TradingView price of $62.08, so the shares bought in Q3 are, at that price, worth about 17% less than was paid (d). The authorization remaining, $22.3B, is about 8.7% of the market cap (d).
Why it matters. Buybacks reduce the share count, which supports EPS: Q3 EPS growth of 47% is well above the 37% operating income growth because of that, among other items. The test of buyback value is the price paid against the cash generated per share, and at about $12B of free cash flow a year a $75 average cost is about 26 times free cash flow per share (d, using 4.2B diluted shares). The pace will have to track free cash flow or the cash balance.
Source: Netflix Q3 2026 shareholder letter. The net debt difference is as stated in my extraction of the release and should be checked against the balance sheet.
Valuation Snapshot
TradingView shows Netflix at $62.08, up 0.05% on the day, with a market cap of $254.92B, year to date down 34.05%, and an all-time high of $134.12 on Jun 30, 2025. The page says "market closed" and does not state whether prices are split-adjusted. The 4.2B diluted share count in the letter is consistent with that price level.
| Measure | Figure |
|---|---|
| Share price (TradingView) | $62.08 |
| Market cap (TradingView) | $254.92B |
| Price vs all-time high (d) | about -54% |
| Price / annualised Q3 EPS ($0.87 x 4) (d) | about 17.8 times |
| Price / implied 2026 EPS ($2.90 + $0.67) (d) | about 17.4 times |
| 2026 free cash flow target / market cap (d) | about 4.7% |
| Annualised Q3 repurchases / market cap (d) | about 7.5% |
| Market cap plus net debt / annualised Q3 operating income (d) | about 14.7 times |
These are mechanical ratios on one quarter and one guide, not forecasts. The multiple on implied 2026 EPS is flattered by the first-half non-operating items, so the operating income multiple is the cleaner one.
What has to be true. At about 14.7 times annualised operating income, the price assumes the Q3 profit level is closer to the norm than the Q4 guide suggests. If the 31.5% full-year margin is the right base, operating income of about $16.1B gives about 16.3 times (d). The valuation therefore depends on margin holding in the low 30s while revenue grows 12% to 13%.
Risks: What Would Break The Thesis
- Margin reversion. Q4 is guided 8.6 points below Q3, of which only about 1.2 points is the headcount charge.
- Advertising. The 2026 target was cut about 10%, which weakens one of the stated growth drivers.
- Cash conversion. Free cash flow was cut while operating income is guided higher, and content spending runs ahead of amortization.
- Buyback pace. Repurchases were 1.66 times free cash flow in Q3 and cannot persist without drawing on cash or debt.
- Earnings quality. First-half net income exceeded operating income, so nine-month EPS overstates the run-rate.
- Data limits. Paid memberships are not reported, and I read only the letter's financial statements and guidance.
The risks are mostly about the shape of earnings, not their direction. Revenue growth of 12% to 13% is guided and has been delivered. What can disappoint is how much of it reaches cash.
What To Watch Next
- Q4 operating margin against the 26.0% guide and the 120 basis point headcount effect.
- Whether the 2026 free cash flow target of about $12.0B is met or cut again.
- Advertising revenue against the lowered $2.7B target.
- Content additions against amortization, and the 1.1 times cash spend target.
- Buyback pace relative to free cash flow, and the cash balance of $8.2B.
- The source of first-half non-operating gains in the 10-Q.

Sandeep Gupta
Independent equity research analyst publishing forensic theses on US-listed stocks. MBA, Politecnico di Milano School of Management (Milan, Italy).
Get new research in your inbox
Subscribe to receive forensic equity research the moment it's published. Free, no spam.
Discussion
Be the first to comment.