
Investment Thesis
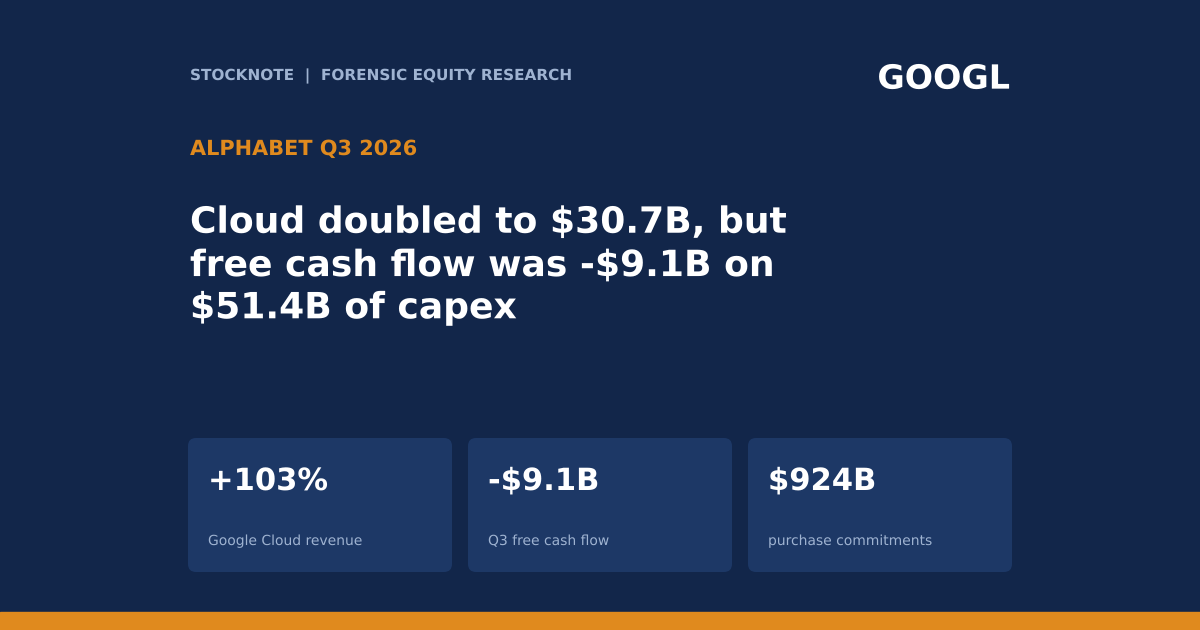
Alphabet grew third-quarter revenue 25% to $127.6B, with Google Cloud up 103% to $30.7B and operating income up 30% to $40.6B. The same call showed free cash flow of negative $9.1B, capital expenditures of $51.4B, $924B of future purchase commitments, and a reported net income decline driven by an $8.2B other expense, mainly an unrealized loss on the SpaceX investment.
- Revenue. Consolidated revenue was $127.6B (+25%), the 13th straight quarter of double-digit growth. Cost of revenue was $51.4B (+24%), operating expenses $35.6B (+20%), and operating income $40.6B (+30%), a 31.8% margin. The three lines add exactly to revenue.
- Cloud. Google Cloud revenue was $30.7B (+103%) with operating income of $11.1B, a 36.2% margin against 23.7% a year ago. Backlog was $561B, with just over 55% expected to be recognised within 24 months, about $309B (d).
- Growth source. Cloud supplied about $15.6B of the roughly $25.5B revenue increase, or about 61% (d). Google Services grew 11% to $96.3B.
- Below the line. Other income and expense was negative $8.2B, mainly an unrealized loss on the SpaceX investment. The CFO said net income and EPS fell as a result. A secondary summary lists EPS of $2.12 against $2.87.
- Cash. Operating cash flow was $42.3B and capex $51.4B, so free cash flow was negative $9.1B. A $5.2B cash payment of a 2018 EC fine is included in operating cash flow. Trailing 12-month free cash flow was $19.7B on $179.6B of operating cash flow (11%, d).
- Commitments. Future purchase commitments were $924B and pre-commencement leases and other obligations $152B, both maximum contractual amounts. Cash and marketable securities were $265.1B, including $90.4B of marketable equity securities. Long-term debt was $125.1B.
- Capex outlook. 2026 capex guidance is unchanged at $195B to $205B. The CFO said capex will rise significantly in 2027.
- This article contains no price target or rating. Every figure comes from the executives' spoken remarks on the Q3 call or a named source, and anything I calculated is marked (d).
Bottom line. Alphabet's operations are strong, with revenue up 25%, operating income up 30% and Cloud doubling. What changed is the cash profile: capex exceeds operating cash flow, free cash flow was negative for the quarter, and commitments of $924B dwarf cash. Investors should separate three questions: how durable Cloud growth is, how large 2027 capex becomes, and how much non-operating volatility from the SpaceX investment will affect reported net income.
Source: Alphabet Q3 2026 earnings call transcript, Motley Fool, Oct 29, 2026.
Q3 2026 At A Glance
| Metric (Q3 2026) | Result | Growth or margin |
|---|---|---|
| Consolidated revenue | $127.6B | +25% |
| Total cost of revenue | $51.4B | +24% (TAC $16.4B, +10%) |
| Total operating expenses | $35.6B | +20% (R&D +36%, G&A -17%) |
| Operating income | $40.6B | +30%; 31.8% margin |
| Google Services revenue / operating income | $96.3B / $39.2B | +11% / +17%; 40.7% margin |
| Search and other | $63.3B | +12% |
| YouTube ads | $11.2B | +9% |
| Network | $7.5B | +1% |
| Subscriptions, platforms and devices | $14.3B | +11% |
| Google Cloud revenue / operating income | $30.7B / $11.1B | +103%; 36.2% margin |
| Other Bets revenue / operating loss | $372M / -$2.0B | n/a |
| Alphabet-level operating loss | -$7.7B | n/a |
| Operating cash flow | $42.3B | n/a |
| Capital expenditures | $51.4B | n/a |
| Free cash flow | -$9.1B | TTM $19.7B |
| Quarterly dividend | $0.22 per share | payable in December |
Segment operating income adds to the total: $39.2B + $11.1B - $2.0B - $7.7B = $40.6B (d). Source: Alphabet Q3 2026 call transcript.
What The Market Believes vs. What The Data Actually Shows
| Belief | What the call shows |
|---|---|
| Search is under threat | Search and other revenue grew 12% to $63.3B, and Google Services operating income grew 17%. |
| Cloud is a side business | Cloud was 24% of revenue (d) and about 61% of the revenue increase (d). |
| Earnings are collapsing | Operating income rose 30%; the net income decline came from an $8.2B other expense, mainly an unrealized SpaceX loss. |
| Cash flow supports the spending | Q3 free cash flow was negative $9.1B, or negative about $3.9B excluding the $5.2B EC fine payment (d). |
| Capex has peaked | The CFO said capex will rise significantly in 2027; a secondary site reports a figure above $300B, which I did not confirm. |
The call gave no consensus. One secondary site (Grafa) reports EPS of $2.12 against an expectation near $2.99, and search-result headlines from other sites describe an after-hours share drop of roughly 8% to 12%; I did not open those pages or confirm either figure from a primary source.
The Q3 headline mixes two stories. Operating results were strong on revenue growth, but reported earnings fell because of an $8.2B non-operating loss. TradingView shows a fall of about 12.6% in one session after earnings, which suggests investors focused on cash flow and spending, not on the operating beat.
Forensic #1: Cloud Supplied About 61% Of The Revenue Increase
| Segment | Q3 2026 | Growth | Prior year (d) | Dollar change (d) | Share of increase (d) |
|---|---|---|---|---|---|
| Google Cloud | $30.7B | +103% | $15.1B | +$15.6B | 61% |
| Google Services | $96.3B | +11% | $86.8B | +$9.5B | 37% |
| Total | $127.6B | +25% | $102.1B | +$25.5B | 100% |
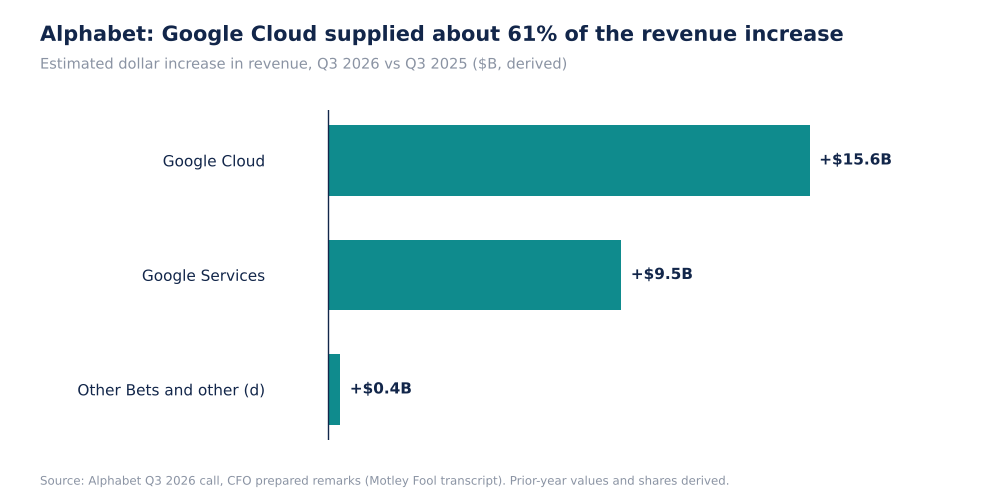
Alphabet Revenue Increase By Segment, Q3 2026 vs Q3 2025, $B (Self-Made)
Prior-year values are backed out of rounded growth rates, so they are approximate. Cloud operating income more than tripled to $11.1B, and its margin rose to 36.2% from 23.7%.
Why it matters. Cloud's 61% share of the revenue increase means growth quality depends on a segment whose margin rose to 36.2%. Cloud operating income rose about $7.5B on $15.6B of extra revenue (d), an incremental margin of about 48%, so growth is currently adding profit, not only revenue.
Source: Alphabet Q3 2026 call transcript.
Forensic #2: A $7.7B Alphabet-Level Operating Loss Sits Outside The Segments
| Component | Operating income (loss) |
|---|---|
| Google Services | $39.2B |
| Google Cloud | $11.1B |
| Other Bets | -$2.0B |
| Alphabet-level activities | -$7.7B |
| Total | $40.6B |
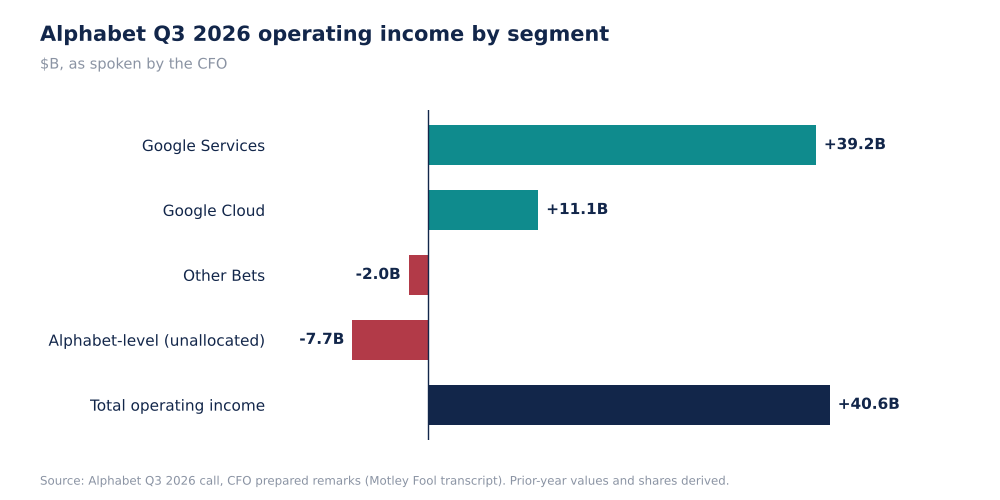
Alphabet Q3 2026 Operating Income By Segment, $B (Self-Made)
The transcript does not break down the $7.7B. Other cost of revenues grew 32% and R&D 36%, both faster than the 25% revenue growth, while G&A fell 17%. I do not link the $7.7B to any of these.
Why it matters. Google Services earns $39.2B at a 40.7% margin and funds the rest. The $7.7B Alphabet-level loss and the $2.0B Other Bets loss together absorb about 25% of Services operating income (d). Investors who value the company on segment profits should decide how to treat those costs.
Source: Alphabet Q3 2026 call transcript.
Forensic #3: Capex Exceeded Operating Cash Flow
| Cash flow | Q3 2026 | Trailing 12 months |
|---|---|---|
| Operating cash flow | $42.3B | $179.6B |
| Capital expenditures | $51.4B | about $159.9B (d) |
| Free cash flow | -$9.1B | $19.7B |
| Capex as % of revenue (d) | 40.3% | n/a |
| EC fine payment inside operating cash flow | $5.2B | n/a |
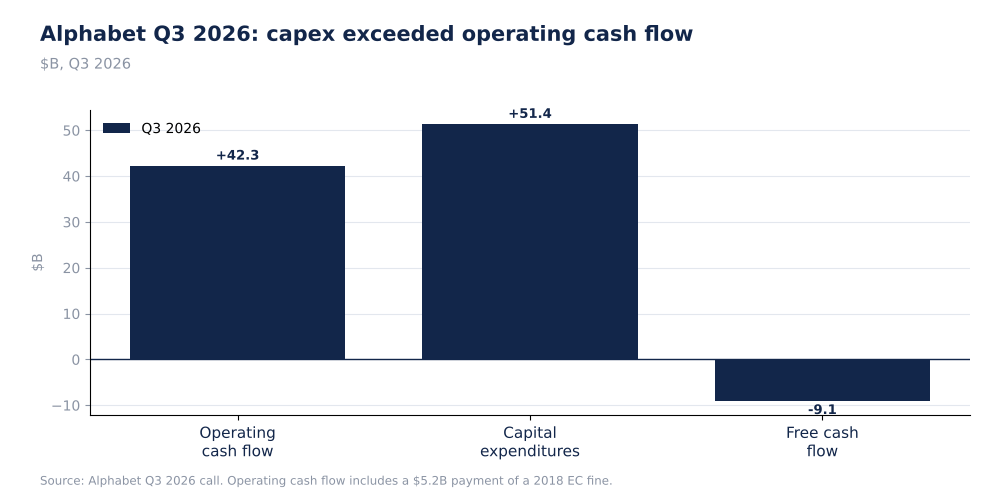
Alphabet Q3 2026 Operating Cash Flow, Capex And Free Cash Flow, $B (Self-Made)
About 65% of Q3 capex went to servers and networking (six-year useful life) and 35% to data centers (seven to 40 years). The call did not give a depreciation growth rate. Trailing free cash flow was 11% of trailing operating cash flow (d).
Why it matters. Capex was 40% of revenue and exceeded operating cash flow by $9.1B. Excluding the one-off $5.2B fine, free cash flow was still about -$3.9B (d). Trailing free cash flow of $19.7B is only 11% of trailing operating cash flow, which shows how much cash generation is going back into the business. A significant increase in 2027 capex would push this lower unless operating cash flow keeps growing.
Source: Alphabet Q3 2026 call transcript. Trailing capex is derived as operating cash flow minus free cash flow.
Forensic #4: Commitments Far Larger Than Cash
| Balance sheet item | Amount |
|---|---|
| Cash and marketable securities | $265.1B |
| of which marketable equity securities | $90.4B |
| Cash and debt securities excluding equity (d) | $174.7B |
| Long-term debt | $125.1B |
| Future purchase commitments (maximum) | $924B |
| Pre-commencement leases and other obligations | $152B |
| Cloud backlog | $561B |
The CFO said the commitments are maximum contractual amounts and some have variable pricing. Even so, purchase commitments are 3.5 times total cash and marketable securities (d). The SpaceX loss shows that the $90.4B of marketable equity securities can move reported income.
Why it matters. The $924B of purchase commitments is about 4.6 times the midpoint of the 2026 capex guide and 3.5 times cash and securities (d). They are maximum amounts and some have variable pricing, and the $561B Cloud backlog shows customers on the other side of part of this spending, though the two are not the same. Equity securities of $90.4B also mean part of the cash figure is market-exposed, as the SpaceX loss shows.
Source: Alphabet Q3 2026 call transcript.
Valuation Snapshot
TradingView shows Alphabet Class A at $279.84 with a market cap of about $3.46T. Its key facts say GOOG fell about 12.6% in one session after earnings. The price is about 31% below the May 18, 2026 high of $408.61.
| Measure | Figure |
|---|---|
| Share price (TradingView) | $279.84 |
| Market cap (TradingView) | about $3.46T |
| P/E, trailing (TradingView) | 17.0 |
| Below the May 18 all-time high of $408.61 (d) | about 31% |
| Market cap / annualised Q3 operating income of $162.4B (d) | about 21.3x |
| Market cap / trailing operating cash flow of $179.6B (d) | about 19.3x |
| Trailing free cash flow yield, $19.7B (d) | about 0.6% |
| 2026 capex guide midpoint of $200B as % of market cap (d) | about 5.8% |
The market sold the stock after the report even though operating income rose 30%. The numbers that explain it are the negative Q3 free cash flow, the $51.4B quarterly capex, and a trailing free cash flow yield of about 0.6%.
What has to be true. At about 21 times annualised operating income and a 0.6% trailing free cash flow yield, the stock needs Cloud growth and margin to continue while capex growth slows relative to revenue. The 31% distance from the May high shows how much sentiment has already adjusted.
Risks: What Would Break The Thesis
- Cloud growth fades. About 61% of the revenue increase came from one segment.
- Capex outruns cash flow. Capex is above operating cash flow and will rise significantly in 2027.
- Commitments. $924B of maximum purchase commitments against $265.1B of cash and securities.
- Search pressure. The CFO said Q4 Search growth will be pressured by lapping an acceleration of about a couple of points.
- Data limits. I did not read the release or 10-Q. Net income and EPS were not spoken.
The principal risk is that capex and commitments grow faster than revenue. The offsetting evidence is the $561B backlog, with about 55% expected to be recognised within 24 months, which gives some visibility.
What To Watch Next
- The 10-Q for net income, the SpaceX loss and the breakdown of the $7.7B Alphabet-level loss.
- Cloud backlog conversion against the 55% in 24 months.
- 2027 capex guidance against 2026's $195B to $205B.
- Free cash flow after the one-off $5.2B payment.
- Search growth against 12%.

Sandeep Gupta
Independent equity research analyst publishing forensic theses on US-listed stocks. MBA, Politecnico di Milano School of Management (Milan, Italy).
Get new research in your inbox
Subscribe to receive forensic equity research the moment it's published. Free, no spam.
Discussion
Be the first to comment.