
Investment Thesis
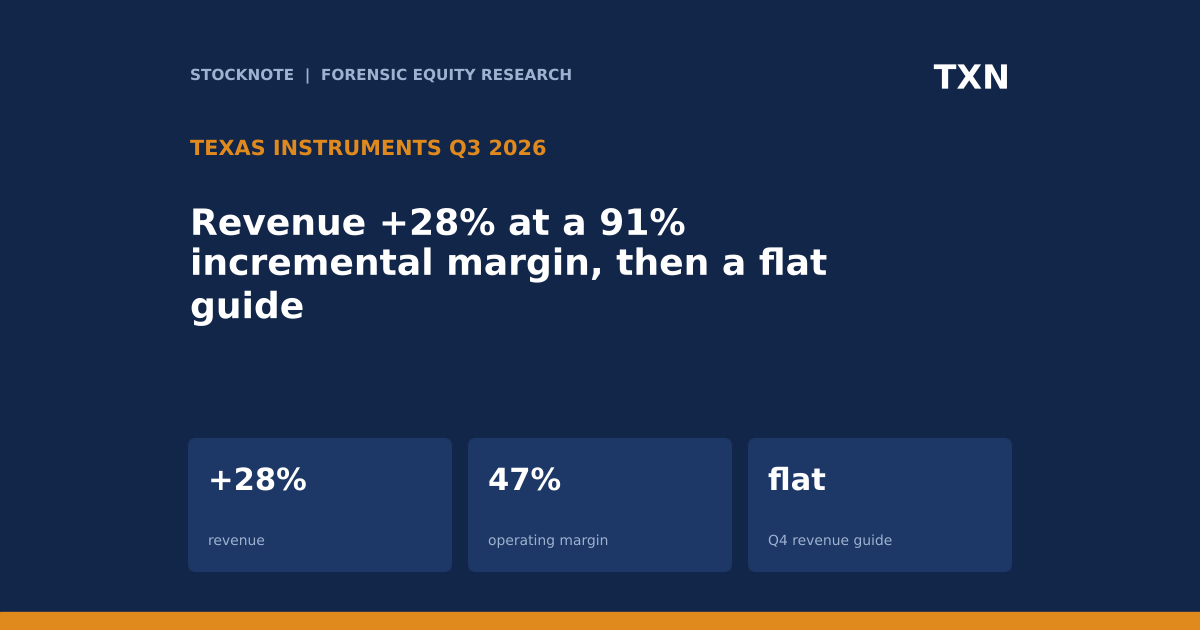
Texas Instruments reported third-quarter revenue of $6.06B, up 28% from a year ago and 11% from Q2, with operating profit of $2,874M (47% of revenue, up 73%) and EPS of $2.62, up 77%. By my arithmetic about 91% of the year-over-year revenue increase became operating profit (d). Data center revenue roughly doubled, and management guided Q4 revenue to $5.8B to $6.3B, which is flat at the midpoint. The investor question is how much of an upturn this is, and how much of it depends on one end market.
- Results. Revenue $6.06B (+28% year over year, +11% sequentially). Gross profit $3.9B, 64% of revenue, up 280 basis points sequentially. Operating profit $2,874M (+73%), net income $2,425M (+78%), EPS $2.62 (+77%).
- Segments. Analog $4,911M (+32%), Embedded Processing $858M (+21%), Other down 6%.
- End markets. Industrial up more than 40% (about 10% sequentially), automotive up in the mid-teens, data center up about 95% and about 13% of revenue, personal electronics about flat, communications equipment up.
- Cash. Q3 operating cash flow $3.4B and capex $463M. Trailing-twelve-month free cash flow $8,422M including $1.6B of CHIPS Act incentives. The dividend was raised 7% to $1.52 a quarter.
- Balance sheet. Inventory $4,672M (194 days, down two days sequentially). Cash and short-term investments $8.1B, total debt $13.65B, with $500M repaid in Q3.
- Q4 guide. Revenue $5.8B to $6.3B, EPS $2.45 to $2.79, tax rate about 13%, operating expenses flat to slightly up.
- Capex. 2026 capex is guided to $2B to $3B, with management aiming for the higher end.
- This article contains no price target or rating. The source is a machine-generated transcript, and anything I calculated is marked (d).
Bottom line. This is a strong cyclical recovery with unusually high operating leverage, and the numbers are plain. The investor question is what is priced in. The stock has risen about 77% this year and trades at about 29 times annualised Q3 EPS (d), while the Q4 guide midpoint is the same revenue and the same EPS as Q3 (d). A flat guide after a 28% increase is either conservative or the first sign that the sequential gains are slowing.
Source: Texas Instruments Q3 2026 earnings call transcript, Webull.
Q3 2026 At A Glance
| Metric (Q3 2026) | Result | Change |
|---|---|---|
| Revenue | $6.06B | +28% year over year, +11% sequentially |
| Gross profit / margin | $3.9B / 64% | +280 bp sequentially |
| Operating profit / margin | $2,874M / 47% | +73% |
| Net income | $2,425M | +78% |
| EPS | $2.62 | +77% |
| Analog / Embedded Processing | $4,911M / $858M | +32% / +21% |
| Data center share of revenue | about 13% | revenue +95% |
| Operating cash flow / capex | $3.4B / $463M | n/a |
| Inventory | $4,672M, 194 days | -2 days sequentially |
Source: Texas Instruments Q3 2026 call transcript. The transcript's operating expense line is garbled, so I derive expenses from gross profit less operating profit.
What The Market Believes vs. What The Data Actually Shows
| Belief | What the call shows |
|---|---|
| Growth is broad-based | Industrial rose over 40%, automotive mid-teens and data center 95%, but personal electronics was about flat and Other fell 6%. |
| Data center is a small part of the story | It was about 13% of revenue and about $0.38B (d) of the $1.33B year-over-year increase, or about 29%. |
| The recovery is accelerating | Sequential growth was 11%, but Q4 revenue is guided to a midpoint of $6.05B, about flat on Q3 (d). |
| Free cash flow has jumped | Trailing free cash flow of $8.4B includes $1.6B of CHIPS Act incentives, so $6.8B (d) comes from operations less capex. |
| Inventory is a risk | Inventory days fell two days sequentially to 194, with inventory up only $67M. |
The usual summary is a broad cyclical rebound. It is broad, but it is also concentrated: by my arithmetic, revenue excluding data center grew about 22% (d), and data center added about 29% of the increase while representing 13% of revenue. Both numbers are strong. The difference matters for how durable the growth is, since data center demand depends on a small number of large customers' spending.
Forensic #1: A 91% Incremental Margin
| Item | Q3 2025 (d) | Q3 2026 | Change (d) |
|---|---|---|---|
| Revenue | about $4.73B | $6.06B | +$1.33B |
| Operating profit | about $1.66B | $2,874M | +$1.21B |
| Operating margin | about 35.1% | 47.4% | +12.3 pts |
| Incremental operating margin | n/a | n/a | about 91% |
| Operating expenses (gross profit less operating profit) | n/a | about $1.0B | n/a |
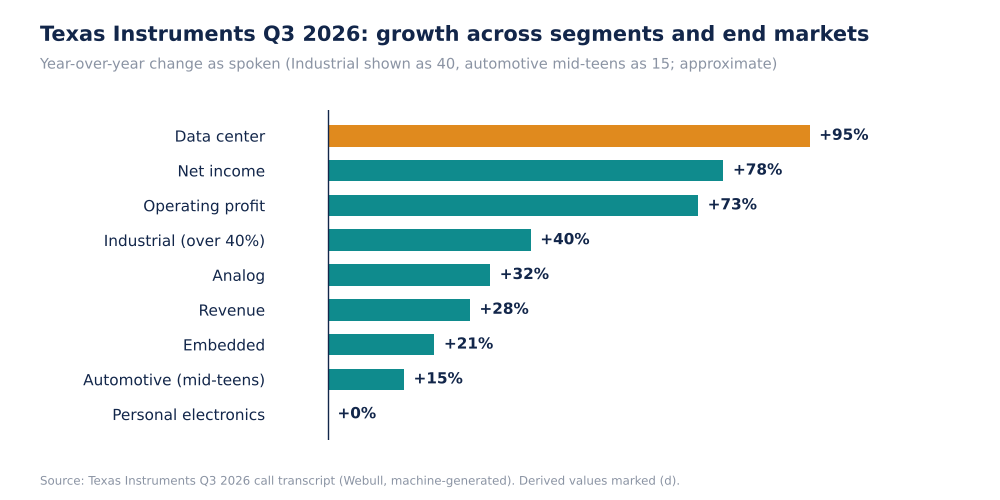
Texas Instruments Q3 2026 Year-Over-Year Growth, % (Self-Made)
Operating expenses of about $1.0B (d) were about 17% of revenue, so almost every dollar of extra gross profit reached operating profit. Prior-year figures are backed out of the stated growth rates and are approximate. Management said operating expenses are expected to be flat to slightly up in Q4, which keeps this leverage for another quarter.
Why it matters. High incremental margins work in both directions. If revenue fell 10% from here, the same arithmetic would remove profit at a similar rate, so a 47% operating margin is a peak-cycle figure, not a base. Net income is also helped by a guided tax rate of about 13%.
Source: Texas Instruments Q3 2026 call transcript. Prior-year dollars are derived from stated growth rates.
Forensic #2: Data Center Is About 13% Of Revenue And 29% Of The Growth
| Item | Figure |
|---|---|
| Data center revenue, Q3 2026 (d) | about $0.79B (13% of $6.06B) |
| Data center revenue, Q3 2025 (d) | about $0.40B (from +95%) |
| Data center contribution to the increase (d) | about $0.38B of $1.33B, or 29% |
| Revenue excluding data center, Q3 2026 (d) | about $5.27B |
| Revenue excluding data center, Q3 2025 (d) | about $4.33B |
| Growth excluding data center (d) | about 22% |
| Data center sequential growth | about 20% |
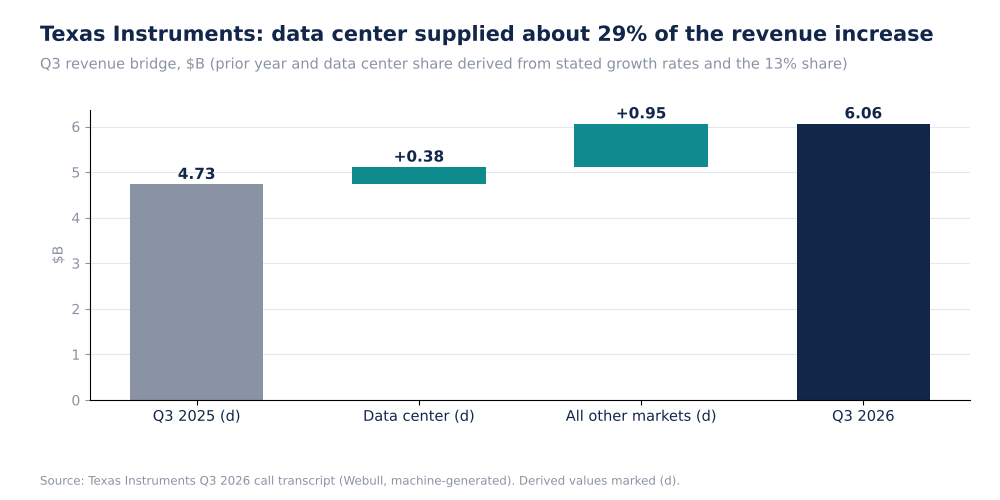
Texas Instruments Q3 Revenue Bridge, $B (Self-Made)
Even without data center, revenue grew about 22% (d), which is a recovery in its own right, led by industrial (over 40%). Data center is the end market with the fastest growth and the highest sequential rate, at about 20%. The 13% share and 95% growth are spoken figures, and the dollar amounts are my arithmetic on rounded numbers, so treat them as estimates of the order of magnitude.
Why it matters. An investor paying a premium multiple is paying for durable growth. Industrial, which rose over 40% year over year but also about 10% sequentially, may reflect a recovery from a lower base, while data center is a newer demand source. The two have different durability, and the call does not break out how much of the data center demand is long-term.
Source: Texas Instruments Q3 2026 call transcript. Dollar figures are derived from rounded spoken percentages.
Forensic #3: Cash Flow Includes $1.6B Of CHIPS Incentives
| Item | Figure |
|---|---|
| Q3 operating cash flow | $3.4B |
| Trailing-twelve-month operating cash flow | $9,896M |
| Trailing-twelve-month capex | $2,578M |
| Trailing-twelve-month free cash flow | $8,422M |
| Of which CHIPS Act incentives | $1.6B |
| Free cash flow excluding CHIPS incentives (d) | about $6.8B |
| Returned to owners, trailing twelve months | $5.8B (about 69% of free cash flow, d) |
| 2026 capex guide | $2B to $3B, higher end targeted |
| Q3 dividends paid / new quarterly rate | $1,298M / $1.52 a share |
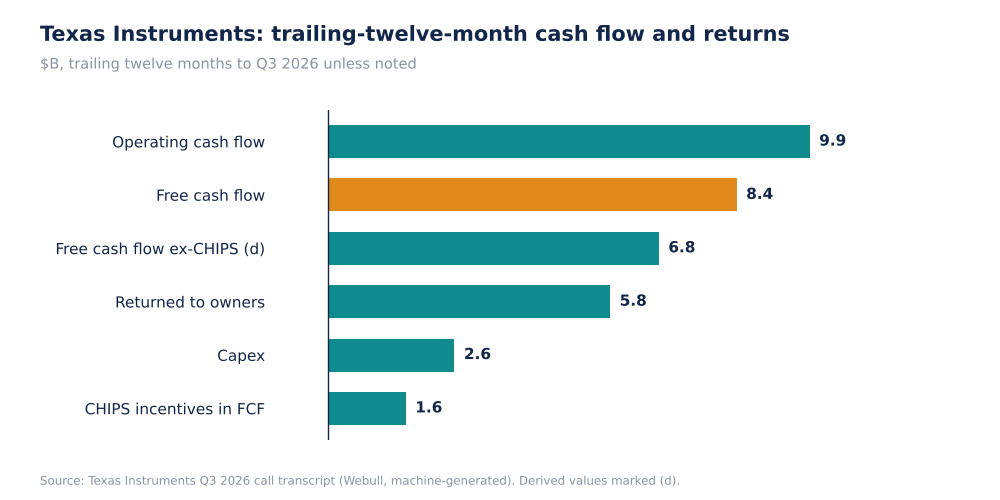
Texas Instruments Trailing-Twelve-Month Cash Flow, $B (Self-Made)
Free cash flow including incentives is 23% higher than excluding them (d), so the quality of the headline depends on whether such incentives continue. Capex of $463M in Q3 is about 7.6% of revenue (d), well below the $2B to $3B annual guide pace if Q3 is typical: $463M times four is $1.85B (d), so the higher end of the guide would require a step up in Q4 or in later quarters. The rate of the dividend increase, 7%, is below the rate of earnings growth of 77%.
Why it matters. The company is moving from a heavy capital-spending phase toward harvesting, and the free cash flow figure reflects this. The decision for investors is whether to value the stock on $8.4B or $6.8B of free cash flow, and whether capex stays near $2B or rises toward $3B.
Source: Texas Instruments Q3 2026 call transcript. Ratios are derived.
Forensic #4: The Flat Q4 Guide And The Inventory Position
| Item | Q3 2026 actual | Q4 2026 guide | Comparison (d) |
|---|---|---|---|
| Revenue | $6.06B | $5.8B to $6.3B | midpoint $6.05B, about flat |
| EPS | $2.62 | $2.45 to $2.79 | midpoint $2.62, flat |
| Revenue range vs Q3 (d) | n/a | -4% to +4% | n/a |
| Operating expenses | about $1.0B (d) | flat to slightly up | n/a |
| Inventory | $4,672M, 194 days | n/a | up $67M, down 2 days sequentially |
| Tax rate | n/a | about 13% | n/a |
The Q4 range is symmetric around Q3, so management is not guiding to growth or to decline. Inventory days of 194 are high in absolute terms for a company that sells into industrial and automotive markets. The decline in days comes from rising revenue, since inventory dollars rose $67M.
Why it matters. A guide that is flat after an 11% sequential gain is the main reason to pause. The guide range of about 4% either side of Q3 leaves room for a further increase or a decline, but the stock's year-to-date gain means that investors are positioned for continued growth. Q4 results will show whether Q3 was a step or a trend.
Source: Texas Instruments Q3 2026 call transcript.
Valuation Snapshot
TradingView shows Texas Instruments at $308.85 with a market cap of $283.11B and a year-to-date gain of 77.08%. The page's day-change figures conflict (-0.61% in one place and +0.30% in another), so I do not use them. The all-time high shown is $334.03 on Jun 22, 2026.
| Measure | Figure |
|---|---|
| Share price (TradingView) | $308.85 |
| Market cap (TradingView) | $283.11B |
| Price vs all-time high (d) | about -7.5% |
| Price / annualised Q3 EPS ($2.62 x 4) (d) | about 29.5 times |
| Trailing free cash flow / market cap (d) | about 3.0% (2.4% excluding CHIPS incentives) |
| Dividend ($1.52 x 4) / price (d) | about 2.0% |
| Net debt (debt $13.65B less cash and investments $8.1B) / market cap (d) | about 2.0% |
Annualising one quarter at a cyclical high overstates normal earnings, and using the Q4 guide midpoint gives the same multiple because it is flat on Q3. The multiple is therefore a multiple of peak-quarter earnings.
What has to be true. At about 29 times annualised EPS and 7.5% below its high, the market is paying for the Q3 earnings level to persist or grow as capacity investments mature. That needs industrial recovery to continue, data center demand to stay strong, and margins to hold near 47% even as depreciation from new capacity rises.
Risks: What Would Break The Thesis
- Cyclical peak. A 91% incremental margin will reverse if revenue falls.
- Data center concentration. About 29% of the revenue increase from about 13% of revenue.
- Flat guide. Q4 revenue and EPS are guided flat at the midpoint after an 11% sequential gain.
- Incentive-dependent cash flow. $1.6B of CHIPS incentives sit in trailing free cash flow.
- Capex and depreciation. A guide of $2B to $3B for 2026 raises future depreciation.
- Data limits. The transcript is machine-generated and the operating expense line is garbled; I did not read the 10-Q.
The most likely way for the thesis to be wrong is gradual: sequential growth turning flat while valuation still assumes continued growth. Each risk here is visible in the next quarter's guide.
What To Watch Next
- Q4 revenue against the $5.8B to $6.3B range and EPS against $2.45 to $2.79.
- Data center revenue share against 13% and its growth against 95%.
- Industrial sequential growth after about 10% in Q3.
- Operating expenses against the flat-to-slightly-up guide, and gross margin against 64%.
- Capex pace against the $2B to $3B guide.
- Inventory days against 194, and CHIPS incentives in cash flow.

Sandeep Gupta
Independent equity research analyst publishing forensic theses on US-listed stocks. MBA, Politecnico di Milano School of Management (Milan, Italy).
Get new research in your inbox
Subscribe to receive forensic equity research the moment it's published. Free, no spam.
Discussion
Be the first to comment.