
Investment Thesis
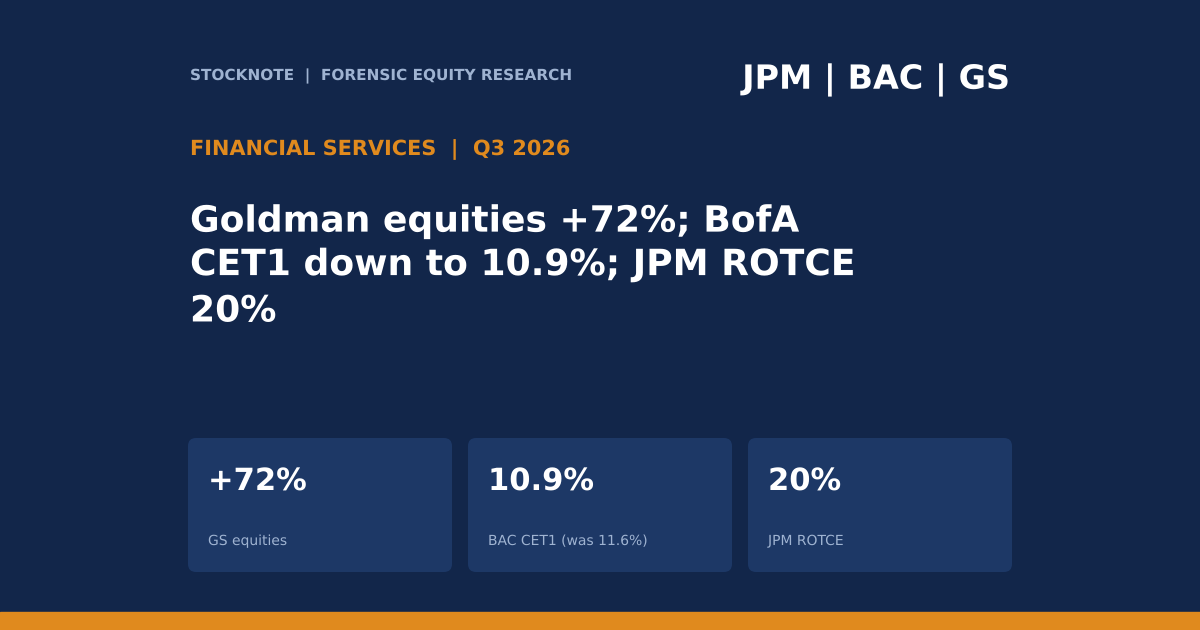
Three of the largest US banks reported third-quarter 2026 results that look alike at the top (strong profits) and different underneath. Goldman Sachs earned net revenues of $18,679 million (+23%) and net earnings of $5,294 million (+29%), with equities revenue up 72%. Bank of America's revenue grew 3% to $30.0 billion, with net interest income up 8% and a $1.2 billion regulatory settlement cutting net income to $6.9 billion from an adjusted $8.1 billion. JPMorgan earned $15.3 billion with a 20% return on tangible common equity. The comparison shows how much of a bank's earnings is determined by what it sells (trading, advice, lending), and how much capital it keeps.
- Goldman Sachs. Net revenues $18,679M (+23%); Global Banking and Markets $13,458M; Asset and Wealth Management $5,051M (+14%); Platform Solutions $170M (-72%); net earnings $5,294M; EPS $17.01; ROE 18.7%; CET1 12.4%.
- Bank of America. Revenue $30.0B (+3%); net income $6.9B (adjusted $8.1B); EPS $0.91 (adjusted $1.08); net interest income $16.4B (+8%); CET1 10.9% (11.6% a year earlier); ROTCE 12.6% (adjusted 14.9%).
- JPMorgan. Net income $15.3B; managed revenue $50.9B; net interest income $27.1B; Markets $10.3B; ROTCE 20%; CET1 13.9% (from Stocknote's earlier article).
- This article contains no rating, price target or investment advice. Derived figures are marked (d).
Bottom line. A bank's quarterly profit is a blend of three engines: interest margin, fees and trading. The three banks weigh them differently, which is why they can report the same market environment and different growth rates. Goldman, with 53% (d) of revenue from equities and fixed income trading, is the most exposed to market activity. Bank of America, with net interest income at 55% (d) of revenue, is the most exposed to the rate environment, and its common equity ratio is falling as it returns capital.
Sources: Goldman Sachs Q3 2026 8-K; Bank of America Q3 2026 8-K; JPMorgan data from Stocknote's Q3 2026 JPMorgan article.
Q3 2026 At A Glance
| Q3 2026 | Goldman Sachs | Bank of America | JPMorgan |
|---|---|---|---|
| Revenue | $18,679M (+23%) | $30.0B (+3%) | $50.9B managed |
| Net income | $5,294M (+29%) | $6.9B (adj. $8.1B) | $15.3B |
| EPS | $17.01 | $0.91 (adj. $1.08) | n/a here |
| Return measure | ROE 18.7% | ROTCE 12.6% (adj. 14.9%) | ROTCE 20% |
| CET1 ratio | 12.4% | 10.9% (was 11.6%) | 13.9% |
| Provision | $368M | $1.27B | $2,743M |
| Net interest income | n/a | $16.4B (+8%) | $27.1B |
| Trading revenue | Equities $6,441M; FICC $3,471M | S&T $5.1B | Markets $10.3B |
Sources: Goldman; BofA; Stocknote JPMorgan article. n/a = not in my extract.
What The Market Believes vs. What The Data Actually Shows
| Belief | What the data show |
|---|---|
| A trading boom lifts all banks | Goldman's equities rose 72% but Bank of America's FICC fell 17% and its investment banking fees fell 11%; the boom was uneven. |
| Higher rates help every bank | Bank of America's net interest income rose 8% and its yield 15 basis points to 2.16%, but its CET1 ratio fell 0.7 points to 10.9%. |
| Reported profit is comparable | Bank of America's net income was cut by a $1.2B non-deductible settlement ($0.17 a share); excluding it, EPS was $1.08 against $0.91. |
| Efficiency is similar | Goldman's expense-to-revenue ratio is 60.5% (d); Bank of America's is 66% (62% adjusted). |
| Capital return is well covered | Bank of America returned $8.2B (d) against $6.9B of net income; Goldman returned $4.49B (d) against $5.294B. |
Forensic #1: Revenue Mix
| Q3 2026 (d) | Goldman Sachs | JPMorgan | Bank of America |
|---|---|---|---|
| Trading revenue | $9,912M (equities + FICC) | $10.3B (Markets) | $5.1B (S&T) |
| Total revenue | $18,679M | $50.9B | $30.0B |
| Trading as % of revenue | 53.1% | 20.2% | 17.0% |
| Net interest income as % of revenue | n/a | 53% | 55% |
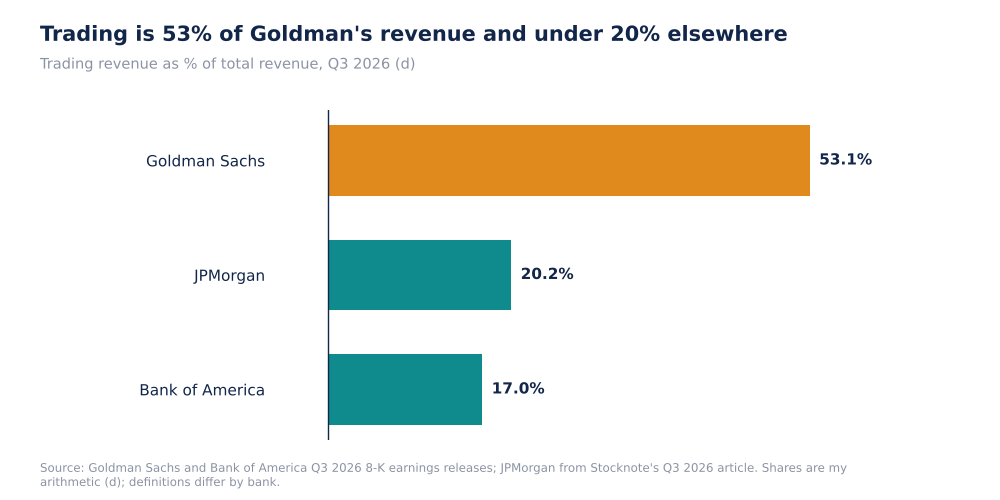
Trading Revenue As A Share Of Total Revenue, Q3 2026 (Self-Made, d)
Definitions differ: Goldman's figure is equities plus fixed income, currencies and commodities (FICC) within net revenues; JPMorgan's is Markets on a managed basis; Bank of America's is sales and trading. Even allowing for that, Goldman's share is two and a half times the others'. Goldman also derives $5,051 million (27%, d) of revenue from asset and wealth management and only $170 million from Platform Solutions, which fell 72%.
Why it matters. A bank with half its revenue from trading has earnings that move with market volumes, and operating leverage works both ways. A bank with more than half from net interest income depends on the yield curve and deposit costs.
Sources: Goldman; BofA; Stocknote JPMorgan article. Shares are my arithmetic (d).
Forensic #2: Where The Growth Came From
| Q3 2026 y/y | Goldman Sachs | Bank of America |
|---|---|---|
| Equities | +72% ($6,441M) | +11% ($2.5B) |
| FICC | -1% ($3,471M) | -17% ($2.6B) |
| Investment banking fees | +21% ($3,224M) | -11% ($1.8B) |
| Net interest income | n/a | +8% ($16.4B) |
| Asset and wealth management | +14% ($5,051M) | n/a |
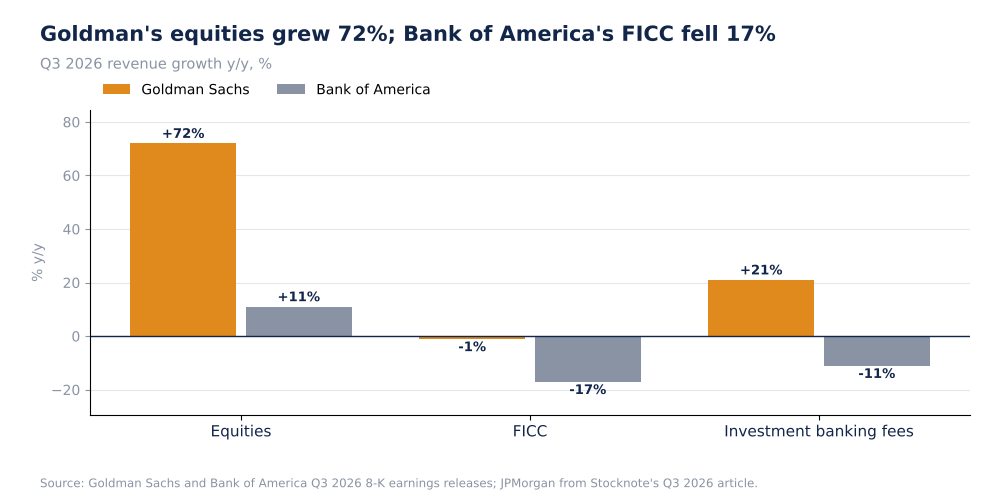
Revenue Growth By Business, Goldman Sachs Vs Bank Of America, Q3 2026 (Self-Made)
Both banks grew equities and both saw FICC fall, but the magnitudes differ widely. Goldman's equities growth of 72% was 6.5 times (d) Bank of America's 11%. Goldman's investment banking fees rose 21% while Bank of America's fell 11%. These gaps are between different client franchises and not just different markets; the extracts do not explain them, so I do not try to.
Why it matters. Industry data on activity can be strong while an individual bank's revenue falls, so the franchise mix matters more than the market's headline numbers when estimating earnings.
Sources: Goldman; BofA. Ratio is my arithmetic (d).
Forensic #3: Efficiency And Quality Of Earnings
| Q3 2026 | Goldman Sachs | Bank of America |
|---|---|---|
| Operating expenses | $11,308M | $19.7B (adj. $18.5B) |
| Expense / revenue (d unless stated) | 60.5% | 66% (adj. 62%) |
| Provision for credit losses | $368M | $1.27B |
| Pre-provision profit (d) | $7,371M | $10.3B |
| Pre-tax earnings (d) | $7,003M | n/a |
| Implied tax rate (d) | 24.4% | n/a (settlement non-deductible) |
| Net charge-off ratio | n/a | 0.44% |
Goldman's pre-tax earnings are $7,003 million (d: net revenues less expenses less provision), and its implied tax rate is 24.4% (d). Bank of America's regulatory settlement of $1.2 billion is not deductible, so reported earnings understate the underlying run-rate by $0.17 a share; adjusted net income was $8.1 billion. The adjusted efficiency ratio of 62% is the like-for-like figure for operations. Goldman's compensation ratio is about 27.4% (d) of net revenues.
Why it matters. The settlement is a real cost to shareholders even if it is excluded from adjusted earnings, and adjusted figures that exclude it should be read with that in mind. Bank of America's gap between reported and adjusted return on tangible equity (12.6% against 14.9%) is 2.3 points (d).
Sources: Goldman; BofA. Derived figures marked (d).
Forensic #4: Capital And Returns
| Q3 2026 | Goldman Sachs | Bank of America | JPMorgan |
|---|---|---|---|
| CET1 ratio | 12.4% | 10.9% (was 11.6%) | 13.9% |
| Buybacks | $3.00B | $6.0B | n/a here |
| Dividends | $1.49B | $2.2B | n/a here |
| Total returned (d) | $4.49B | $8.2B | 33% of earnings payout (d, Stocknote) |
| Returned / net income (d) | 85% | 119% (101% of adjusted) | 33% |
| Share count | n/a | 6.92B vs 7.33B (-5.6%, d) | n/a here |
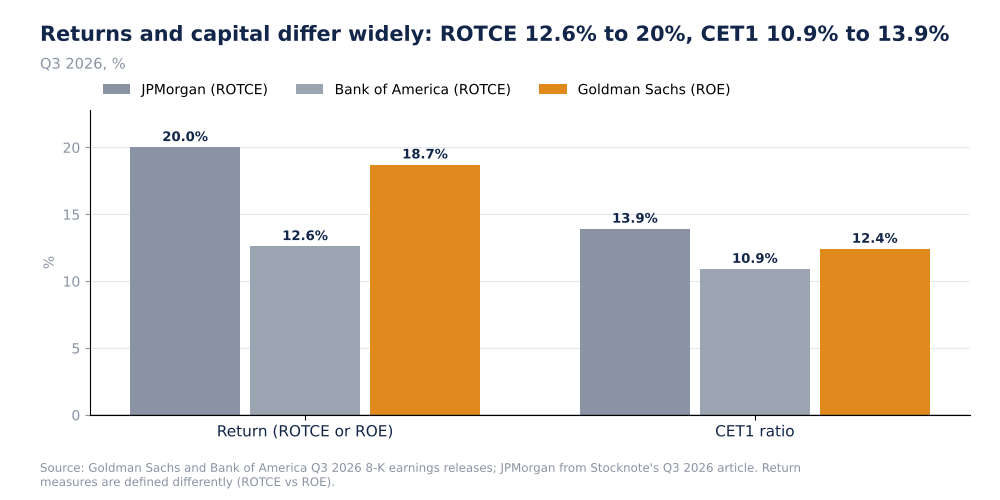
Return On Equity And CET1 Ratio, Q3 2026 (Self-Made, Company Data)
Bank of America paid out 119% of reported net income (d) and its share count fell 5.6% (d) in a year. Its CET1 ratio fell from 11.6% to 10.9%. The three CET1 ratios are 10.9%, 12.4% and 13.9%, a spread of 3.0 points (d). Capital ratios are compared with regulatory requirements that differ by bank and are not in my extracts, so a lower ratio does not by itself mean a bank is weaker. ROTCE and ROE are also defined differently, so the 20%, 12.6% and 18.7% returns are not strictly comparable.
Why it matters. The banks with the highest ratios have the most room to buy back stock; the bank returning more than its reported earnings is running capital down toward its requirement. That is a legitimate choice but it limits flexibility if credit costs rise.
Sources: Goldman; BofA; Stocknote JPMorgan article. Ratios are my arithmetic (d).
Valuation Snapshot
I have no share prices for the three banks in my sources, so I do not calculate price-to-earnings or price-to-tangible-book multiples. The inputs an investor needs are the returns and capital in the tables above.
What has to be true. A bank earns a premium to book value only if its return on equity exceeds its cost of equity over time. JPMorgan reports ROTCE of 20%, Goldman ROE of 18.7% and Bank of America ROTCE of 12.6% (14.9% adjusted). I have no cost of equity estimate in my sources, so this is a comparison among the three and not a valuation.
Risks: What Would Break The Thesis
- Definitions. ROE versus ROTCE; managed versus reported revenue; different trading definitions.
- One quarter. Trading revenue is volatile.
- Requirements. CET1 requirements by bank are not in my extracts.
- Missing JPMorgan detail. Buybacks and dividends are not in this article's extract.
- Credit. Bank of America's net charge-off ratio is 0.44%, and provisions of $1.27B and $368M could rise.
The reading would be wrong if Goldman's trading strength reverses next quarter or if Bank of America's net interest income growth stalls.
What To Watch Next
- Fourth-quarter trading revenue at each bank.
- Bank of America's CET1 ratio against 10.9%.
- Net interest income growth against 8% at Bank of America.
- Goldman's investment banking pipeline after +21%.
- Credit provisions and net charge-offs.
- Capital return announcements and buyback pace.

Sandeep Gupta
Independent equity research analyst publishing forensic theses on US-listed stocks. MBA, Politecnico di Milano School of Management (Milan, Italy).
Get new research in your inbox
Subscribe to receive forensic equity research the moment it's published. Free, no spam.
Discussion
Be the first to comment.