
Investment Thesis
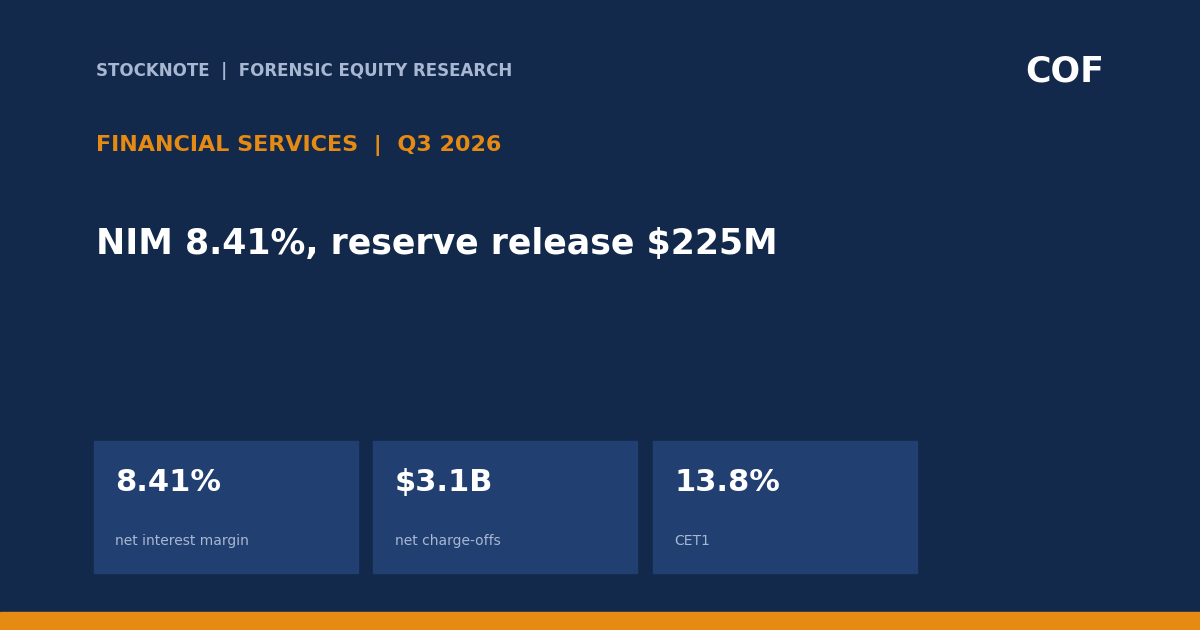
Capital One earned $5.61 per diluted share in Q3 2026 and $6.69 after acquisition amortization and Discover/Brex integration costs. Sequential operating momentum improved: net revenue rose 3% to $16.3B, pre-provision earnings rose 10% to $7.5B and net interest margin expanded 40 basis points to 8.41%. Credit remains the counterweight: net charge-offs were $3.121B and the provision was $2.896B because a $225M reserve release offset part of current losses.
- Revenue. $16,344M, +3% q/q and +6% y/y.
- NIM. 8.41%, +40 bp q/q and +5 bp y/y.
- Credit. Net charge-offs $3,121M; provision $2,896M; reserve release $225M.
- Adjustments. $0.60 EPS acquisition amortization, $0.42 Discover integration, $0.06 Brex integration.
- Cross-reference. See “US Household Debt Is $18.77 Trillion” for system-wide delinquency context and the Q3 bank articles for margin and capital comparisons.
- This article contains no rating, price target or investment advice. Derived figures are marked (d).
Bottom line. The earnings engine strengthened before credit: revenue rose, expenses fell and margin expanded. But adjusted EPS adds back $1.08 per share of acquisition-related costs, and the reserve release means provision expense understated net charge-offs by $225M.
Source: Capital One Q3 2026 financial supplement (8-K Ex. 99.2).
Q3 2026 At A Glance
| Measure | Q3 2026 | Q2 2026 | Q3 2025 |
|---|---|---|---|
| Net revenue | $16,344M | $15,850M | $15,359M |
| NIM | 8.41% | 8.01% | 8.36% |
| Provision | $2,916M | $2,989M | $2,714M |
| GAAP EPS | $5.61 | $4.73 | $4.83 |
| CET1 | 13.8% | 13.7% | 14.4% |
Source: Capital One Q3 2026 financial supplement (8-K Ex. 99.2). Derived figures are marked (d).
What The Market Believes vs. What The Data Actually Shows
| Belief | What the data show |
|---|---|
| Adjusted EPS is the clean run rate | The $1.08 per-share bridge excludes acquisition amortization and integration costs that may persist during the combination. |
| Credit costs fell because borrowers improved | Provision fell sequentially partly because a $225M reserve release offset charge-offs. |
| The Discover deal diluted operating performance | Net revenue rose 3% while expenses fell 2% sequentially, lifting pre-provision earnings 10%. |
| Capital is unchanged | CET1 rose 10 bp sequentially but remained 60 bp below Q3 2025. |
Forensic #1: Net Interest Margin And Operating Leverage
Banks create operating leverage when revenue grows faster than non-interest expense. NIM adds the pricing dimension by measuring net interest income relative to earning assets.
| Quarter | NIM |
|---|---|
| Q3 2025 | 8.36% |
| Q4 2025 | 8.26% |
| Q1 2026 | 7.87% |
| Q2 2026 | 8.01% |
| Q3 2026 | 8.41% |
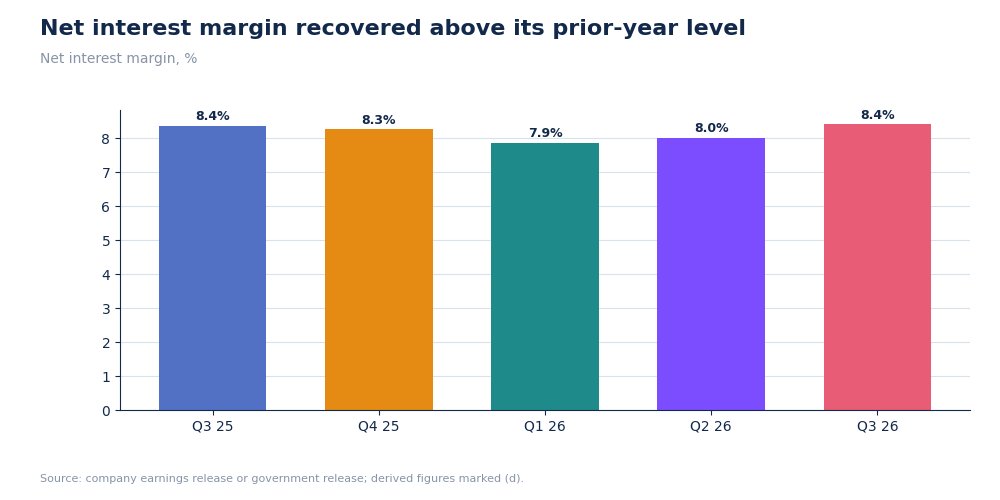
Capital One net interest margin by quarter
NIM recovered 54 bp from the Q1 trough (d). In Q3, net revenue rose 3% and non-interest expense fell 2% sequentially, so pre-provision earnings increased 10% to $7.5B.
Why it matters. The bank can absorb credit costs more safely when the pre-provision engine is expanding.
Source: Capital One Q3 2026 financial supplement (8-K Ex. 99.2)
Forensic #2: GAAP Versus Adjusted EPS
Acquisition accounting and integration costs are real claims on capital even when management excludes them from adjusted EPS. The key question is whether they decline on schedule.
| EPS bridge | After-tax EPS effect |
|---|---|
| GAAP diluted EPS | $5.61 |
| Acquisition amortization | +$0.60 |
| Discover integration | +$0.42 |
| Brex integration | +$0.06 |
| Adjusted diluted EPS | $6.69 |
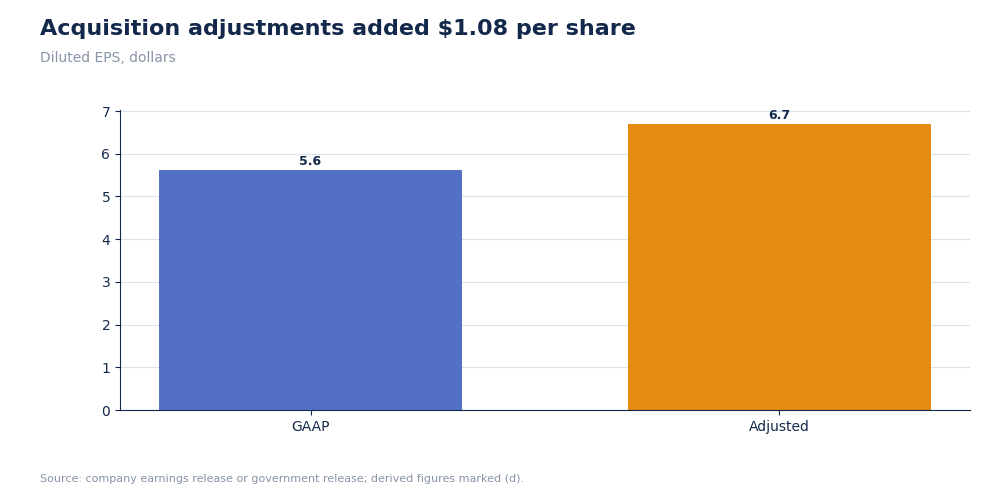
Capital One GAAP and adjusted diluted EPS
The $1.08 per-share adjustment equals 19% of GAAP EPS (d). Amortization is non-cash, while integration spending is cash and should be assessed against future synergies.
Why it matters. Using adjusted EPS as a run rate assumes $385M of combined integration expense is temporary.
Source: Capital One Q3 2026 financial supplement (8-K Ex. 99.2)
Forensic #3: Charge-Offs, Provision And Reserve Release
Provision equals current net charge-offs plus or minus the change in reserves. A reserve release boosts current earnings but reduces the cushion for future losses.
| Credit item | Q3 2026 |
|---|---|
| Gross charge-offs | $4,798M |
| Recoveries | $1,677M |
| Net charge-offs | $3,121M |
| Provision for credit losses | $2,896M |
| Allowance release | -$225M |
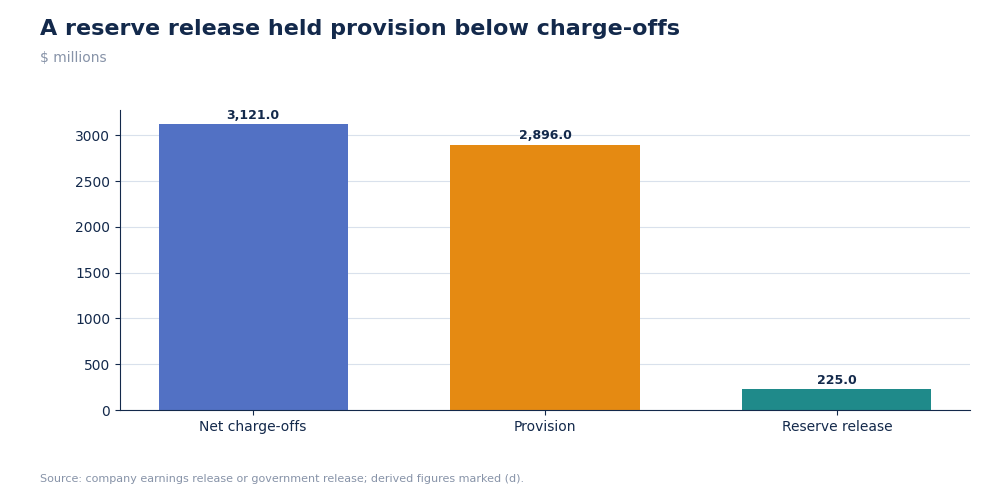
Capital One Q3 2026 credit cost bridge
Provision was $225M below net charge-offs because the allowance was released by the same amount. Without that release, pre-tax earnings would have been $225M lower (d).
Why it matters. A falling provision is not automatically improving credit when it comes from releasing prior reserves.
Source: Capital One Q3 2026 financial supplement (8-K Ex. 99.2)
Forensic #4: Delinquency And Capital
Delinquency is a forward indicator of future charge-offs, while CET1 is the balance-sheet capacity to absorb them.
| Measure | Q2 2026 | Q3 2026 | Q3 2025 |
|---|---|---|---|
| 30+ day delinquency | 3.13% | 3.41% | 3.50% |
| CET1 | 13.7% | 13.8% | 14.4% |
| Tangible common equity | 10.2% | 9.8% | 10.8% |
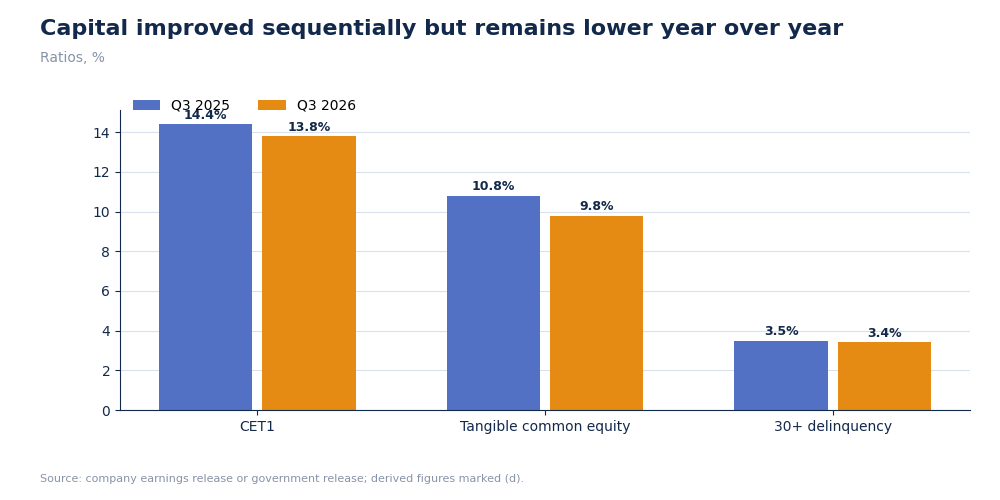
Capital One delinquency and capital ratios
Delinquency rose 28 bp sequentially but remained 9 bp below the prior year. CET1 improved 10 bp sequentially, while tangible common equity fell 40 bp. The signals are mixed rather than uniformly improving.
Why it matters. Credit trends should be read together with the capital consumed by acquisitions and integration.
Source: Capital One Q3 2026 financial supplement (8-K Ex. 99.2)
Valuation Snapshot
At $210.77 per share, Capital One had a market capitalization of $129.30B and a reported trailing P/E of 12.23x. Annualized Q3 GAAP EPS implies 9.4x (d), while annualized adjusted EPS implies 7.9x (d). The lower adjusted figure assumes acquisition amortization and integration costs should be excluded.
| Measure | Value |
|---|---|
| Share price | $210.77 |
| Market capitalization | $129.30B |
| Reported trailing P/E | 12.23x |
| P/E on annualized Q3 GAAP EPS | 9.4x (d) |
| P/E on annualized Q3 adjusted EPS | 7.9x (d) |
| CET1 ratio | 13.8% |
| Tangible common equity ratio | 9.8% |
Investment read-through. The stock looks inexpensive on Q3 earnings, but $1.08 per share of adjustments and a $225M reserve release both improve the apparent run rate. Removing the reserve-release benefit would reduce annualized after-tax earnings, while renewed reserve builds could quickly erase part of the valuation discount. The relevant question is normalized credit cost, not the lowest displayed P/E.
What has to be true. NIM must remain near 8.4%, integration costs must decline and charge-offs must stabilize without consuming the 13.8% CET1 cushion.
Source: Market quote, market capitalization and trailing P/E from the in-session U.S. equity market feed; company metrics from Capital One's Q3 2026 financial supplement. Market data: latest quote retrieved after the November 2, 2026 U.S. trading session.
Risks: What Would Break The Thesis
- Credit normalization. Net charge-offs remain above $3B per quarter.
- Reserve release. A weaker economy could reverse it into a build.
- Integration costs. Discover and Brex costs may persist.
- Capital. CET1 is lower year over year.
The reading would be too cautious if Discover synergies reduce expenses faster than credit normalizes.
What To Watch Next
- NIM against 8.41%.
- Net charge-offs against $3.121B.
- Reserve activity after the $225M release.
- Discover integration expense against $338M pre-tax.
- CET1 against 13.8%.

Sandeep Gupta
Independent equity research analyst publishing forensic theses on US-listed stocks. MBA, Politecnico di Milano School of Management (Milan, Italy).
Get new research in your inbox
Subscribe to receive forensic equity research the moment it's published. Free, no spam.
Related Research

Latest earnings releases: COF
— Capital One Reports Third Quarter 2026 Net Income of $3.5 billion,
Discussion
Be the first to comment.