
Investment Thesis
A company can pay shareholders only from three places: cash generated after reinvestment (free cash flow), cash already on the balance sheet, or new borrowing. The ratio of cash returned to free cash flow shows which of these is being used. This article applies that test to five companies that reported recently: Visa returned about 116% of its fiscal-year free cash flow ($25.6 billion against $22.1 billion), AT&T about 96% of the quarter's, Verizon 71% of its nine-month total, Microsoft 55% and ExxonMobil 49%. A second ratio, capex as a share of operating cash flow, shows how much cash is taken by reinvestment before owners see any.
- Visa (FY2026). Operating cash flow $23,728M; capex $1,671M; free cash flow about $22,057M (d); buybacks plus dividends $25.6B.
- Microsoft (FQ1 2027). Operating cash flow $58,000M; capex $39,367M; free cash flow about $18,633M (d); $10.2B returned (as stated).
- ExxonMobil (Q3 2026). Cash flow from operations $25.65B; capex $7.0B; free cash flow $19.1B; distributions $9.4B.
- AT&T (Q3 2026). Cash from operations $10.5B; capital investment $5.6B; free cash flow $5.0B; about $4.8B returned.
- Verizon (nine months 2026). Free cash flow $18.0B; capex $11.9B; dividends $8.8B; buybacks $4.0B.
- Meta (Q3 2026). Free cash flow -$2.1B; dividends $1.36B; no buybacks (from Stocknote's capex article).
- This article contains no rating, price target or investment advice. Derived figures are marked (d).
Bottom line. Returns covered by free cash flow at 49% to 71% (Exxon, Microsoft, Verizon) leave room to repay debt, invest more or raise payouts. At 96% (AT&T) there is little room, and at 116% (Visa) the excess of about $3.5 billion (d) came from the balance sheet or borrowing. A ratio above 100% is not alarming for a company with a large cash balance, but it cannot continue indefinitely, and Meta's negative free cash flow shows that even a dividend can exceed what the business generates in a quarter of heavy capex.
Sources: company releases linked in Stocknote's Visa, Microsoft, Verizon vs AT&T and Exxon and Chevron articles.
Latest Period At A Glance
| Company (period) | Operating cash flow | Capex | Free cash flow | Cash returned | Returned / FCF (d) |
|---|---|---|---|---|---|
| Visa (FY2026) | $23.7B | $1.7B | $22.1B | $25.6B | 116% |
| Microsoft (FQ1 2027) | $58.0B | $39.4B | $18.6B | $10.2B | 55% |
| ExxonMobil (Q3 2026) | $25.6B | $7.0B | $19.1B | $9.4B | 49% |
| AT&T (Q3 2026) | $10.5B | $5.6B | $5.0B | $4.8B | 96% |
| Verizon (9M 2026) | $29.9B | $11.9B | $18.0B | $12.8B | 71% |
Notes: Verizon operating cash flow is free cash flow plus capex (d). AT&T uses capital investment of $5.6B. ExxonMobil's free cash flow ($19.1B) differs from operating cash flow less capex ($18.65B, d), reflecting the company's own definition. Microsoft's returned figure is the $10.2B stated; the cash flow lines add to $11.1B.
What The Market Believes vs. What The Data Actually Shows
| Belief | What the data show |
|---|---|
| Large buybacks mean surplus cash | Visa's buybacks and dividends ($25.6B) exceeded free cash flow ($22.1B); the excess came from other sources. |
| The biggest AI spender cannot return cash | Microsoft's free cash flow fell to about $18.6B but covered the $10.2B returned 1.8 times (d). |
| Telecoms are cash machines | AT&T returned 96% of the quarter's free cash flow and carries net debt of $149.8B; Verizon returned 71% of nine-month free cash flow. |
| Energy companies pay out everything | ExxonMobil returned 49% of free cash flow in the quarter, and the rest went to the balance sheet. |
| A dividend is safe if the company is profitable | Meta's free cash flow was -$2.1B against a $1.36B dividend in the quarter. |
Forensic #1: The Coverage Ratio
| Company | Returned / FCF (d) | FCF left after returns (d) |
|---|---|---|
| Visa (FY2026) | 116% | $-3.5B |
| Microsoft (FQ1 2027) | 55% | $+8.4B |
| ExxonMobil (Q3 2026) | 49% | $+9.7B |
| AT&T (Q3 2026) | 96% | $+0.2B |
| Verizon (9M 2026) | 71% | $+5.2B |
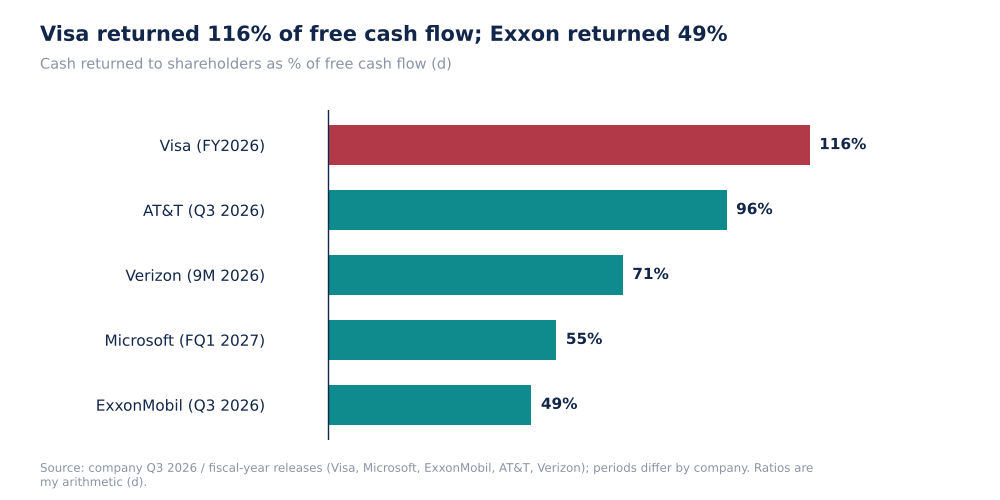
Cash Returned As % Of Free Cash Flow (Self-Made, Company Data, d)
Cash left after returns is negative only at Visa (-$3.5 billion, d). The remaining companies retained between $0.2 billion (AT&T, d) and $9.7 billion (ExxonMobil, d). Periods differ (a year for Visa, nine months for Verizon, one quarter for the others), so the ratios are not annualised comparisons and one quarter's free cash flow can swing with timing. AT&T's guidance of $18 billion or more of free cash flow for the year is a fuller-year anchor than its quarter.
Why it matters. The ratio is a test of sustainability. Returns below 100% of free cash flow can be funded from operations for as long as free cash flow holds up. Returns above 100% need a funding source, and the size of the cash balance and the cost of debt then matter.
Sources: company releases. Ratios and differences are my arithmetic (d).
Forensic #2: What Reinvestment Takes
| Company | Capex / operating cash flow (d) | Free cash flow / operating cash flow (d) |
|---|---|---|
| Visa (FY2026) | 7% | 93% |
| Microsoft (FQ1 2027) | 68% | 32% |
| ExxonMobil (Q3 2026) | 27% | 73% |
| AT&T (Q3 2026) | 53% | 47% |
| Verizon (9M 2026) | 40% | 60% |
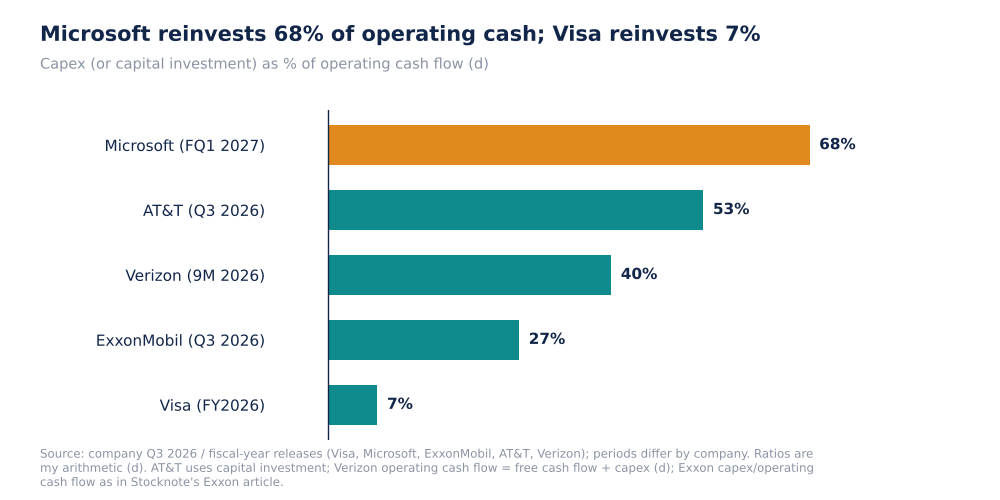
Capex As % Of Operating Cash Flow (Self-Made, Company Data, d)
The five companies reinvest very different shares of their operating cash flow: Microsoft 68%, AT&T 53% (using capital investment), Verizon 40%, ExxonMobil 27% and Visa 7%. In this group, the more asset-light the business, the more of operating cash flow reaches owners, and the heavier the build-out, the less. Microsoft's cash returned (55% of free cash flow) is the lowest after Exxon, but its free cash flow is itself only 32% of operating cash flow (d), after a doubling of capex described in Stocknote's Microsoft article.
Why it matters. Two companies with the same operating cash flow can give owners very different cash. Free cash flow is what remains, and a rising capex ratio shrinks it before any payout decision is made.
Sources: company releases. Ratios are my arithmetic (d). Exxon's ratio is from Stocknote's Exxon and Chevron article.
Forensic #3: Dollars
| Company | Free cash flow | Cash returned | Gap (d) |
|---|---|---|---|
| Visa (FY2026) | $22.1B | $25.6B | $-3.5B |
| Microsoft (FQ1 2027) | $18.6B | $10.2B | $+8.4B |
| ExxonMobil (Q3 2026) | $19.1B | $9.4B | $+9.7B |
| AT&T (Q3 2026) | $5.0B | $4.8B | $+0.2B |
| Verizon (9M 2026) | $18.0B | $12.8B | $+5.2B |
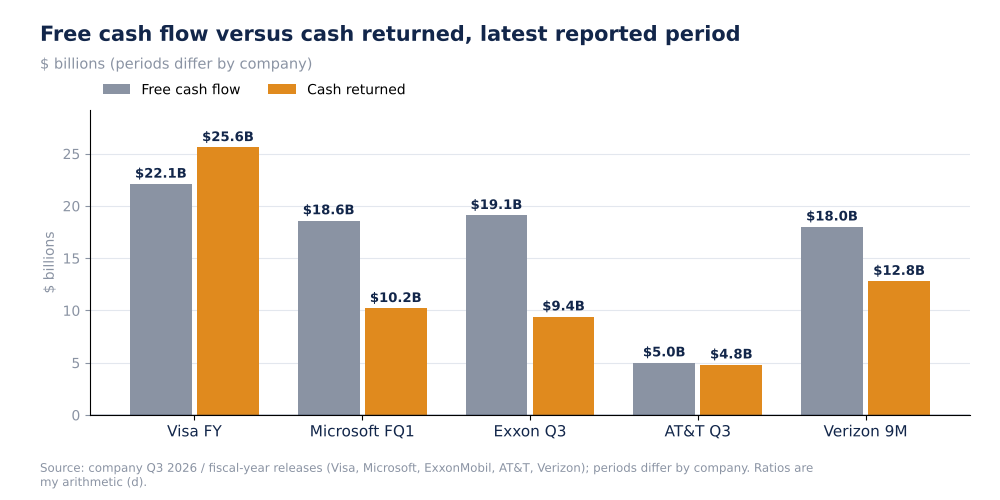
Free Cash Flow Versus Cash Returned, Latest Period, $B (Self-Made, Company Data)
Microsoft and ExxonMobil each generated about $19 billion of free cash flow in their reported periods and returned about $10 billion. Verizon's nine-month total of $18.0 billion is comparable to Microsoft's single quarter. The ranking of the companies by dollars is therefore different from the ranking by ratio: size and period length, not financial policy, drive the dollar comparison.
Why it matters. The coverage ratio removes size, so it is the right basis for comparing policy, while dollars matter for the absolute amount of capacity to repay debt or invest.
Sources: company releases. Gaps are my subtraction (d).
Forensic #4: Debt, The Other Source Of Cash
| Company | Debt position | Comment |
|---|---|---|
| AT&T | Net debt $149.8B (total $159.6B) | Targets 2.5x leverage in 2029 |
| Verizon | Net unsecured debt $123.7B (2.3x) | Company-defined |
| ExxonMobil | Net debt $22.1B | Fell almost $11B year to date (Stocknote Exxon article) |
| Visa | Not in my extract | Returns exceeded free cash flow by about $3.5B (d) |
| Microsoft | Not in my extract | Returns well covered |
The two telecoms carry the most debt and return a large share of free cash flow, which leaves less room for deleveraging. ExxonMobil returns the lowest share and has reduced net debt. For Visa, I do not have the balance sheet in my extract, so I cannot say whether the excess returns were funded from cash or debt. The comparison of net debt across companies of different sizes is also not like-for-like and is shown only for context.
Why it matters. The coverage ratio and the debt position have to be read together. Returning 96% of free cash flow is more demanding for a company with $149.8 billion of net debt than for one with a net cash position.
Sources: company releases and Stocknote articles listed above.
Valuation Snapshot
This is a cross-company framework, so no single valuation applies. The measures to track for any company are:
| Measure | How to compute |
|---|---|
| Reinvestment rate | Capex divided by operating cash flow |
| Free cash flow | Operating cash flow less capex |
| Coverage ratio | Cash returned divided by free cash flow |
| Funding gap | Free cash flow less cash returned (negative = borrowing or cash drawdown) |
What has to be true. A payout is sustainable when the coverage ratio stays below 100% over a full cycle, or when the gap is funded from a balance sheet that can afford it. Over one quarter, neither condition can be tested.
Risks: What Would Break The Thesis
- Different periods. A year, nine months and one quarter are compared.
- Definitions. Free cash flow differs by company; Exxon's and AT&T's reported figures differ from simple subtraction.
- Timing. One quarter's free cash flow is noisy.
- Missing balance sheets. Visa and Microsoft cash and debt are not in my extracts.
- Returns definitions. Microsoft's stated $10.2B differs from the sum of cash flow lines ($11.1B).
The reading would be wrong if the quarterly figures prove unrepresentative of full-year cash flow.
What To Watch Next
- Full-year coverage ratios when each company files its annual report.
- AT&T's progress toward $18B or more of free cash flow against buybacks of about $10B.
- Microsoft's capex against operating cash flow.
- Visa's funding of returns above free cash flow.
- Verizon's fourth-quarter free cash flow against its nine-month $18.0B.
- Meta's free cash flow after the capex guided in its release.

Sandeep Gupta
Independent equity research analyst publishing forensic theses on US-listed stocks. MBA, Politecnico di Milano School of Management (Milan, Italy).
Get new research in your inbox
Subscribe to receive forensic equity research the moment it's published. Free, no spam.
Discussion
Be the first to comment.