
Investment Thesis
Earnings season produces two numbers for most companies: GAAP earnings, which include every cost, and adjusted earnings, which exclude items management calls non-recurring. The gap is meant to be noise. In this quarter's reports it is not small: GAAP EPS was 3.5% (d) of adjusted at Johnson & Johnson, 20% (d) at AT&T, 37% (d) at Abbott and 84% (d) at Bank of America. Meta, which reports no adjusted EPS, booked a $9.89 billion legal charge equal to 76% (d) of its reported operating income. This article sets out a three-question test (size, recurrence, cash) and applies it to ten companies using the figures in recent Stocknote articles. It does not argue that adjusted numbers are wrong; it argues that the gap needs its own analysis.
- Size. GAAP as a share of adjusted EPS ranged from 3.5% (J&J) to 111% (NVIDIA, where GAAP was higher).
- Recurrence. At AT&T, J&J and Abbott, GAAP was below adjusted in this quarter; at AT&T the sign flipped from last year (GAAP EPS $1.29 against adjusted $0.54 in Q3 2025).
- Cash. Legal settlements and litigation provisions (Meta, Bank of America, Visa, J&J's talc charge) become cash outflows; amortisation of acquired intangibles does not.
- This article contains no rating, price target or investment advice. Derived figures are marked (d).
Bottom line. Treat a company's adjustments as part of its cost structure unless it can show they are rare. A simple haircut, subtracting a percentage of the excluded amount from adjusted EPS, turns the debate into a number an investor can choose. The ten companies below show why the right haircut differs by company.
Sources: company releases and the Stocknote articles on each company; see the source line above each table.
Q3 2026 At A Glance
| Company | GAAP EPS | Adjusted EPS | GAAP / adjusted (d) |
|---|---|---|---|
| J&J | $0.09 | $2.59 | 3.5% |
| AT&T | $0.13 | $0.65 | 20.0% |
| Abbott | $0.53 | $1.42 | 37.3% |
| Bank of America | $0.91 | $1.08 | 84.3% |
| Visa (FQ4) | $3.19 | $3.48 | 91.7% |
| Verizon | $1.25 | $1.31 | 95.4% |
| Eli Lilly | $7.22 | $7.48 | 96.5% |
| UnitedHealth | $4.56 | $4.69 | 97.2% |
| GM | $3.73 | $3.70 | 100.8% |
| NVIDIA | $2.46 | $2.22 | 110.8% |
Sources: J&J, AT&T, Abbott, Bank of America, Verizon, UnitedHealth, GM and Lilly Q3 2026 releases; Visa fiscal Q4 2026 release; NVIDIA fiscal Q2 2027 (secondary). Meta reports no adjusted EPS (GAAP diluted EPS $3.83).
What The Market Believes vs. What The Data Actually Shows
| Belief | What the data show |
|---|---|
| Adjusted EPS is the real earnings | At J&J, GAAP EPS was 3.5% (d) of adjusted; the $6,129M (d) gap is 97% (d) of adjusted earnings. |
| Excluded items do not repeat | AT&T's GAAP EPS was above adjusted a year ago ($1.29 against $0.54) and far below now ($0.13 against $0.65); the item type changes, the existence of items does not. |
| The gap is non-cash | Meta's $9.89B legal charge, Bank of America's $1.2B non-deductible settlement and Visa's $1.76B of litigation provisions are legal costs that become cash payments. |
| Only small companies have large adjustments | Abbott's net earnings gap is 63% (d) of adjusted; Verizon's EPS gap is 5% (d). |
| GAAP is always lower than adjusted | NVIDIA's GAAP EPS ($2.46) was 11% (d) above non-GAAP ($2.22); GM's was 0.8% (d) above. |
Forensic #1: How Big Is The Gap?
| Company | GAAP / adjusted EPS (d) | Gap per share (d) |
|---|---|---|
| J&J | 3.5% | $+2.50 |
| AT&T | 20.0% | $+0.52 |
| Abbott | 37.3% | $+0.89 |
| Bank of America | 84.3% | $+0.17 |
| Visa (FQ4) | 91.7% | $+0.29 |
| Verizon | 95.4% | $+0.06 |
| Eli Lilly | 96.5% | $+0.26 |
| UnitedHealth | 97.2% | $+0.13 |
| GM | 100.8% | $-0.03 |
| NVIDIA | 110.8% | $-0.24 |
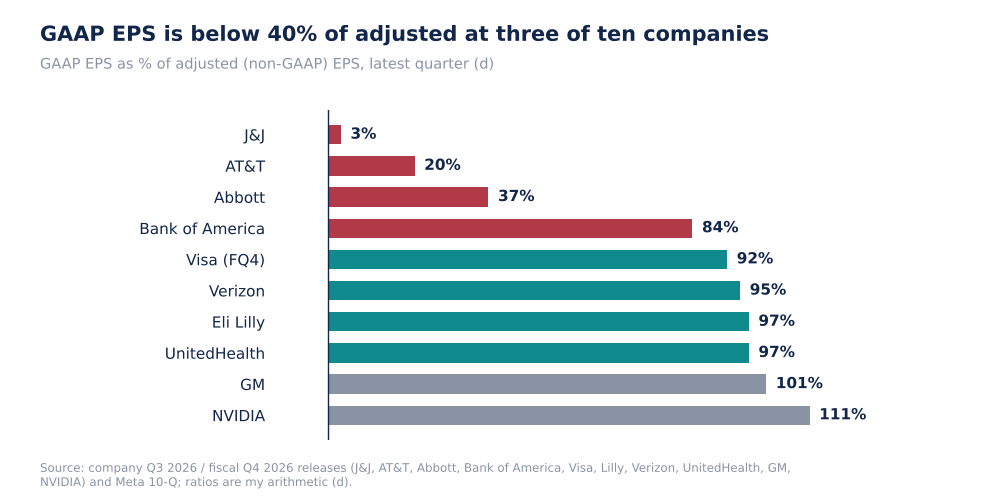
GAAP EPS As A Percent Of Adjusted EPS, Latest Quarter (Self-Made, d)
The ten companies fall into three groups: three with GAAP below 40% of adjusted (J&J, AT&T, Abbott), one at 84% (Bank of America, where the $0.17-a-share settlement equals the whole $0.17 gap, d), five at 92% to 97%, and two where GAAP is above adjusted. The relevant question is not the average but which group a company sits in. For the first group the adjusted number cannot be used without understanding the items.
Why it matters. For companies at 95% or above, adjusted and GAAP EPS tell the same story, and the discussion is a distraction. For those below 40%, the choice of measure moves the valuation more than any forecast.
Sources: company releases. Ratios and gaps are my arithmetic (d).
Forensic #2: Gap As A Share Of Adjusted Profit
| Company (basis) | Excluded items / adjusted profit (d) | Amounts used |
|---|---|---|
| Abbott (operating) | 55% | Adjusted lines give $3,051M (d); GAAP operating earnings $1,358M |
| AT&T (operating) | 46% | Adjusted $7.6B; GAAP $4.1B |
| Meta (operating) | 43% | $9,890M charge; pre-charge operating income $22,878M (d) |
| J&J (net earnings) | 97% | Adjusted $6,339M; GAAP $210M |
| Bank of America (net income) | 15% | $1.2B settlement; adjusted net income $8.1B |
| Visa FY (operating) | 9% | GAAP vs non-GAAP opex gap $2,874M; non-GAAP operating income $30,984M (d) |
| GM (Q3 EV charge) | 6% | $238M EV charge; EBIT-adjusted $4,106M |
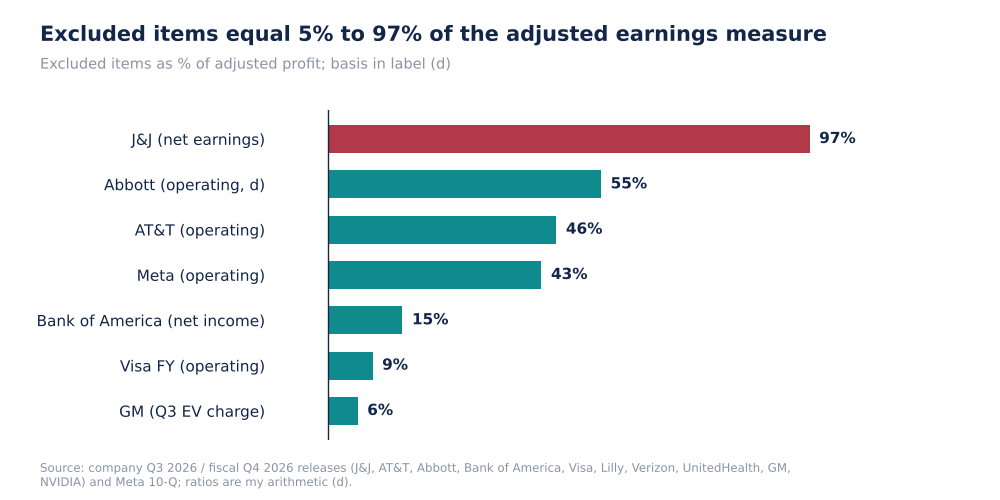
Excluded Items As A Percent Of Adjusted Profit (Self-Made, d; Bases Differ)
The bases differ (operating profit for some, net income for others), so the percentages are a rough scale and not a ranking on identical terms. GM's nine-month EV realignment charges of $3,594M are 24% (d) of the midpoint of its guided full-year adjusted EBIT of $14.5B to $15.5B ($15.0B), which shows how the same company can look small in one quarter (6%) and large over a longer window.
Why it matters. Window length matters. A quarterly gap understates a company whose charges are lumpy; a nine-month or annual view shows the true load.
Sources: company releases. Ratios are my arithmetic (d).
Forensic #3: Does It Recur?
| Company | Q3 2025 GAAP / adjusted EPS (d) | Q3 2026 GAAP / adjusted EPS (d) | Items named in Q3 2025 / Q3 2026 |
|---|---|---|---|
| AT&T | 239% | 20% | GAAP above adjusted a year ago / GAAP far below now |
| Abbott | 72% | 37% | Specified items both years; gap grew from $634M to $1,557M net earnings (d) |
| J&J | 76% | 3.5% | Special items both years; talc, Firefly Bio and Sail charges now |
| Meta | n/a | n/a | $15.93B tax charge (Q3 2025); $9.89B legal charge (Q3 2026) |
| GM | n/a | n/a | EV realignment $1,592M (Q3 2025), $238M (Q3 2026), $3,594M nine months |
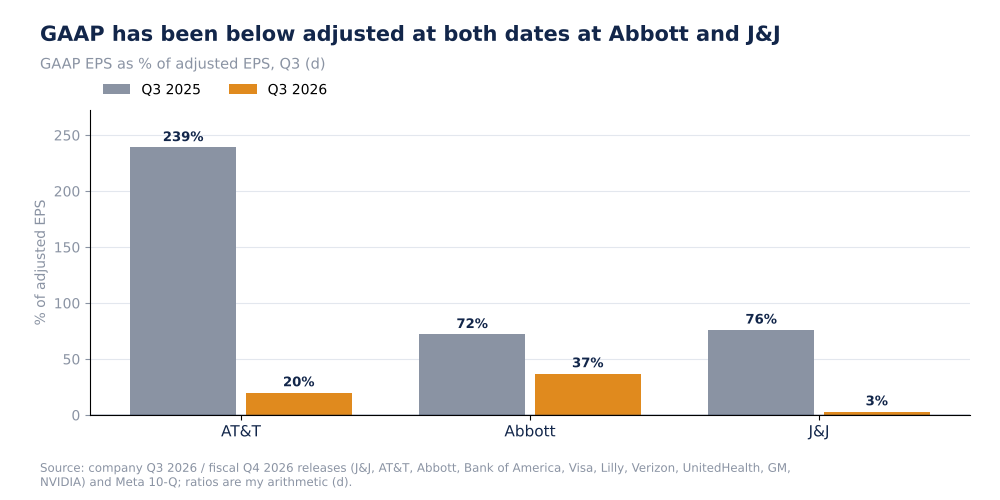
GAAP As A Percent Of Adjusted EPS, Q3 2025 Vs Q3 2026 (Self-Made, d)
The pattern across years is that items exist every year but are not the same item: Meta's year-ago charge was a one-time tax charge of $15.93B and this year's is a legal charge of $9.89B; GM's EV realignment charges were $1,592M a year ago and $238M now but total $3,594M over nine months. Each item can be described as non-recurring individually while a charge of some size recurs. At AT&T, the direction reversed (GAAP above adjusted, then below), which shows adjustments can add as well as subtract.
Why it matters. The correct test is whether the company has had items of this size in most recent periods, not whether this specific item will return. I have only two data points per company here, so the test cannot be completed from these releases.
Sources: company releases and Stocknote articles. Ratios are my arithmetic (d).
Forensic #4: Cash Versus Accrual, And A Haircut Illustration
| Type of item | Cash outflow? | Examples in this set |
|---|---|---|
| Legal settlements and litigation provisions | Yes, usually when paid | Meta $9.89B; Bank of America $1.2B; Visa $1.76B (FY provisions); J&J talc (amount not disclosed) |
| Acquired IPR&D | Yes, at acquisition | Lilly about $4.2B (included in both GAAP and its non-GAAP) |
| Amortisation of acquired intangibles | No (past cash) | Typically in adjusted exclusions at J&J and Abbott; not itemised in my extracts |
| Restructuring and EV realignment | Partly | GM $3,594M over nine months; Meta severance $1.18B |
| Goodwill impairment | No | Citi $726M (prior year; Stocknote's Morgan Stanley and Citi article) |
| Illustrative haircut on J&J adjusted EPS ($2.59) | Haircut | EPS after haircut (d) |
|---|---|---|
| No haircut | 0% | $2.59 |
| Treat 10% of the excluded amount as recurring | 10% | $2.34 |
| Treat 25% as recurring | 25% | $1.96 |
| Treat 50% as recurring | 50% | $1.34 |
| Treat all as recurring (GAAP) | 100% | $0.09 |
The haircut table is an illustration of the method and not a view on J&J: it subtracts a chosen share of the $2.50 per-share gap (d) from adjusted EPS. The right percentage depends on the nature of the items (legal costs that will be paid carry more weight than non-cash amortisation) and their frequency. The same method applies to any company in the first table.
Why it matters. The method makes the analyst's assumption explicit and testable, instead of accepting 100% adjusted or 100% GAAP by default.
Sources: company releases. Haircut figures are illustrative arithmetic (d).
Valuation Snapshot
This is a framework article, so no single valuation applies. The tests to run on any company are:
| Test | Question | Evidence needed |
|---|---|---|
| Size | GAAP EPS as % of adjusted EPS | Both EPS figures |
| Recurrence | Were items of similar size in most of the last 4 to 8 quarters? | Prior filings |
| Cash | Will the item be paid in cash, and when? | 10-Q notes and cash flow statement |
| Haircut | What share of the gap is recurring? | Analyst judgement, stated explicitly |
What has to be true. A valuation based on adjusted EPS is sound only if the excluded items are rare or non-cash. For the companies in the first group, that has to be demonstrated, not assumed.
Risks: What Would Break The Thesis
- Two data points. Most companies here have one prior year for comparison.
- Different bases. Operating profit and net income are mixed in the size comparison.
- Missing amounts. J&J's talc charge and Abbott's items are not itemised in my extracts.
- Secondary NVIDIA data. Its GAAP and non-GAAP EPS come from secondary reports.
- Selection. These are companies I analysed this week, not a random sample.
The reading would be wrong if the items prove to be non-cash or if a longer history shows they are genuinely rare.
What To Watch Next
- The 10-Q notes for J&J and Abbott for itemised exclusions.
- Cash payments for Meta's legal charge and Bank of America's settlement.
- GM's EV realignment charges in the fourth quarter.
- Whether AT&T's GAAP and adjusted EPS converge next quarter.
- Visa's litigation provisions after $1,764M for the year.
- Any change in the definition of adjusted measures in next quarter's releases.

Sandeep Gupta
Independent equity research analyst publishing forensic theses on US-listed stocks. MBA, Politecnico di Milano School of Management (Milan, Italy).
Get new research in your inbox
Subscribe to receive forensic equity research the moment it's published. Free, no spam.
Discussion
Be the first to comment.