
Investment Thesis
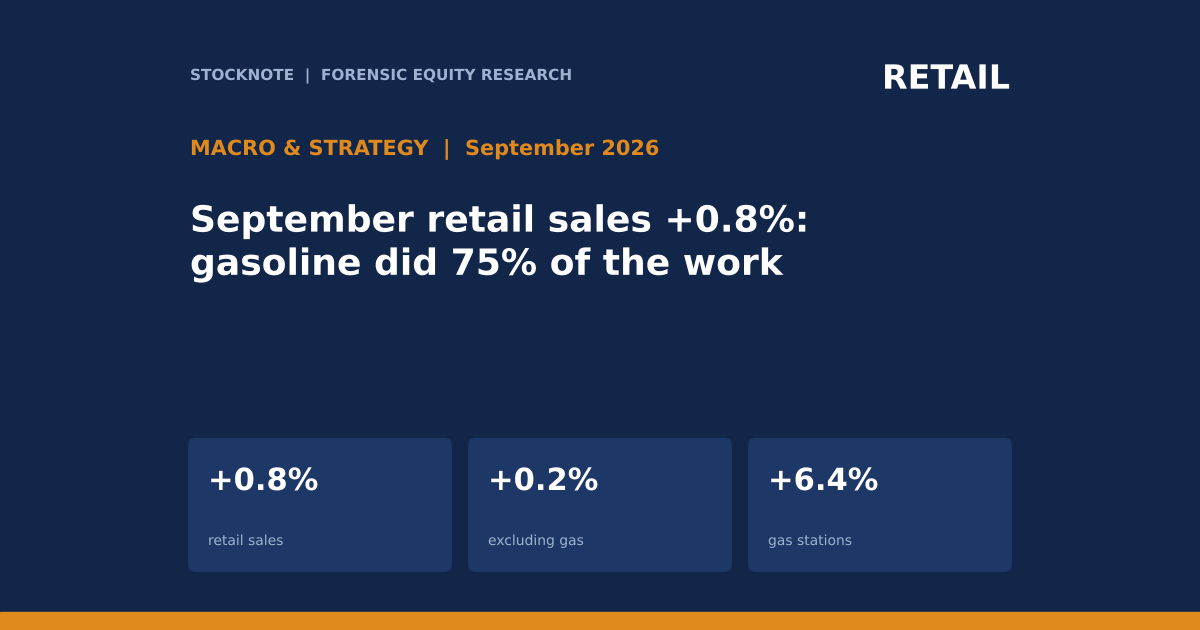
US retail sales rose 0.8% in September 2026, well above the 0.3% economists expected, after a revised 1.3% gain in August. The headline suggests a resilient consumer. The composition does not: excluding gasoline stations, sales rose 0.2%, and gasoline stations rose 6.4%. By simple arithmetic, about three quarters of the headline gain came from higher fuel prices.
- Headline. September retail sales +0.8% (consensus +0.3%); August revised to +1.3%.
- Excluding gas. +0.2%; gas stations +6.4%.
- Categories. Furniture +1.3%, restaurants +1.1%, electronics and appliances +0.6%, online retailers +0.3%, clothing 0%.
- Prices. CPI +0.6% in September (+0.4% in August); year over year +3.7% (+3.4%). AAA regular gasoline $4.33 per gallon, from under $3 before the war.
- Labor. Employers added 29,000 jobs and the unemployment rate ticked up, according to the same report.
- This article contains no rating, price target or investment advice. Derived figures are marked (d).
Bottom line. Nominal retail sales are a poor measure of consumer strength in a month when the price of the most-purchased single item moves 6%. The ex-gas figure of +0.2% is below the 0.6% rise in overall consumer prices, which implies lower real spending outside fuel, although the CPI is for all items and I do not have goods prices alone.
Source (secondary): Associated Press via AJC.
September 2026 Retail Sales At A Glance
| Measure | September 2026 | Comparison |
|---|---|---|
| Total retail sales | +0.8% | Consensus +0.3% |
| Total excluding gas stations | +0.2% | |
| Gas stations | +6.4% | |
| August retail sales (revised) | +1.3% | |
| CPI month over month | +0.6% | +0.4% in August |
| CPI year over year | +3.7% | +3.4% in August |
| Regular gasoline (AAA) | $4.33 | Under $3 before the war |
| Q3 consumer spending (Oxford Economics) | +3.3% annualized | Expected to slow into the holidays |
Source (secondary): Associated Press via AJC.
What The Market Believes vs. What The Data Actually Shows
| Belief | What the data show |
|---|---|
| A 0.8% gain beats expectations, so demand is strong | Gas stations contributed about 0.6 point (d) of the 0.8% headline; the rest of retail rose 0.2%. |
| Rising sales mean rising volumes | Nominal sales rose 0.8% and CPI 0.6%, so real retail sales rose about 0.2% (d), and less once gasoline is stripped out. |
| Services spending is picking up | Restaurants rose 1.1%, the only services category cited, which is a single month. |
| The consumer is using income | BDO's Natalie Kotlyar noted shoppers are relying on savings and promotions; see our September personal income and outlays article for the saving rate. |
| Online is taking share | Online retailers rose 0.3%, below the headline. |
Forensic #1: How Much Was Gasoline?
A headline growth rate is the weighted average of its components. Because the total, the ex-gas figure and the gas-station figure are all published, the weight of gas stations can be backed out: if total = w x gas + (1 - w) x ex-gas, then w = (total - ex-gas) / (gas - ex-gas).
| Item | Value |
|---|---|
| Total growth | 0.8% |
| Excluding-gas growth | 0.2% |
| Gas-station growth | 6.4% |
| Implied gas-station weight (d) | 9.7% |
| Gas contribution to headline (d) | 0.6 point (77% of the gain) |
| Contribution from all other retail (d) | 0.2 point |
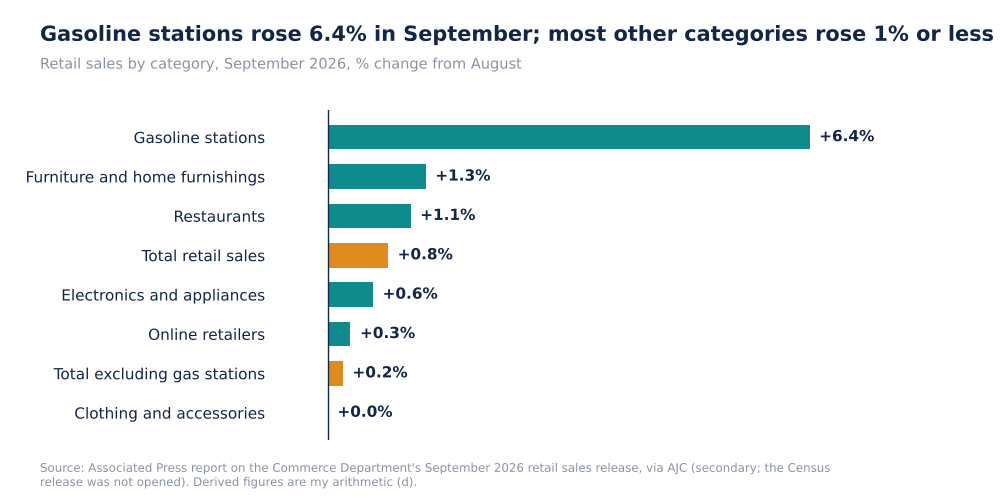
US retail sales by category, September 2026
The implied weight of about 10% (d) is plausible for fuel stations at a $4+ price, though it is sensitive to the rounding of the published figures (a 0.1-point change in any input moves the result by several points), so I treat it as approximate. The conclusion holds anyway: most of the gain is the gas line.
Why it matters. A consumer who spends more on gasoline has less to spend elsewhere; higher gas sales are a drag on other spending, not evidence of strength.
Source: Associated Press report on the Commerce Department's September 2026 retail sales release, via AJC (secondary; the Census release was not opened). Derived figures are my arithmetic (d).
Forensic #2: Nominal Versus Real
| % change | August | September | Two months (d) |
|---|---|---|---|
| Retail sales (nominal) | +1.3 | +0.8 | +2.1 |
| Consumer prices (CPI) | +0.4 | +0.6 | +1.0 |
| Difference (d) | +0.9 | +0.2 | +1.1 |
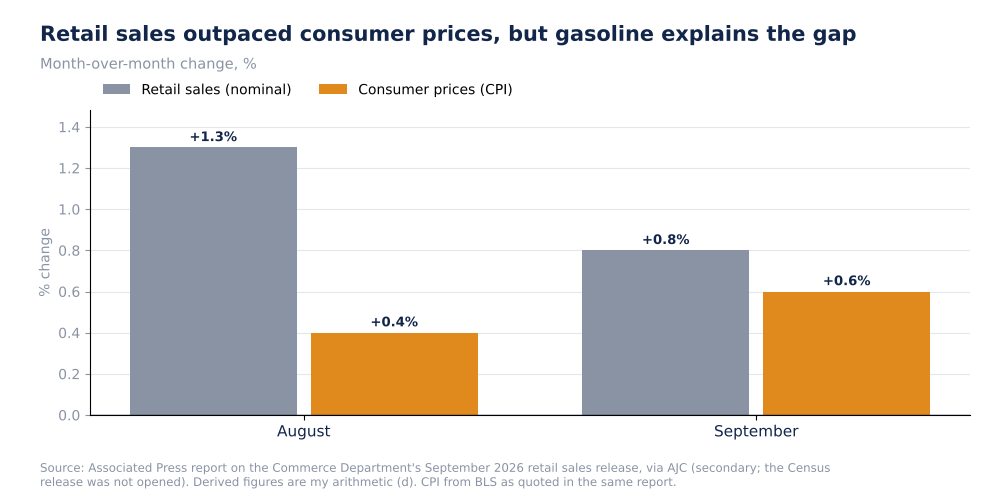
Retail sales and consumer prices, month over month, August and September 2026
Over two months, retail sales rose about 2.1% (d) and prices about 1.0% (d), a real gain of about 1.1 point (d). That is positive but small, and most of it came in August. In September the gap narrowed to about 0.2 point (d). Comparing retail sales with all-items CPI is a rough deflator, since retail sales exclude most services and include categories with different price trends; the result is a signal and not an estimate of real consumption. Oxford Economics' estimate of 3.3% annualized consumer spending growth in Q3 is consistent with positive real growth over the quarter and a slowdown expected into the holidays.
Why it matters. Real spending is what drives the volume of goods companies sell. A flat real figure with 3.7% inflation means that revenue growth at retailers is largely price.
Source: Associated Press report on the Commerce Department's September 2026 retail sales release, via AJC (secondary; the Census release was not opened). Derived figures are my arithmetic (d).
Forensic #3: The Fuel Price Shock
| Item | Value |
|---|---|
| AAA regular gasoline, September | $4.33 |
| Before the war | Under $3.00 |
| Implied increase (d) | More than 44% |
| CPI year over year | 3.7% (3.4% in August) |
| CPI month over month | 0.6% (0.4% in August) |
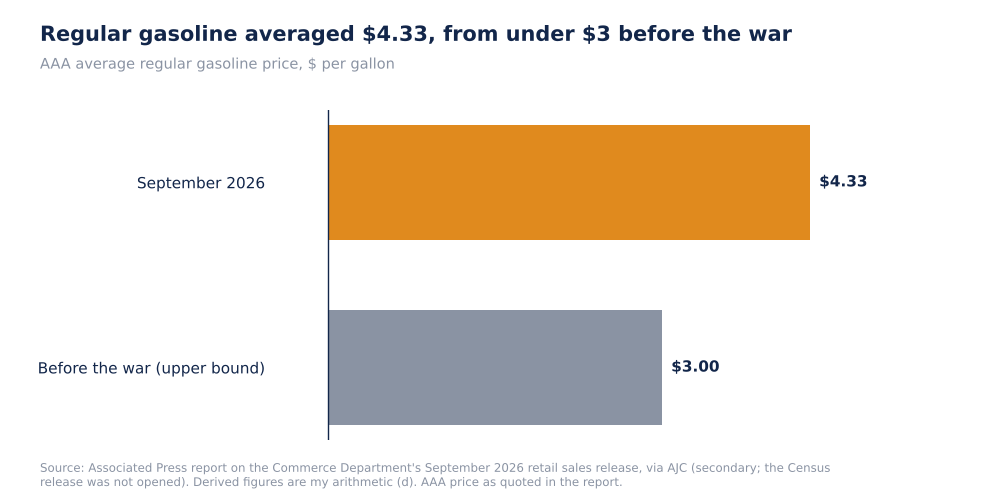
Gasoline price, September 2026 vs before the war
The 6.4% increase in gas-station sales in one month is smaller than the cumulative price change since the start of the conflict because the report only states the pre-war price as under $3. A rise from under $3.00 to $4.33 is more than 44% (d). Higher gasoline prices tend to be passed into headline CPI quickly, which is consistent with the CPI rise from 3.4% to 3.7% year over year, but the extract does not give the energy component of CPI, so I cannot size it.
Why it matters. Fuel is a tax on discretionary spending; the more households spend on it, the less is left for restaurants, retail and travel in later months.
Source: Associated Press report on the Commerce Department's September 2026 retail sales release, via AJC (secondary; the Census release was not opened). Derived figures are my arithmetic (d).
Forensic #4: What The Labor Data Add
| Indicator | Reading |
|---|---|
| Employer job additions, latest report | 29,000 |
| Unemployment rate | Ticked up |
| Retail sales, two-month nominal growth (d) | +2.1% |
| Consumer spending, Q3 (Oxford Economics) | +3.3% annualized |
Job growth of 29,000 is low, and a rising unemployment rate removes one of the supports for spending growth. If income growth is slowing while prices accelerate, spending can still hold up for a time through lower saving, which is what BDO's comment about shoppers relying on savings describes. This is why the quality of the spending, price versus volume, matters more than its level.
Why it matters. Spending financed by savings is not repeatable; spending financed by income is.
Source: Associated Press report on the Commerce Department's September 2026 retail sales release, via AJC (secondary; the Census release was not opened). Derived figures are my arithmetic (d).
Valuation Snapshot
This is a macro article, so there is no security-specific valuation. The relevant gauges are below.
| Measure | Latest |
|---|---|
| Retail sales excluding gas stations, September | +0.2% |
| Retail sales minus CPI, September (d) | +0.2 point |
| CPI year over year | +3.7% |
| Regular gasoline | $4.33 |
| Employer job additions | 29,000 |
What has to be true. For consumer volumes to hold, income growth must pick up or the saving rate must fall further, and gasoline prices must stop rising.
Risks: What Would Break The Thesis
- Fuel prices. A decline would remove the gas line that supplied most of September's gain.
- Revisions. August was revised; September may be too.
- Rough deflator. All-items CPI is not the price index of retail goods.
- Weight estimate. The implied gas weight is sensitive to rounding.
- Data limits. No Census release, no control group and no year-over-year sales figure in my source.
The reading would be wrong if the Census release shows that the control group (which excludes gas, autos, building materials and food services) grew faster than the 0.2% ex-gas figure.
What To Watch Next
- October retail sales ex-gas against +0.2%.
- The control group measure in the Census release.
- CPI energy and core goods components.
- Gasoline prices against $4.33.
- Employer payrolls against 29,000 and the unemployment rate.
- Personal saving rate in the next personal income and outlays release.

Sandeep Gupta
Independent equity research analyst publishing forensic theses on US-listed stocks. MBA, Politecnico di Milano School of Management (Milan, Italy).
Get new research in your inbox
Subscribe to receive forensic equity research the moment it's published. Free, no spam.
Discussion
Be the first to comment.