
Investment Thesis
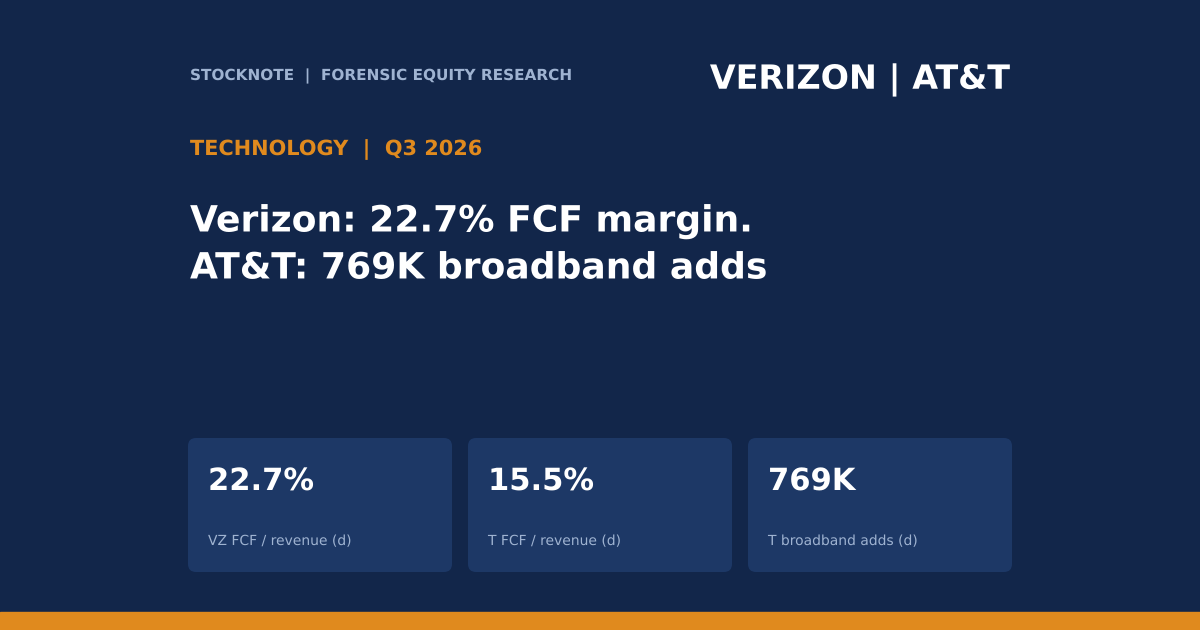
AT&T and Verizon reported third-quarter 2026 results with similar headline subscriber numbers and very different financial profiles. Verizon added 406,000 postpaid phones (churn 0.94%) and AT&T added 379,000 (churn 0.92%). AT&T grew revenue 5.3% to $32.3 billion against Verizon's 1.5% to $34.3 billion, and added 769,000 fiber and fixed-wireless lines (d) against Verizon's 314,000. But Verizon turned 22.7% of revenue (d) into free cash flow ($7.8 billion) against AT&T's 15.5% (d) ($5.0 billion), and AT&T's GAAP earnings per share were $0.13 against adjusted $0.65.
- AT&T. Revenue $32.3B (+5.3%); adjusted EBITDA $12.5B (+5.4%); GAAP diluted EPS $0.13 (year-ago $1.29); adjusted EPS $0.65 (year-ago $0.54); free cash flow $5.0B; net debt $149.8B.
- Verizon. Revenue $34.3B (+1.5%); adjusted EBITDA $13.8B, margin 40.2% (year-ago 37.8%); EPS $1.25, adjusted $1.31; free cash flow $7.8B (+12.1%); net unsecured debt $123.7B (2.3x).
- Guidance. AT&T: adjusted EPS about $2.40, capital investment $23B to $24B, free cash flow $18B+, buybacks about $10B. Verizon raised: phone net adds 1.1M to 1.2M, adjusted EPS $5.04 to $5.06, capex $16.0B to $16.5B.
- This article contains no rating, price target or investment advice. Derived figures are marked (d).
Bottom line. AT&T is growing faster but converts less of its revenue to free cash and carries more debt, while Verizon grows more slowly and converts more. Whether AT&T's faster growth eventually converts to Verizon-like cash margins cannot be answered from one quarter.
Sources: AT&T Q3 2026 8-K exhibit 99.1; Verizon Q3 2026 earnings release.
Q3 2026 At A Glance
| Q3 2026 | AT&T | Verizon |
|---|---|---|
| Revenue | $32.3B (+5.3%) | $34.3B (+1.5%) |
| Adjusted EBITDA | $12.5B (+5.4%) | $13.8B |
| Adjusted EBITDA margin (d for AT&T) | 38.7% | 40.2% |
| GAAP diluted EPS | $0.13 | $1.25 |
| Adjusted EPS | $0.65 | $1.31 |
| Postpaid phone net adds / churn | 379K / 0.92% | 406K / 0.94% |
| Broadband net adds | 769K: fiber 442K, FWA 327K (d) | 314K: FWA 159K, fiber 155K |
| Cash from operations | $10.5B | $11.5B |
| Free cash flow | $5.0B | $7.8B (+12.1%) |
| Net debt | $149.8B | $123.7B net unsecured (2.3x) |
Sources: AT&T; Verizon. Debt measures are defined differently by the two companies.
What The Market Believes vs. What The Data Actually Shows
| Belief | What the data show |
|---|---|
| AT&T is the growth story | Revenue +5.3% and adjusted EBITDA +5.4% against Verizon's revenue +1.5%; AT&T's Advanced Connectivity EBITDA of $12.3B has a 41.8% margin. |
| Verizon is the laggard | Verizon added more postpaid phones (406K against 379K), raised its margin by 2.4 points (d) to 40.2% and grew free cash flow 12.1%. |
| Both are cheap yield stocks | Free cash flow after capex is 40% of EBITDA at AT&T (d) and 57% at Verizon (d); the dividend has to be paid from that. |
| Reported earnings tell the story | AT&T's GAAP EPS of $0.13 is 20% of adjusted EPS (d); Verizon's $1.25 is 95% of adjusted (d). |
| Fiber is a Verizon opportunity | Verizon's fiber net adds of 155K are 35% of AT&T's 442K (d), and Verizon's 17.4M broadband connections include fixed wireless. |
Forensic #1: Margin And Cash Conversion
| Q3 2026 (d unless stated) | AT&T | Verizon |
|---|---|---|
| Adjusted EBITDA margin | 38.7% | 40.2% (reported) |
| Free cash flow / revenue | 15.5% | 22.7% |
| Free cash flow / adjusted EBITDA | 40% | 57% |
| Cash from operations / revenue | 32.5% | 33.5% |
| Capex ($B, reported) | 5.1 (capital investment 5.6) | n/a for Q3 (nine months 11.9) |
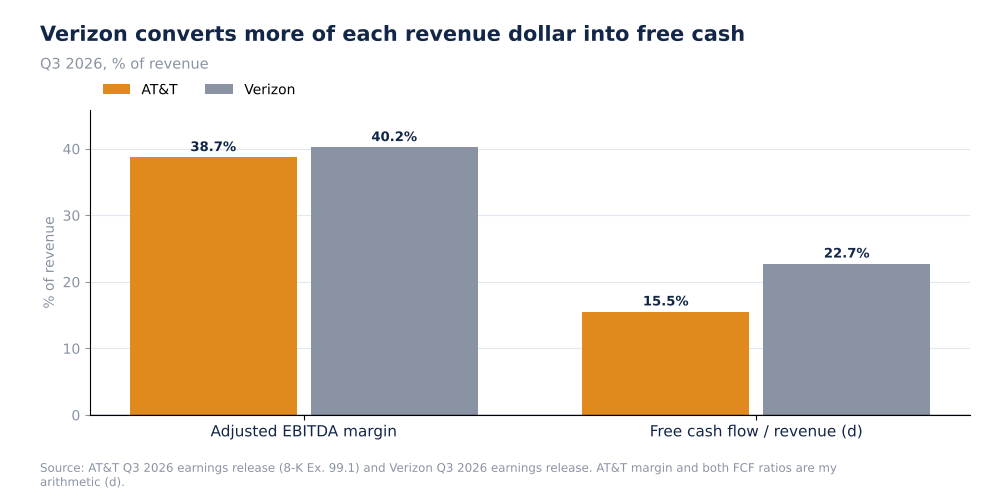
Adjusted EBITDA Margin And Free Cash Flow To Revenue, Q3 2026 (Self-Made, d)
The EBITDA margins are close (AT&T 38.7% against Verizon 40.2%), but the cash conversion differs: AT&T kept 40% (d) of EBITDA as free cash flow and Verizon 57% (d). AT&T's capex ($5.1 billion, or $5.6 billion capital investment) is 16% of revenue (d), an investment level the release attributes to capital investment, and I have no breakdown by technology. I do not have Verizon's third-quarter capex alone, and one quarter's free cash flow is affected by timing of payments, so I do not extrapolate.
Why it matters. Free cash flow after capex funds dividends, buybacks and debt paydown. The ratio of free cash flow to EBITDA shows how much of the headline profit is left for owners.
Sources: AT&T; Verizon. Ratios are my arithmetic (d).
Forensic #2: Where The Subscribers Are Coming From
| Net additions, Q3 2026 (thousands) | AT&T | Verizon |
|---|---|---|
| Postpaid phone | 379 | 406 |
| Fiber | 442 | 155 |
| Fixed wireless | 327 | 159 |
| Broadband total (d) | 769 | 314 |
| Phone churn | 0.92% | 0.94% |
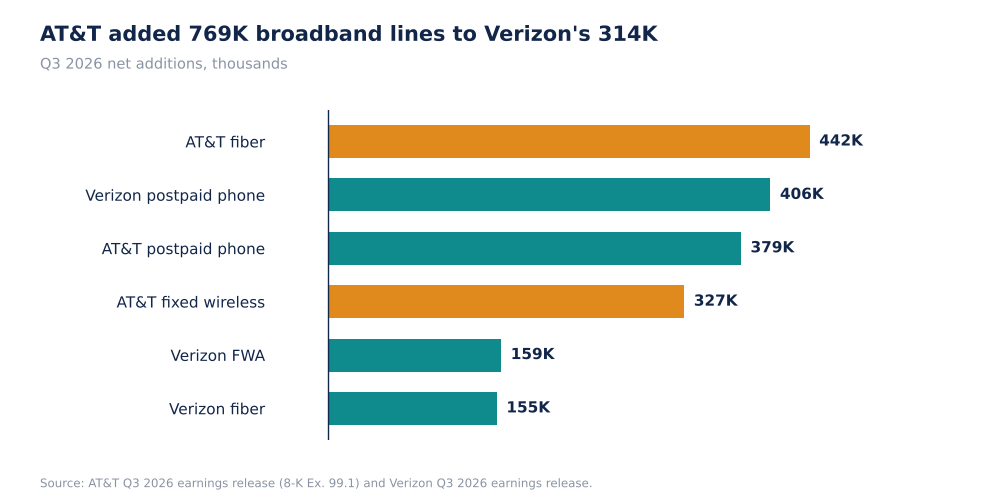
Net Additions By Product, Q3 2026, Thousands (Self-Made, Company Data)
On phones the two are almost level. In broadband AT&T added 2.4 times as many lines as Verizon (d: 769 / 314), with both fiber and fixed wireless higher. Verizon reports 17.4 million broadband connections in total. AT&T's wireless service revenue was $17,764 million (+5.0%) against Verizon's mobility and broadband service revenue of $23.5 billion (+2.9%), which includes both wireless and fixed broadband and is therefore not like-for-like.
Why it matters. Broadband and phone together are the convergence thesis: a customer buying both churns less. The extract does not show bundle penetration, so I cannot test that thesis with these data.
Sources: AT&T; Verizon. Totals are my arithmetic (d).
Forensic #3: Quality Of Earnings
| EPS, Q3 2026 | GAAP | Adjusted | GAAP / adjusted (d) |
|---|---|---|---|
| AT&T | $0.13 | $0.65 | 20% |
| AT&T year-ago | $1.29 | $0.54 | 239% |
| Verizon | $1.25 | $1.31 | 95% |
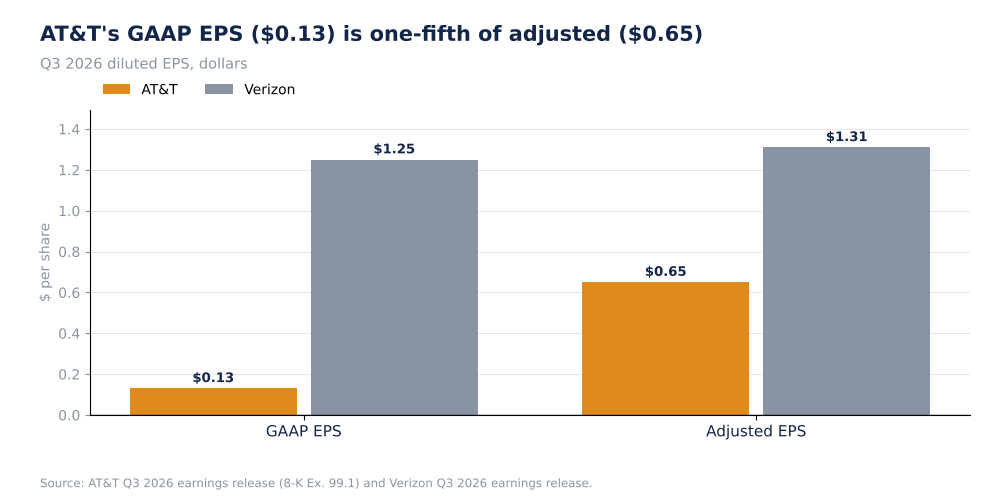
GAAP Vs Adjusted EPS, Q3 2026 (Self-Made, Company Data)
AT&T's GAAP operating income was $4.1 billion against $6.1 billion a year earlier, while adjusted operating income was $7.6 billion. The $3.5 billion gap between adjusted and GAAP operating income (d) is not itemised in my extract. The year-ago figures show the reverse: GAAP EPS of $1.29 was well above adjusted EPS of $0.54. Because the direction of the gap changes between years, GAAP EPS is not a stable guide at AT&T and neither number should be read alone. Verizon's GAAP and adjusted EPS differ by $0.06 (d).
Why it matters. An investor valuing AT&T on adjusted EPS of $0.65 is relying on management's choice of exclusions. Free cash flow, which is less affected by those choices, is a cleaner anchor: $5.0 billion in the quarter and guidance of $18 billion or more for the year.
Sources: AT&T; Verizon. Ratios are my arithmetic (d).
Forensic #4: Balance Sheet And Shareholder Returns
| Item | AT&T | Verizon |
|---|---|---|
| Debt measure | Net debt $149.8B (total debt $159.6B) | Net unsecured debt $123.7B (2.3x) |
| Leverage (Q3 EBITDA x4) (d) | 3.0x on net debt | 2.3x (company-defined) |
| Q3 shareholder returns | about $4.8B incl. $2.8B buybacks | Nine months: dividends $8.8B, buybacks $4.0B |
| Q3 returns / free cash flow (d) | 96% | Nine months: 71% of $18.0B FCF |
| Debt target | Leverage back to 2.5x in 2029 | n/a |
AT&T returned about 96% of the quarter's free cash flow (d) while guiding to a return to 2.5 times leverage by 2029, against guidance of about $10 billion of buybacks for the year. Verizon returned 71% (d) of nine-month free cash flow ($12.8 billion of $18.0 billion, d). The leverage figures are not like-for-like: my AT&T figure of 3.0x multiplies one quarter's EBITDA by four and uses net debt, while the company's own definition may differ.
Why it matters. The 2.5x target in 2029 is three years away. Until then more of AT&T's free cash goes to debt and buybacks than would be needed at Verizon's lower leverage, and any miss in the $18 billion or more free cash flow guidance bears on both.
Sources: AT&T; Verizon. Derived figures marked (d).
Valuation Snapshot
I have no share prices for either company in my sources, so I do not calculate yields or multiples. The inputs an investor needs are:
| Input | AT&T | Verizon |
|---|---|---|
| Guided adjusted EPS (2026) | about $2.40 | $5.04 to $5.06 |
| Guided free cash flow | $18B+ | n/a in extract |
| Guided buybacks | about $10B | n/a in extract |
| Dividend | $1.11 (annual, as stated) | n/a in extract |
What has to be true. For AT&T to justify faster revenue growth at a lower cash margin, free cash flow must reach the $18 billion or more guided and leverage must fall towards 2.5x. For Verizon, the 2.4-point margin gain has to be sustained without cutting the capex guided at $16.0 billion to $16.5 billion.
Risks: What Would Break The Thesis
- One quarter. Free cash flow depends on working capital and payment timing.
- Different definitions. Net debt, adjusted EBITDA and adjusted EPS are company-defined and not identical.
- Unexplained gap. The $3.5B GAAP-to-adjusted operating income difference at AT&T is not itemised in my extract.
- Missing data. No share prices, no Verizon Q3 capex, no bundle data.
- Competition. Net additions that are level today can diverge if promotional pricing changes.
The reading would be wrong if AT&T's free cash flow rose to Verizon-like conversion or Verizon's margin gain reversed.
What To Watch Next
- Full-year free cash flow against AT&T's $18B+ guidance.
- Verizon's fourth-quarter phone net adds against 1.1M to 1.2M for the year.
- Fiber and fixed-wireless net adds at each.
- AT&T leverage on the path to 2.5x in 2029.
- Itemisation of AT&T's GAAP versus adjusted differences in the 10-K.
- Capex against Verizon's $16.0B to $16.5B.

Sandeep Gupta
Independent equity research analyst publishing forensic theses on US-listed stocks. MBA, Politecnico di Milano School of Management (Milan, Italy).
Get new research in your inbox
Subscribe to receive forensic equity research the moment it's published. Free, no spam.
Discussion
Be the first to comment.