
Investment Thesis
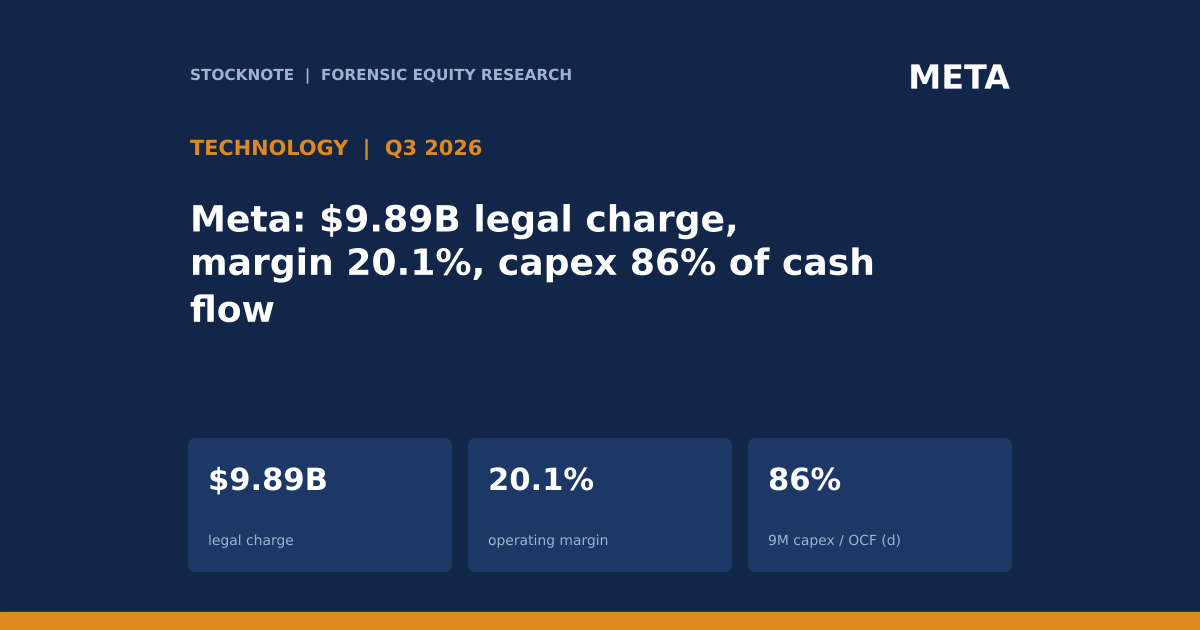
Meta's third-quarter 2026 Form 10-Q shows two stories at once. Revenue grew 26% to $64,601 million, driven by ad impressions up 10% and the average price per ad up 14%. But total costs and expenses rose 68% to $51,613 million, and operating income fell 37% to $12,988 million, an operating margin of 20.1% against 40.1% a year earlier. The 10-Q attributes the cost increase mainly to legal costs, including a $9.89 billion charge for an August 2026 multistate attorneys general agreement, plus infrastructure and third-party AI costs. Strip out the legal charge and the margin would have been about 35.4% (d), still 4.7 points below last year.
- Revenue. $64,601M (+26%); advertising $63,061M; Family of Apps $64,158M; Reality Labs $443M (-6%).
- Operating income. $12,988M (year-ago $20,535M); Family of Apps $17,117M (margin 27%, year-ago 49%); Reality Labs loss $4,129M.
- Net income. $9,860M against $2,709M, because Q3 2025 included a $15.93B discrete tax charge on the enactment of the One Big Beautiful Bill Act.
- Cash. Nine-month operating cash flow $96,873M; purchases of property and equipment $83,055M; no share repurchases in 2026 (nine months 2025: $26,248M); long-term debt $80,922M (December 2025: $58,744M).
- People. Headcount 66,775 (-15%); family daily active people 3.64B (+3%).
- This article contains no rating, price target or investment advice. Derived figures are marked (d).
Bottom line. Net income more than tripled but the cause is an unusually bad year-ago comparison, not better operations. The operating line shows a business growing revenue at 26% while spending grows faster, and funding the build-out partly with debt instead of buybacks.
Source: Meta Platforms Form 10-Q, Q3 2026.
Q3 2026 At A Glance
| $ millions | Q3 2026 | Q3 2025 | Change |
|---|---|---|---|
| Revenue | 64,601 | 51,242 | +26.1% (d) |
| Total costs and expenses | 51,613 | 30,707 | +68.1% (d) |
| Income from operations | 12,988 | 20,535 | -36.8% (d) |
| Operating margin (d) | 20.1% | 40.1% | -20.0 pts |
| Provision for income taxes | 3,141 | 18,954 | |
| Net income | 9,860 | 2,709 | |
| Diluted EPS | $3.83 | $1.05 |
Source: Meta 10-Q. Changes marked (d) are my arithmetic.
What The Market Believes vs. What The Data Actually Shows
| Belief | What the data show |
|---|---|
| Net income of $9.9B shows earnings tripling | Q3 2025 net income was depressed by a $15.93B tax charge. Operating income actually fell 37% (d). |
| The margin drop is just the legal charge | Excluding the $9.89B charge, costs still grew 36% (d) against revenue growth of 26%, and the margin was 35.4% (d), not 40.1%. |
| Ad growth is volume driven | Impressions +10% and price per ad +14% together explain the 26% ad revenue growth (1.10 x 1.14 = 1.25, d). |
| Efficiency drive protects margins | Headcount fell 15% and employee compensation rose only 7% (d), but other costs and expenses rose from $17,468M to $37,451M. |
| Capex is funded from internal cash | Nine-month capex of $83.1B was 86% of operating cash flow (d); long-term debt rose by $22.2B (d) and $24.9B of debt was issued. |
Forensic #1: Separating The Legal Charge From The Run-Rate
| Q3 2026 ($M) | Reported | Excluding legal charge (d) | Q3 2025 |
|---|---|---|---|
| Total costs and expenses | 51,613 | 41,723 | 30,707 |
| Income from operations | 12,988 | 22,878 | 20,535 |
| Operating margin | 20.1% | 35.4% | 40.1% |
| Cost growth y/y | +68.1% | +35.9% | n/a |
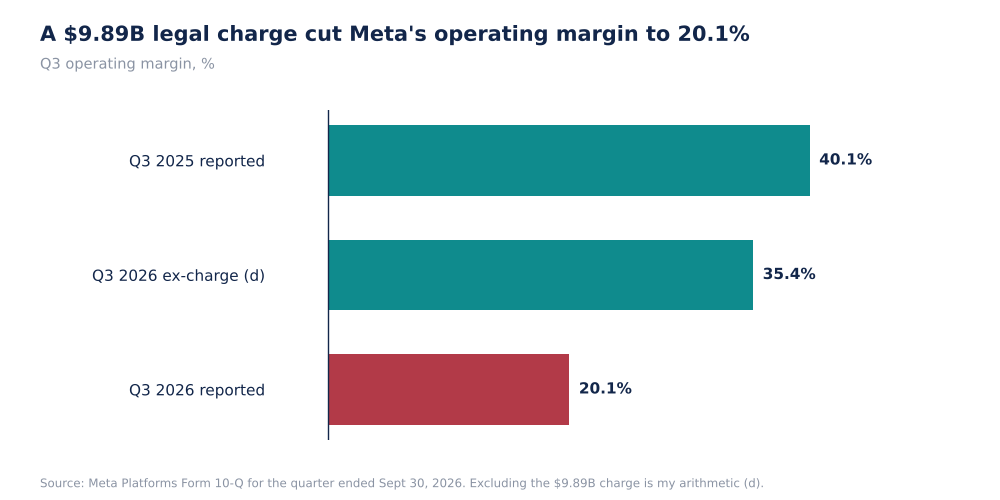
Meta Operating Margin: Reported Vs Excluding The Legal Charge (Self-Made, d)
The charge is 76% of reported operating income (d) and 43% (d) of operating income before it. Adding it back is an analytical convenience and not a Meta measure: a settlement is a real cost, and the 10-Q does not say whether it will recur. Even on that basis, margin fell from 40.1% to 35.4% (d), because infrastructure expenses, third-party cloud services and AI token costs grew faster than revenue.
Why it matters. Investors can read a one-time legal charge as noise. The part that is not noise is the underlying cost growth of 36% (d) against revenue growth of 26%, which is what compresses margin even without the charge.
Source: Meta 10-Q. Excluding the charge is my arithmetic (d); the 10-Q does not give an adjusted figure.
Forensic #2: Revenue Versus Cost Growth
| Growth, Q3 2026 y/y | Rate |
|---|---|
| Ad impressions | +10% |
| Average price per ad | +14% |
| Advertising revenue (d) | +25.9% |
| Total revenue (d) | +26.1% |
| Employee compensation (d) | +7.0% |
| Family of Apps costs | +82% |
| Total costs and expenses (d) | +68.1% |
| Costs excluding legal charge (d) | +35.9% |
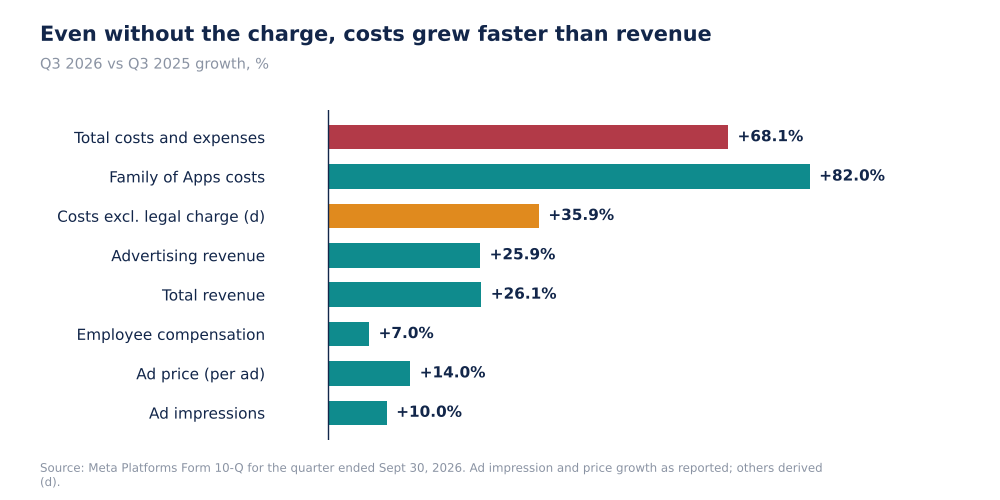
Meta Revenue And Cost Growth, Q3 2026 (Self-Made, 10-Q Data)
Pricing and volume are both contributing: the 14% rise in price per ad on 10% more impressions compounds to about 25.4% (d), close to the 25.9% rise in advertising revenue. Labor is not the problem. Employee compensation rose 7.0% (d) and Family of Apps compensation rose from $10,645M to $12,192M (d: +14.5%). The costs that grew fast are non-labor: other costs and expenses for Family of Apps and Reality Labs combined rose 114% (d), which includes the legal charge.
Why it matters. The headcount cut of 15% and the $1.18 billion of severance in the nine months show cost discipline on people while spending on machines and legal exposure rises.
Source: Meta 10-Q. Growth rates are my arithmetic (d) unless stated by Meta.
Forensic #3: Cash Flow, Capex And Debt
| Nine months, $ millions | 2026 | 2025 |
|---|---|---|
| Net cash from operating activities | 96,873 | 79,586 |
| Purchases of property and equipment | 83,055 | 48,308 |
| Free cash flow (d) | 13,818 | 31,278 |
| Capex / operating cash flow (d) | 85.7% | 60.7% |
| Dividends paid | 4,060 | 3,986 |
| Share repurchases | none | 26,248 |
| Long-term debt (noncurrent), Sept 30 / Dec 31 | 80,922 | 58,744 |
| Proceeds from long-term debt | 24,910 | none |
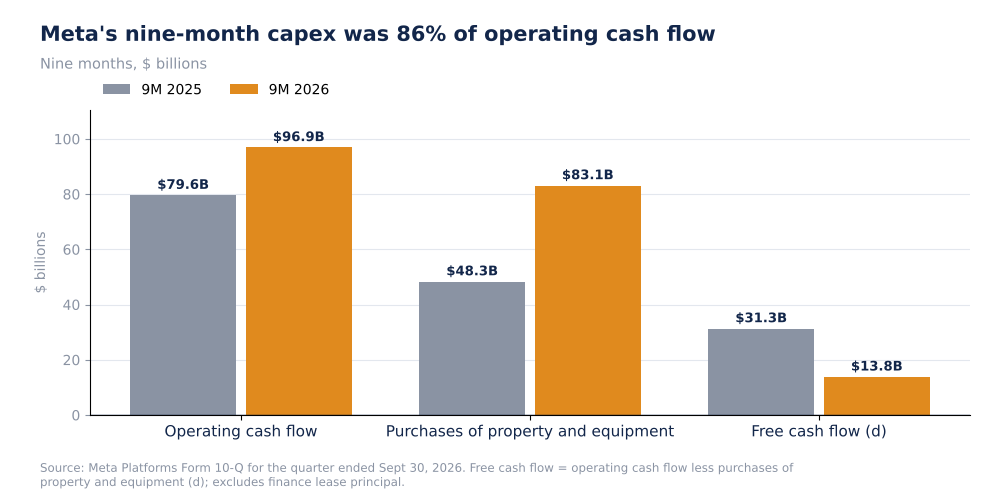
Meta Nine-Month Operating Cash Flow, Capex And Free Cash Flow, $B (Self-Made, d)
Operating cash flow rose $17.3B (d) while capex rose $34.7B (d), so free cash flow on this definition fell from $31.3B to $13.8B (d). Meta stopped buying back shares (none in 2026 against $26.2B in 2025) and issued $24.9B of long-term debt. Cash and marketable securities were $82.45B at September 30 against about $81.6B (d) at December 31, so liquidity was held roughly flat while debt rose. Third-quarter capex including finance lease principal was $34.91B, which uses a different definition from the nine-month figure above.
Why it matters. Stocknote's capex framework article showed Meta's Q3 free cash flow at -$2.1B. The 10-Q confirms the direction: the company is investing at close to its operating cash flow and has switched from buybacks to borrowing.
Source: Meta 10-Q. Free cash flow and ratios are my arithmetic (d).
Forensic #4: The Tax Line And Segment Picture
| Item | Q3 2026 | Q3 2025 |
|---|---|---|
| Provision for income taxes | $3,141M | $18,954M |
| Q3 2026 effective tax rate | 24% | n/a |
| Discrete tax items | Tax Court opinion (Sept 29, 2026) raised provision; amount not in my extract | $15.93B charge on enactment of the One Big Beautiful Bill Act |
| Nine-month 2026 effective tax rate | 2% (incl. $8.03B Q1 benefit from CAMT relief) | n/a |
| Family of Apps operating income | $17,117M (27% margin) | $24,967M (49%) |
| Reality Labs operating loss | $(4,129)M | $(4,432)M |
Taxes distort the net income comparison in both directions: Q3 2025 had a $15.93B charge and the first quarter of 2026 had an $8.03B benefit, which is why the nine-month effective rate is only 2%. Operating income is the cleaner series. Family of Apps operating income fell 31% (d) to $17,117M and Reality Labs lost $4,129M against $4,432M, a $303M (d) improvement on revenue of $443M. If the $9.89B legal charge is booked in Family of Apps (the 10-Q excerpt I read does not say), its margin excluding the charge would be about 42% (d).
Why it matters. Reality Labs still absorbs about 24% (d) of Family of Apps operating income each quarter, so the core business has to carry it.
Source: Meta 10-Q. Derived figures marked (d).
Valuation Snapshot
I have no Meta share price in my sources, so I do not calculate multiples. The earnings base is Q3 operating income of $12,988M reported and about $22,878M before the legal charge (d), on nine-month free cash flow of about $13.8B (d).
| Measure | Value |
|---|---|
| Operating margin, reported / ex-charge (d) | 20.1% / 35.4% |
| Nine-month capex / operating cash flow (d) | 86% |
| Long-term debt | $80.9B |
| Dividends per quarter | about $1.36B |
What has to be true. The spending has to produce revenue growth that keeps ahead of cost growth. Revenue grew 26% and costs excluding the charge about 36% (d), so the gap is currently negative.
Risks: What Would Break The Thesis
- Excerpt limits. The 10-Q text I read ended before capex guidance, free cash flow and headcount detail; guidance is not covered.
- Charge treatment. I assume the legal charge is entirely in operating costs; the 10-Q describes it as part of the cost increase.
- More legal costs. The settlement may not be the last.
- Cost growth. Infrastructure and AI costs may keep outpacing revenue.
- Funding. A rise in borrowing costs raises the price of the build-out.
The reading would be wrong if the legal charge proves to be the whole of the cost increase, which the 10-Q does not support.
What To Watch Next
- Q4 operating margin against 20.1% reported and 35.4% excluding the charge (d).
- Capex guidance and free cash flow in the earnings call.
- Whether buybacks resume or debt keeps rising.
- Legal costs beyond the August settlement.
- Ad price and impression growth against +14% and +10%.
- Reality Labs loss against $4.1B.

Sandeep Gupta
Independent equity research analyst publishing forensic theses on US-listed stocks. MBA, Politecnico di Milano School of Management (Milan, Italy).
Get new research in your inbox
Subscribe to receive forensic equity research the moment it's published. Free, no spam.

Discussion
Be the first to comment.