
Investment Thesis
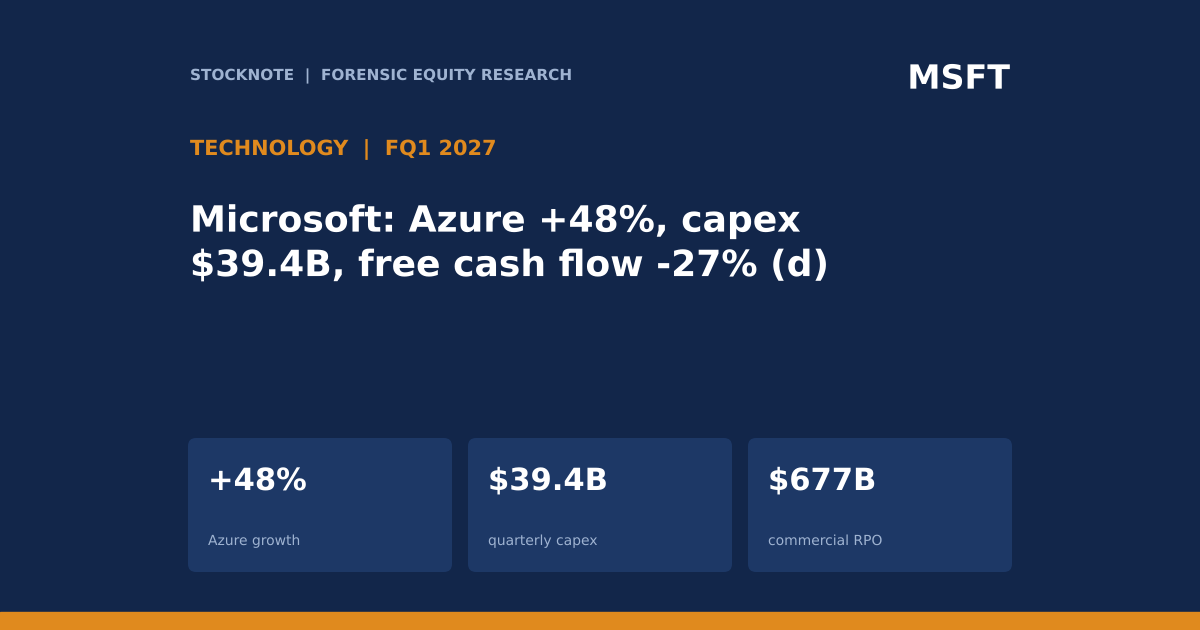
Microsoft's fiscal first quarter of 2027 (July to September 2026) was strong on every income-statement measure: revenue of $92,279 million (+18.8%, d), operating income of $45,915 million (+21.0%, d), Azure revenue of $33,165 million (+48%) and commercial remaining performance obligations of $677 billion (+73%). The cash flow statement shows the cost: capital spending of $39,367 million roughly doubled from $19,394 million, and free cash flow, calculated as operating cash flow less capex, fell 27% (d) to about $18.6 billion even though operating cash flow rose to $58.0 billion.
- Income. Revenue $92,279M (year-ago $77,673M); operating income $45,915M ($37,961M); GAAP net income $36,629M (+32%); GAAP EPS $4.92; non-GAAP EPS $4.89 (+18%).
- Segments. Agents and Infra revenue $76,795M (+25%), operating income $40,558M; Devices and Consumer revenue $15,484M (-3%).
- Cloud. Microsoft Cloud $63.9B (+30%); Azure $33,165M (+48%); Microsoft 365 commercial cloud +17%; commercial RPO $677B (+73%).
- Cash. Operating cash flow $58,000M ($45,057M); capex $39,367M ($19,394M); free cash flow about $18,633M (about $25,663M), calculated by me (d).
- Returns. Dividends $6,757M and repurchases $4,379M; the release states $10.2B returned in total.
- This article contains no rating, price target or investment advice. Derived figures are marked (d).
Bottom line. Microsoft is converting a growing share of its cash into data-centre capacity ahead of revenue: capex was 68% of operating cash flow (d) against 43% (d) a year earlier. Commercial backlog of $677 billion is the evidence that the capacity has buyers, but a backlog is a promise to buy and not revenue, and the cash cost arrives first.
Source: Microsoft fiscal Q1 2027 earnings release (third-party hosted copy).
Fiscal Q1 2027 At A Glance
| $ millions | FQ1 2027 | FQ1 2026 | Change |
|---|---|---|---|
| Revenue | 92,279 | 77,673 | +18.8% (d) |
| Operating income | 45,915 | 37,961 | +21.0% (d) |
| Operating margin (d) | 49.8% | 48.9% | +0.9 pts |
| GAAP net income | 36,629 | n/a | +32% |
| Operating cash flow | 58,000 | 45,057 | +29% (d) |
| Capex | 39,367 | 19,394 | +103% (d) |
| Free cash flow (d) | 18,633 | 25,663 | -27% (d) |
Source: Microsoft release (third-party copy). Free cash flow is operating cash flow less capex (d).
What The Market Believes vs. What The Data Actually Shows
| Belief | What the data show |
|---|---|
| Earnings growth equals cash growth | Operating income rose 21% (d) and operating cash flow 29% (d), but free cash flow fell 27% (d). |
| AI spending is a margin drag | Operating margin rose to 49.8% from 48.9% (d); the capex shows up first in cash and later in depreciation. |
| Microsoft 365 is the growth engine | Azure grew 48% against 17% for Microsoft 365 commercial cloud; Devices and Consumer fell 3%. |
| Backlog guarantees revenue | Commercial RPO of $677B is 10.6x (d) this quarter's Microsoft Cloud revenue of $63.9B, but the timing of recognition is not in my extract. |
| Shareholder returns are comfortably covered | $10.2B stated returned against about $18.6B of free cash flow (d): 55% (d). |
Forensic #1: Growth By Business
| Growth y/y, FQ1 2027 | Rate | Level ($M unless stated) |
|---|---|---|
| Azure | +48% | 33,165 |
| Microsoft Cloud | +30% | 63,900 |
| Agents and Infra segment | +25% | 76,795 (op. income 40,558) |
| Microsoft 365 commercial cloud | +17% | n/a |
| Devices and Consumer | -3% | 15,484 |
| Total revenue (d) | +18.8% | 92,279 |
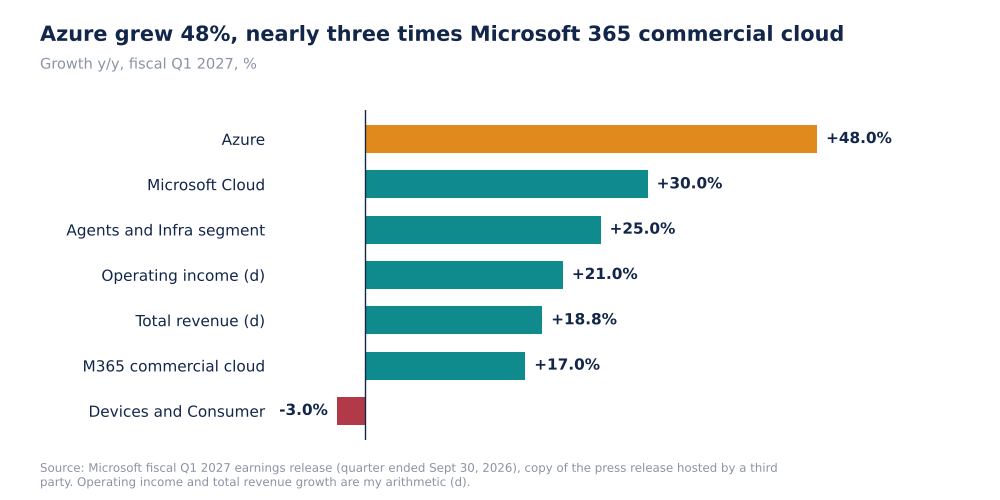
Microsoft FQ1 2027 Growth By Business (Self-Made, Microsoft Data, d Where Marked)
The two reported segments sum to total revenue ($76,795 million plus $15,484 million equals $92,279 million). Agents and Infra generated 52.8% (d) operating margin and 88% (d) of total operating income. Azure at $33,165 million is 52% (d) of Microsoft Cloud revenue, the part of the company growing fastest.
Why it matters. The growth is concentrated in the infrastructure business. Microsoft 365 commercial cloud growing 17% is solid, and Devices and Consumer is shrinking; the extract does not split capex by business, so I cannot say which business the spending serves.
Source: Microsoft release. Margins and shares are my arithmetic (d).
Forensic #2: Cash Flow And Capex
| $ millions | FQ1 2026 | FQ1 2027 |
|---|---|---|
| Operating cash flow | 45,057 | 58,000 |
| Capex | 19,394 | 39,367 |
| Free cash flow (d) | 25,663 | 18,633 |
| Capex growth (d) | +103% | |
| Operating cash flow growth (d) | +29% |
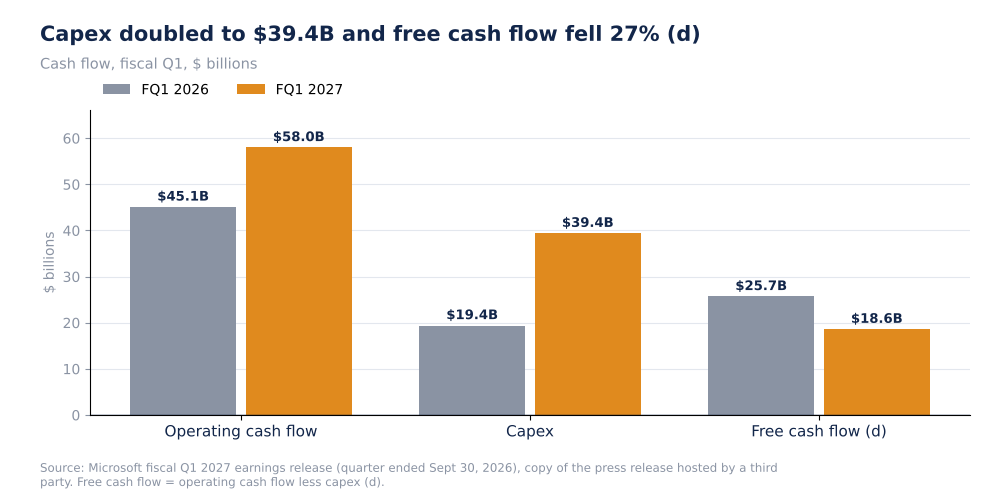
Microsoft Operating Cash Flow, Capex And Free Cash Flow, FQ1 2026 Vs FQ1 2027, $B (Self-Made, d)
Operating cash flow rose $12.9 billion (d) while capex rose $20.0 billion (d), so the increase in spending was 1.5 times the increase in operating cash (d). Free cash flow therefore fell by $7.0 billion (d). Capex may include assets acquired under finance leases and other items depending on Microsoft's definition; the extract does not give that detail, so the free cash flow here is a simple calculation, not a figure Microsoft reports.
Why it matters. Capacity is bought with cash up front, and the revenue arrives later. A single quarter's free cash flow is also noisy, so one decline does not set a trend. But a doubling of capex in a year means depreciation will rise for years, which will pressure margins even if revenue grows.
Source: Microsoft release. Free cash flow and changes are my arithmetic (d).
Forensic #3: Capex Intensity
| Ratio (d) | FQ1 2026 | FQ1 2027 |
|---|---|---|
| Capex / operating cash flow | 43.0% | 67.9% |
| Capex / revenue | 25.0% | 42.7% |
| Operating margin | 48.9% | 49.8% |
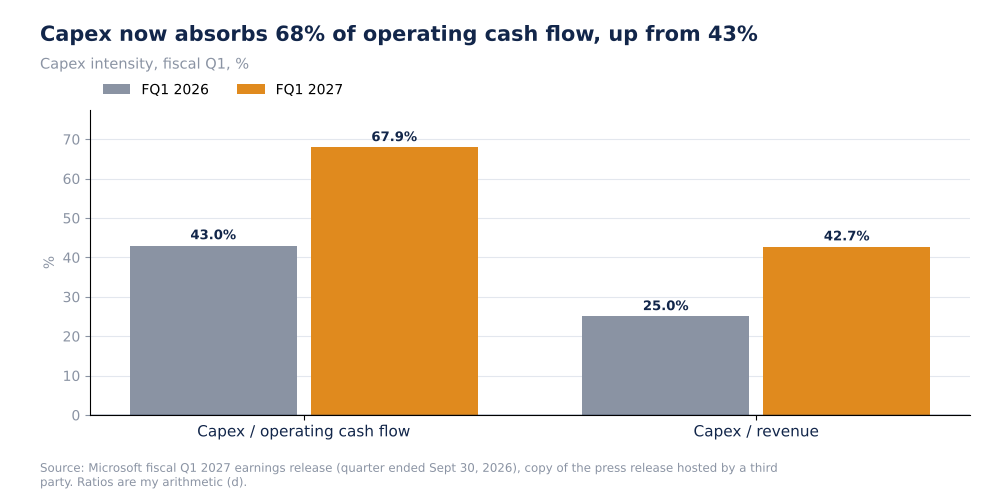
Microsoft Capex Intensity, FQ1 2026 Vs FQ1 2027 (Self-Made, d)
Capex intensity measured against revenue went from 25.0% to 42.7% (d). Against operating cash flow it went from 43.0% to 67.9% (d). Operating margin still rose, which is consistent with the point that depreciation lags capex: the cost of the spending is not yet in operating income in full. The extract does not give depreciation, so I cannot measure the lag. The batch of figures matches the capex-intensity comparison across hyperscalers in Stocknote's capex article, which used the same $39.4 billion and $92.3 billion.
Why it matters. A business that spends 43 cents of each revenue dollar on capex and still reports a 49.8% operating margin is, in effect, reporting profit before the full cost of the assets it is building. The test is how margin behaves over the next several quarters as depreciation catches up.
Source: Microsoft release. Ratios are my arithmetic (d).
Forensic #4: Backlog And Shareholder Returns
| Item | Amount |
|---|---|
| Commercial RPO | $677B (+73%) |
| Microsoft Cloud revenue, FQ1 | $63.9B |
| RPO / quarterly Microsoft Cloud revenue (d) | 10.6x |
| Dividends (cash flow) | $6,757M |
| Repurchases (cash flow) | $4,379M |
| Sum of the two (d) | $11,136M |
| Total returned, as stated in the release | $10.2B |
| OpenAI-related net gain | $207M |
A backlog 73% larger than a year ago and equal to 10.6 quarters of Microsoft Cloud revenue (d) supports the capex, but the extract does not give what share is recognised within 12 months, so the conversion into revenue cannot be timed. The dividends and repurchases lines add to $11,136 million (d), which does not equal the $10.2 billion the release states as returned. I do not know whether the difference is timing (declared versus paid) or definition, so I use the stated $10.2 billion for coverage. Against free cash flow of about $18.6 billion (d), that is 55% (d), or 60% (d) using the cash flow lines. The OpenAI-related net gain of $207 million is small against $45.9 billion of operating income.
Why it matters. Returns are covered by free cash flow even after the capex doubling, so the dividend is not at risk on these numbers. The comparison that matters is how long operating cash flow can keep growing as fast as capex.
Source: Microsoft release. Ratios are my arithmetic (d).
Valuation Snapshot
I have no Microsoft share price in my sources, and the release contains no guidance, so I do not calculate multiples or forecasts. The quarter's earnings base is non-GAAP EPS of $4.89 and GAAP EPS of $4.92.
| Measure | FQ1 2027 |
|---|---|
| GAAP EPS / non-GAAP EPS | $4.92 / $4.89 |
| Operating margin (d) | 49.8% |
| Free cash flow (d) | $18.6B |
| Capex / revenue (d) | 42.7% |
What has to be true. For the capex to earn an adequate return, Azure growth has to stay far above the growth in capital cost, and the $677 billion backlog has to convert into revenue at a pace consistent with depreciation.
Risks: What Would Break The Thesis
- Source. The figures come from a third-party-hosted copy of the release.
- Free cash flow definition. It is my calculation and may differ from Microsoft's.
- Depreciation lag. Margins could fall as the capex is depreciated; depreciation is not in my extract.
- Backlog timing. RPO is not revenue.
- Returns reconciliation. $10.2B stated against $11.1B from the cash flow lines.
The reading would be wrong if the release defines capex to include finance leases that are not cash, or if operating cash flow growth accelerated past capex.
What To Watch Next
- Microsoft's 10-Q for the quarter, for capex detail and depreciation.
- Azure growth against 48%.
- Operating margin as depreciation rises.
- Capex against operating cash flow (68% this quarter).
- Commercial RPO against $677B and its recognition schedule.
- Management guidance on capex on the earnings call.

Sandeep Gupta
Independent equity research analyst publishing forensic theses on US-listed stocks. MBA, Politecnico di Milano School of Management (Milan, Italy).
Get new research in your inbox
Subscribe to receive forensic equity research the moment it's published. Free, no spam.
Discussion
Be the first to comment.