
Investment Thesis
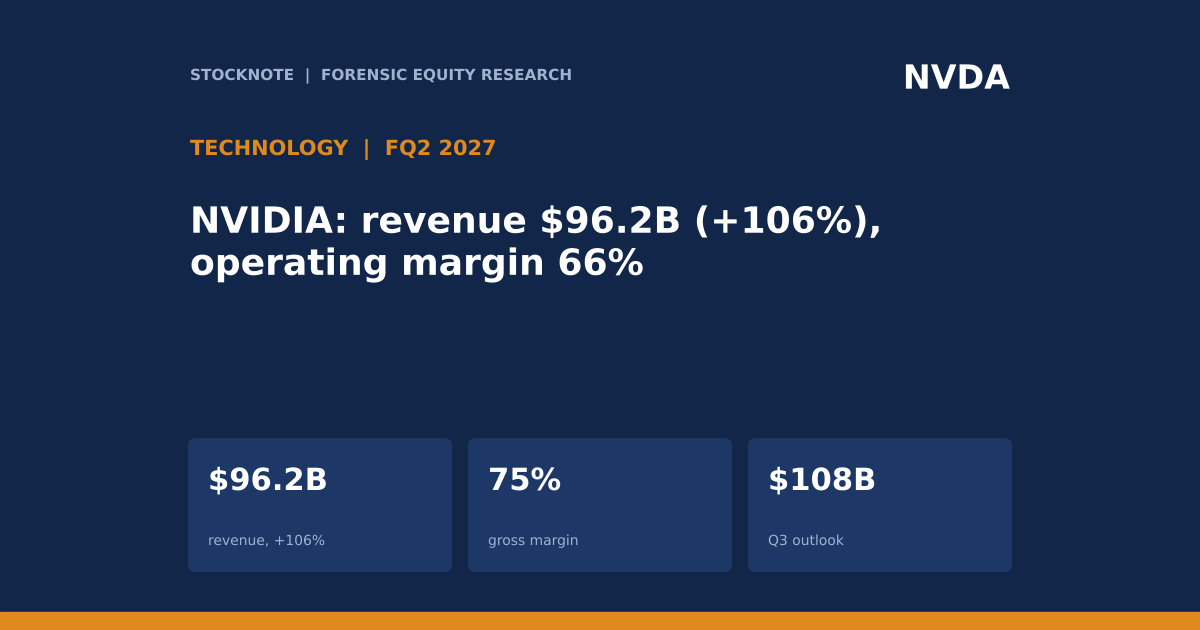
NVIDIA's fiscal second quarter of 2027 (ended July 26, 2026) produced revenue of $96.2 billion, up 106% from $46.7 billion a year earlier and up 18% from the first quarter. Data Center revenue was $89.0 billion (+117%), or 92.5% (d) of the total. GAAP gross margin was 75.0% against 72.4%, operating income $63.7 billion (+124%) and net income $59.7 billion (+126%). The outlook for the third quarter is revenue of about $108 billion (plus or minus 2%) with gross margin of about 74%, and it assumes no China Data Center compute revenue. Source caution: these figures come from two secondary reports of NVIDIA's release (Pulse 2 and StorageNewsletter); I could not open NVIDIA's own release. Some figures are from the text of those reports only and are checked against each other.
- Revenue. $96.2B (+106% y/y, +18% q/q); Data Center $89.0B (+117%); Edge Computing $7.2B (+27%).
- Profit. GAAP gross profit $72.1B (year-ago $33.9B); operating income $63.7B ($28.4B); net income $59.7B ($26.4B); GAAP EPS $2.46 ($1.08); non-GAAP EPS $2.22; non-GAAP net income $54.0B.
- Capital return. About $26B of buybacks and dividends in the quarter; about $99B of repurchase authorization remaining; dividend $0.25 a share.
- Outlook. Q3 revenue $108B (+/-2%); gross margin about 74% (+/-50 basis points); GAAP operating expenses about $9.2B; no China Data Center compute revenue assumed.
- This article contains no rating, price target or investment advice. Derived figures are marked (d).
Bottom line. The company converted 71% (d) of each additional dollar of revenue into operating income over the year, which is exceptional operating leverage. What the outlook adds is a small step down in gross margin and a growth rate that slows from 18% to about 12% a quarter (d), which is the first sign in these numbers that the rate of increase is easing even as the level keeps rising.
Sources (secondary): Pulse 2; StorageNewsletter.
Fiscal Q2 2027 At A Glance
| $ billions | Q2 FY2027 | Q2 FY2026 | Change |
|---|---|---|---|
| Revenue | 96.2 | 46.7 | +106% |
| Data Center revenue | 89.0 | 41.0 (d) | +117% |
| GAAP gross profit | 72.1 | 33.9 | +113% (d) |
| GAAP gross margin | 75.0% | 72.4% | +2.6 pts |
| GAAP operating income | 63.7 | 28.4 | +124% |
| Operating margin (d) | 66.2% | 60.8% | +5.4 pts |
| GAAP net income | 59.7 | 26.4 | +126% |
| Implied operating expenses (d) | 8.4 | 5.5 | +53% |
Sources (secondary): Pulse 2; StorageNewsletter. Year-ago Data Center revenue is back-solved from the stated growth rate (d).
What The Market Believes vs. What The Data Actually Shows
| Belief | What the data show |
|---|---|
| Growth is a one-product story | Data Center was 92.5% (d) of revenue; the other business line, Edge Computing, grew 27%. |
| Margins have peaked | Gross margin rose 2.6 points to 75.0% but the outlook is about 74%, a one-point step down at the midpoint. |
| Growth is accelerating | Sequential growth was 18% in Q2 and the outlook midpoint implies about 12% (d) for Q3. |
| Reported earnings overstate | GAAP net income ($59.7B) was higher than non-GAAP ($54.0B) by $5.7B (d); non-GAAP EPS ($2.22) was below GAAP EPS ($2.46). |
| China is a risk to the outlook | The outlook assumes no China Data Center compute revenue, so the $108B excludes it. |
Forensic #1: Operating Leverage
| $ billions | Q2 FY2026 | Q2 FY2027 | Change (d) |
|---|---|---|---|
| Revenue | 46.7 | 96.2 | +49.5 |
| Gross profit | 33.9 | 72.1 | +38.2 |
| Operating expenses (gross profit less operating income) | 5.5 | 8.4 | +2.9 |
| Operating income | 28.4 | 63.7 | +35.3 |
| Incremental operating margin | 71% |
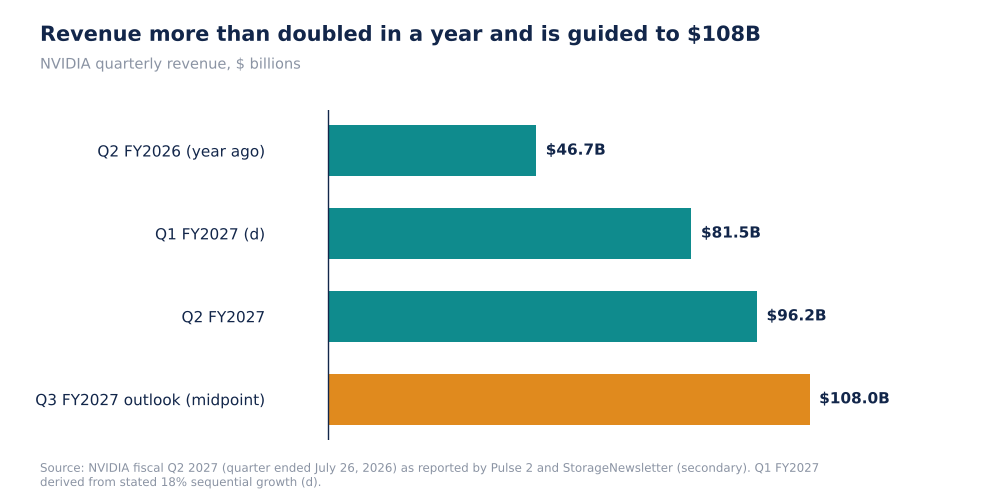
NVIDIA Quarterly Revenue And Outlook, $B (Self-Made, Secondary Data)
Revenue rose $49.5B (d) while operating expenses rose only $2.9B (d), so $35.3B (d) of the $49.5B increase reached operating income: an incremental margin of 71% (d). Operating expenses grew 53% (d) against revenue growth of 106%. Operating expenses are derived as gross profit less operating income, which assumes there are no other operating lines; the outlook's $9.2B GAAP opex is consistent with the $8.4B derived here.
Why it matters. High incremental margins mean profit grows faster than revenue on the way up and, by the same arithmetic, falls faster if revenue stalls, because costs are not as flexible as they look.
Sources (secondary): Pulse 2; StorageNewsletter. Derived figures marked (d).
Forensic #2: What The Outlook Implies
| Q3 FY2027 outlook | Value |
|---|---|
| Revenue (midpoint) | $108.0B |
| Revenue range (+/-2%) (d) | $105.8B to $110.2B |
| Gross margin | 74.0% (+/-50 bp) |
| GAAP operating expenses | $9.2B |
| Implied gross profit (d) | $79.9B |
| Implied operating income (d) | $70.7B |
| Implied operating margin (d) | 65.5% |
| Sensitivity: 1 point of gross margin (d) | $1.08B |
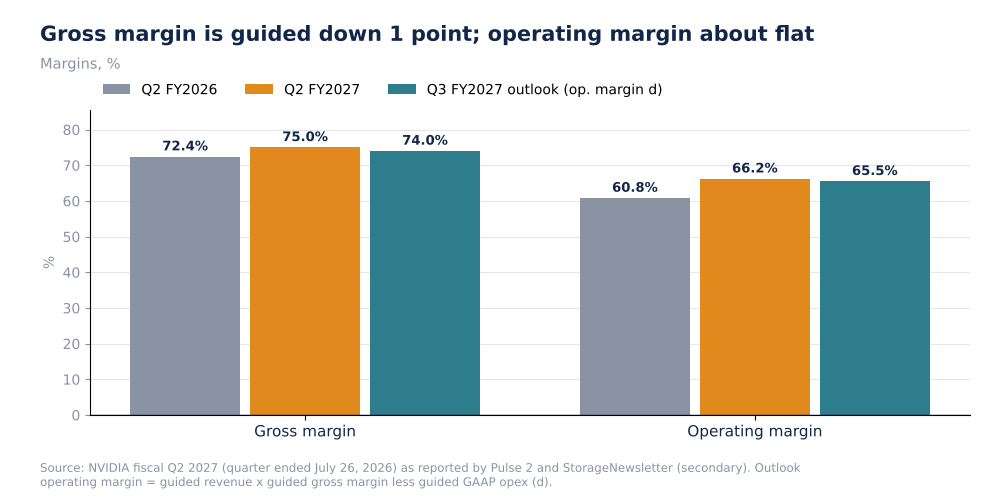
NVIDIA Gross And Operating Margin, With Outlook-Implied Figure (Self-Made, d)
On the outlook, operating income would be about $70.7B (d), up 11% (d) from the second quarter, with a margin of 65.5% (d) against 66.2%. The margin guidance has a plus-or-minus half point band, worth about $0.54B (d) of gross profit each way, and the revenue range of plus or minus 2% is worth about $2.2B. These are my calculations from guidance and not company guidance for operating income.
Why it matters. A guide that implies slightly lower gross margin and flat operating margin says that the next step in profit comes from volume, not mix. Anything that lowers volume, for example restrictions on shipments, shows up almost one-for-one in operating income.
Sources (secondary): Pulse 2; StorageNewsletter. Implied figures marked (d).
Forensic #3: Growth By Line And Earnings Quality
| Q2 FY2027 growth y/y | Rate |
|---|---|
| GAAP EPS | +128% |
| GAAP net income | +126% |
| GAAP operating income | +124% |
| Data Center | +117% |
| Total revenue | +106% |
| Edge Computing | +27% |
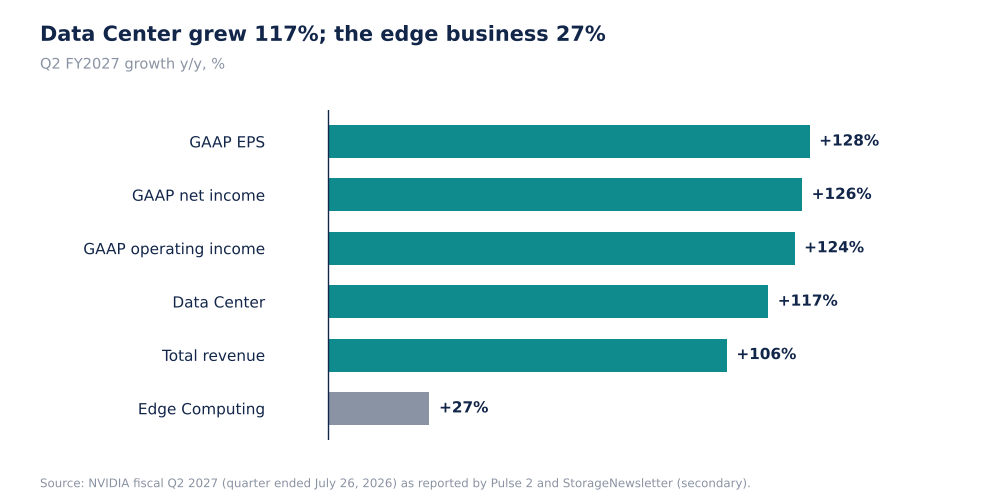
NVIDIA Q2 FY2027 Growth By Measure (Self-Made, Secondary Data)
Each profit line grew faster than revenue, which is the leverage effect in Forensic #1. The gap between GAAP and non-GAAP is unusual: GAAP net income of $59.7B exceeds non-GAAP net income of $54.0B by $5.7B (d), and GAAP EPS of $2.46 exceeds non-GAAP EPS of $2.22. In most companies non-GAAP is higher. The extract does not say what is excluded; the usual reason for this direction is gains that non-GAAP excludes, but that is an inference and I cannot confirm it. With a full-year tax rate guided at 16% to 18%, net income of $59.7B implies pre-tax income of about $71B to $73B (d), above operating income of $63.7B, so roughly $7B to $9B (d) of non-operating income appears to be in the quarter. That is consistent with the GAAP and non-GAAP gap, but the sources do not itemise it.
Why it matters. Non-GAAP EPS ($2.22) is the lower and more conservative base for this quarter. A comparison on GAAP EPS would overstate the underlying run-rate if gains are not repeated.
Sources (secondary): Pulse 2; StorageNewsletter. Derived figures marked (d).
Forensic #4: Capital Return And Concentration
| Item | Value |
|---|---|
| Capital returned in quarter | about $26B (buybacks and dividends) |
| Repurchase authorization remaining | about $99B |
| Returned as % of GAAP net income (d) | 44% |
| Data Center as % of revenue (d) | 92.5% |
| Dividend | $0.25 a share (payable Oct 1, 2026) |
| Full-year FY2027 tax rate guidance | 16% to 18% |
| First-half FY2027 revenue (from a reader comment in one source) | $177.8B |
NVIDIA returned about 44% of GAAP net income (d) in the quarter. The quarter's concentration is the main structural risk: over 92% of revenue is Data Center, and the outlook excludes China compute revenue, so any change in that policy is upside or downside to the $108B that the guide does not contain. The first-half revenue figure of $177.8B (from a reader comment on one of the sources) is consistent with the $81.5B and $96.2B quarters (d: $177.7B).
Why it matters. A buyback of this size at a time of high margins is a decision about the price of the shares and about the durability of earnings; neither is in my extracts.
Sources (secondary): Pulse 2; StorageNewsletter.
Valuation Snapshot
I have no share price for NVIDIA in my sources, so no multiples are calculated. The earnings base is quarterly GAAP EPS of $2.46 and non-GAAP EPS of $2.22.
| Measure | Value |
|---|---|
| Annualised GAAP operating income, Q2 x4 (d) | $255B |
| Outlook-implied Q3 operating income (d) | $70.7B |
| Remaining buyback authorization | about $99B |
What has to be true. For the Q3 outlook to hold, Data Center demand must keep growing at about 12% sequentially without China compute revenue, and gross margin must stay near 74%.
Risks: What Would Break The Thesis
- Secondary sources. NVIDIA's release and 10-Q were not opened.
- Derived operating expenses. Gross profit less operating income assumes no other operating lines.
- Concentration. Over 92% of revenue is Data Center.
- Outlook assumes no China compute revenue.
- Quarter age. The next report is due in late November.
The reading would be wrong if NVIDIA's own release shows a different segment split or a different explanation for the GAAP and non-GAAP gap.
What To Watch Next
- The fiscal Q3 2027 report, due in late November, against the $108B outlook.
- Gross margin against 74%.
- Sequential growth against the implied 12%.
- Any change to China export rules.
- Operating expenses against $9.2B.
- Capital return against the $99B authorization.

Sandeep Gupta
Independent equity research analyst publishing forensic theses on US-listed stocks. MBA, Politecnico di Milano School of Management (Milan, Italy).
Get new research in your inbox
Subscribe to receive forensic equity research the moment it's published. Free, no spam.
Related Research
Latest earnings releases: NVDA
— NVIDIA Announces Financial Results for Second Quarter Fiscal 2027
Discussion
Be the first to comment.