

Investment Thesis
Meta's ad business is still growing 26%, but in Q3 costs grew faster than revenue, capex outran operating cash flow, and net cash nearly disappeared.
- Earnings. Revenue rose 26% to $64.6B. Excluding the $9.89B legal charge, operating income rose 11.4% to $22.9B and EPS about 2% ($7.40 vs $7.25). Reported operating margin was 20%; ex-charge it was 35.4% vs 40.1%.
- Costs. Ex-charge costs rose 36%, led by cost of revenue (+45%) and general and administrative (+41%). Headcount fell 15%, but share-based compensation rose 33%.
- Cash. Operating cash flow was about $32B in each of Q1, Q2 and Q3, while capex rose from $19.8B to $31.1B to $34.9B. Free cash flow went from +$12.4B to +$0.8B to -$2.1B. Q4 guidance implies $49B to $59B of capex.
- Balance sheet. Cash and securities minus long-term debt fell from +$22.8B to +$1.5B in nine months. Meta borrowed $24.9B and bought back no stock in 2026.
- Funding route. New non-voting Class C stock arrives January 19, 2027. Each 1% sold would raise about $16B, and Zuckerberg's 60.6% voting power would be unchanged. No sale has been announced.
- Stock. It closed at $648.85 on Oct 22 (-6.98%) and traded near $624 on Oct 27, 10.6% below its pre-earnings close. That is about 21x annualised Q3 earnings ex-charge, while nine-month free cash flow equals 0.7% of market value.
This article contains no price target or rating. Every figure comes from Meta's SEC filings or a named source, and anything I calculated is marked.
Source: Meta Q3 2026 press release, SEC 8-K.
Q3 2026 At A Glance
Revenue grew 26% to $64.6B, but operating income fell 37% to $13.0B because of a $9.89B legal charge, and free cash flow turned negative.
| Metric (quarter ended Sept 30) | Q3 2026 | Q3 2025 | Change |
|---|---|---|---|
| Revenue | $64,601M | $51,242M | +26% |
| Costs and expenses | $51,613M | $30,707M | +68% |
| Income from operations | $12,988M | $20,535M | -37% |
| Operating margin | 20% | 40% | -20 pts |
| Net income | $9,860M | $2,709M | +264% |
| Diluted EPS | $3.83 | $1.05 | +265% |
| Effective tax rate | 24% | 87% | n/m |
| Operating cash flow | $32,786M | $29,999M | +9% |
| Capex incl. finance-lease principal | $34,906M | $19,374M | +80% |
| Free cash flow | -$2,120M | $10,625M | swing of -$12.7B |
| Headcount | 66,775 | n/a | -15% |
| Daily active people (family of apps) | 3.64B | n/a | +3% |
Q3 2025 net income and EPS were depressed by a one-time $15.9B non-cash tax charge, so the +264% EPS change is not a like-for-like comparison. Source: Meta Q3 2026 press release, SEC 8-K Exhibit 99.1, Oct 21, 2026.
What The Market Believes vs. What The Data Actually Shows
Without the $9.89B charge, Q3 operating income was $22.88B, up 11.4%, and the gap to revenue growth widens further down the income statement.
| Line (ex-charge) | Q3 2026 | Q3 2025 | Change |
|---|---|---|---|
| Revenue | $64,601M | $51,242M | +26.1% |
| Costs and expenses | $41,723M | $30,707M | +35.9% |
| Income from operations | $22,878M | $20,535M | +11.4% |
| Operating margin | 35.4% | 40.1% | -4.7 pts |
| Interest and other income, net | $13M | $1,128M | -$1.1B |
| Pre-tax income | $22,891M | $21,663M | +5.7% |
| Effective tax rate | 17% | about 14% | +3 pts |
| Diluted EPS | $7.40 | $7.25 | +2% |
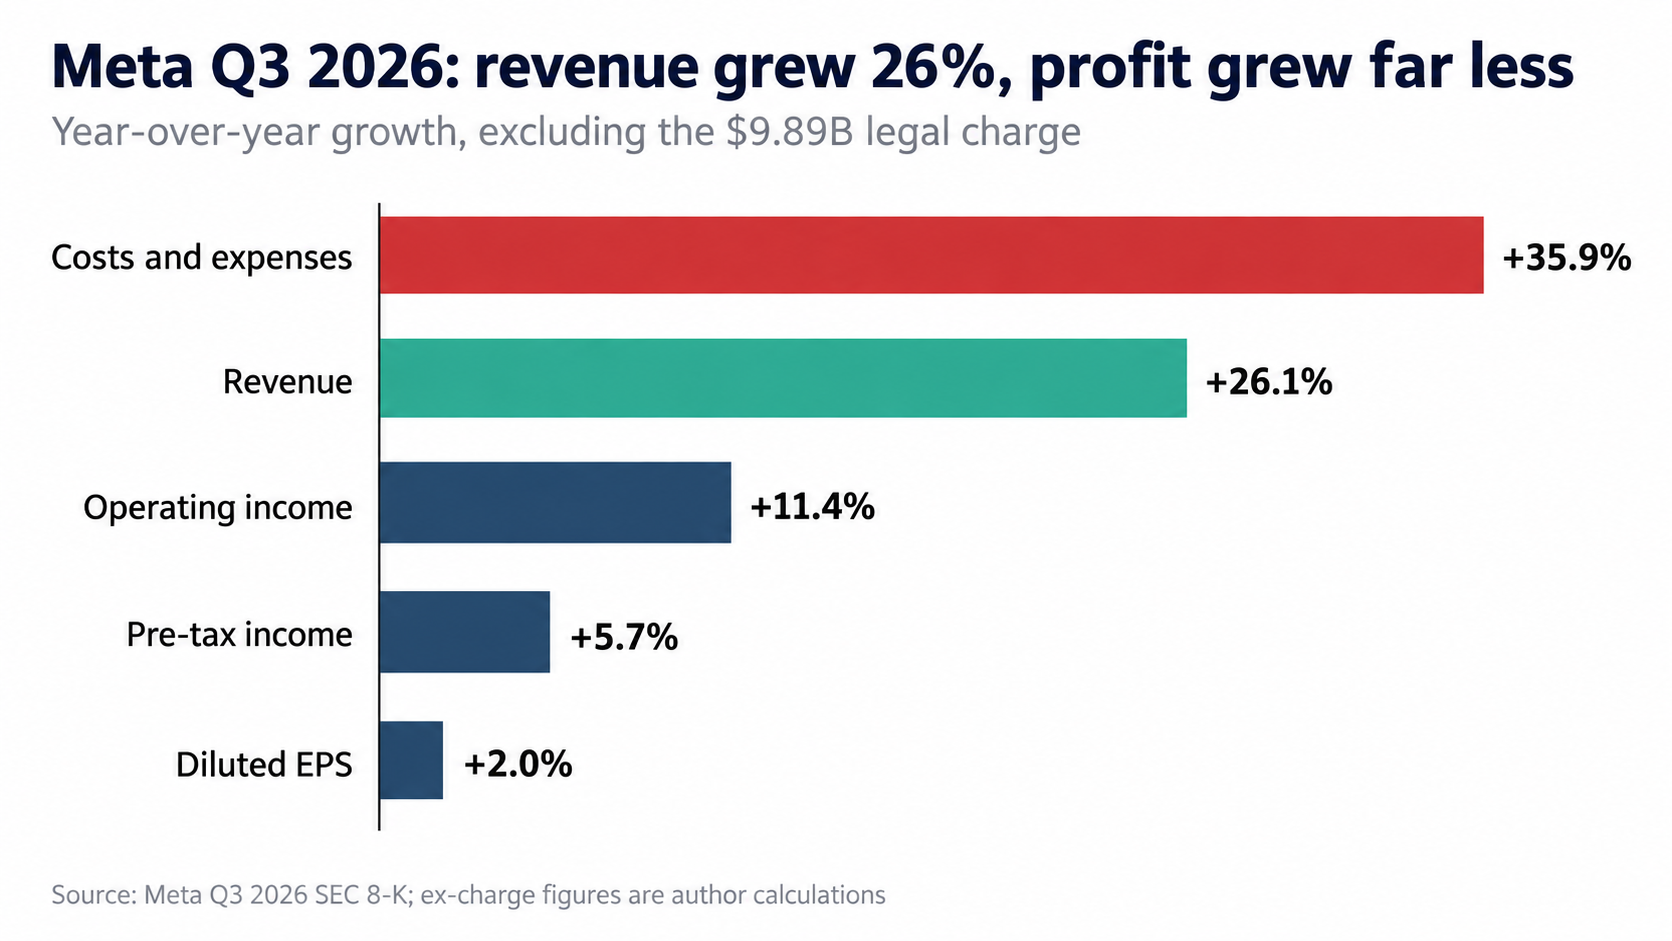
Meta Q3 2026: Revenue vs Profit Growth, Excluding the $9.89B Legal Charge (Self-Made)
Costs excluding the charge grew about 10 points faster than revenue. The swing in interest income, from +$1.1B to roughly zero, and a higher tax rate then take operating growth of 11% down to EPS growth of 2%.
How the table was built: ex-charge operating income, EPS ($7.40) and tax rate (17%) are Meta's own figures. Ex-charge costs and pre-tax income are my arithmetic (reported figure plus $9,890M). The Q3 2025 comparison ($7.25 EPS) excludes that quarter's one-time $15.9B non-cash tax charge, per Meta's Q3 2025 disclosure as reported by Motley Fool via Webull; the 14% tax rate is derived from Meta's $18.6B ex-charge net income that quarter.
Earnings quality note. Meta's nine-month provision for income taxes was $1,028M on $53,509M of pre-tax income (1.9%), against 24% in Q3 alone. Subtracting Q3's $3,141M implies a net tax benefit of about $2.1B in the first half (derived). That is why nine-month EPS of $20.44 is a poor base for annualising; operating income is cleaner. Meta guides Q4 tax at 15% to 17%. Source: Meta 8-K, Oct 21, 2026.
Forensic #1: Operating Cash Flow Is Flat While Capex Rose 76%
Revenue growth slowed from 33% to 26% across the first three quarters, operating cash flow barely moved, and free cash flow fell from +$12.4B to -$2.1B.
| ($M unless noted) | Q1 2026 | Q2 2026 | Q3 2026 |
|---|---|---|---|
| Revenue | 56,310 (d) | 60,801 | 64,601 |
| Revenue growth, YoY | +33% (d) | +28% | +26% |
| Income from operations | 22,872 (d) | 18,775 | 12,988 |
| Operating margin, reported | 40.6% (d) | 30.9% | 20.1% |
| Operating margin excl. disclosed legal charges and severance | n/a | 36.8% (d) | 35.4% (d) |
| Operating cash flow | 32,226 (d) | 31,862 | 32,786 |
| Capex incl. finance-lease principal | 19,840 (d) | 31,078 | 34,906 |
| Free cash flow | 12,386 (d) | 784 | -2,120 |
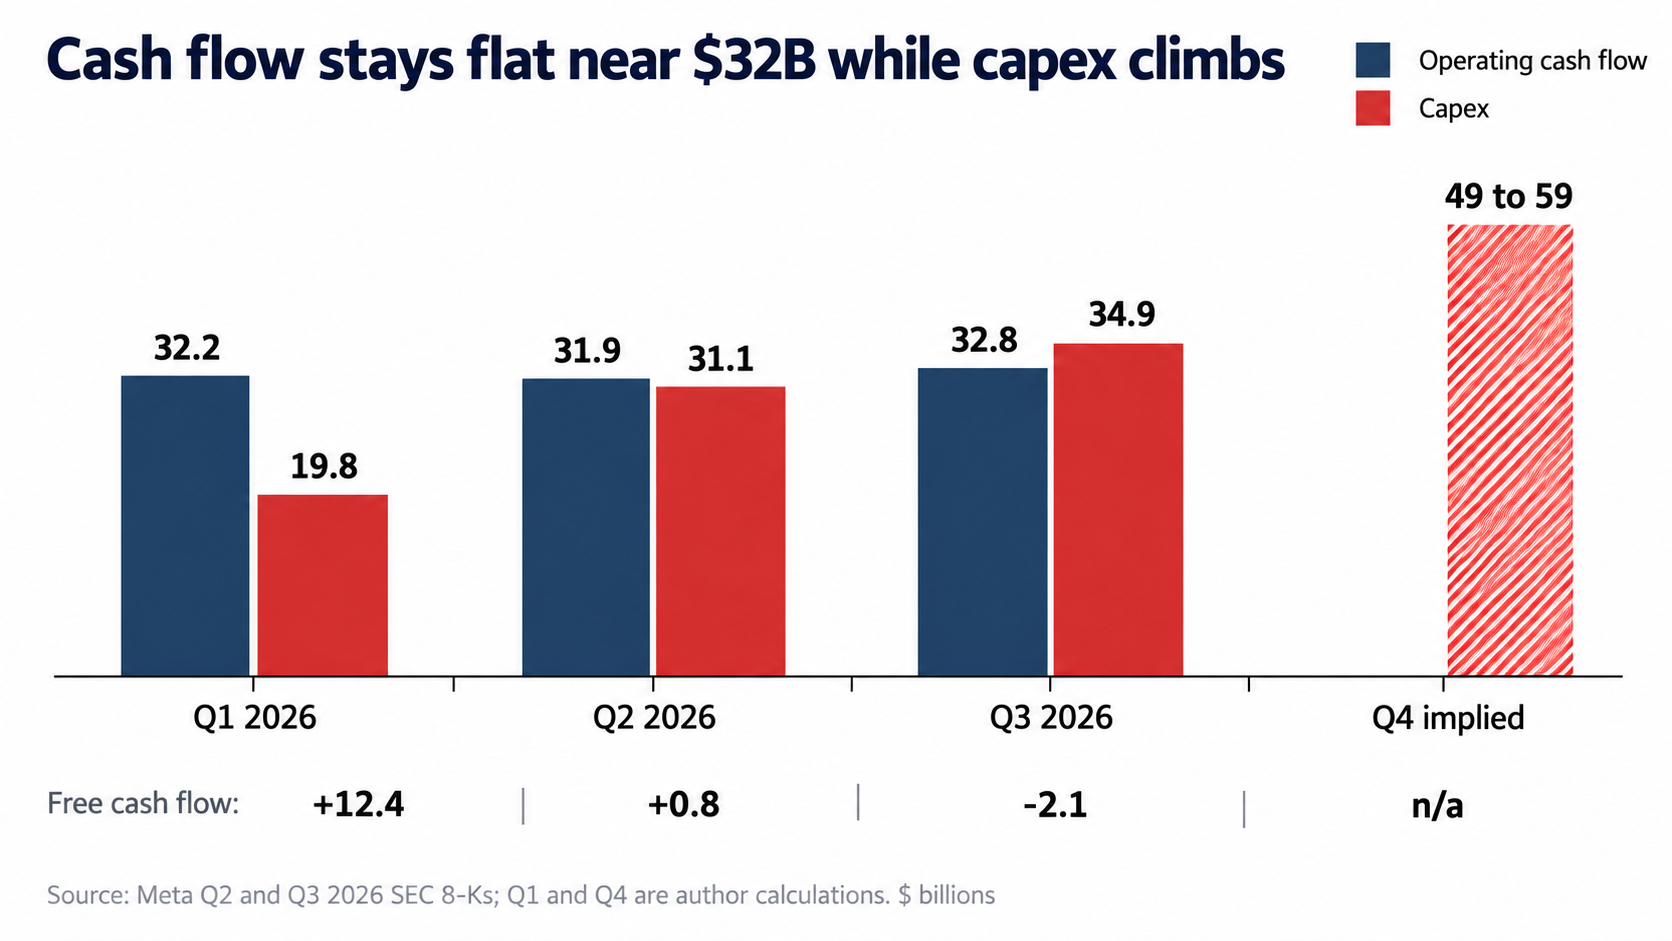
Operating Cash Flow vs Capex, Q1 to Q4 2026 (Self-Made)
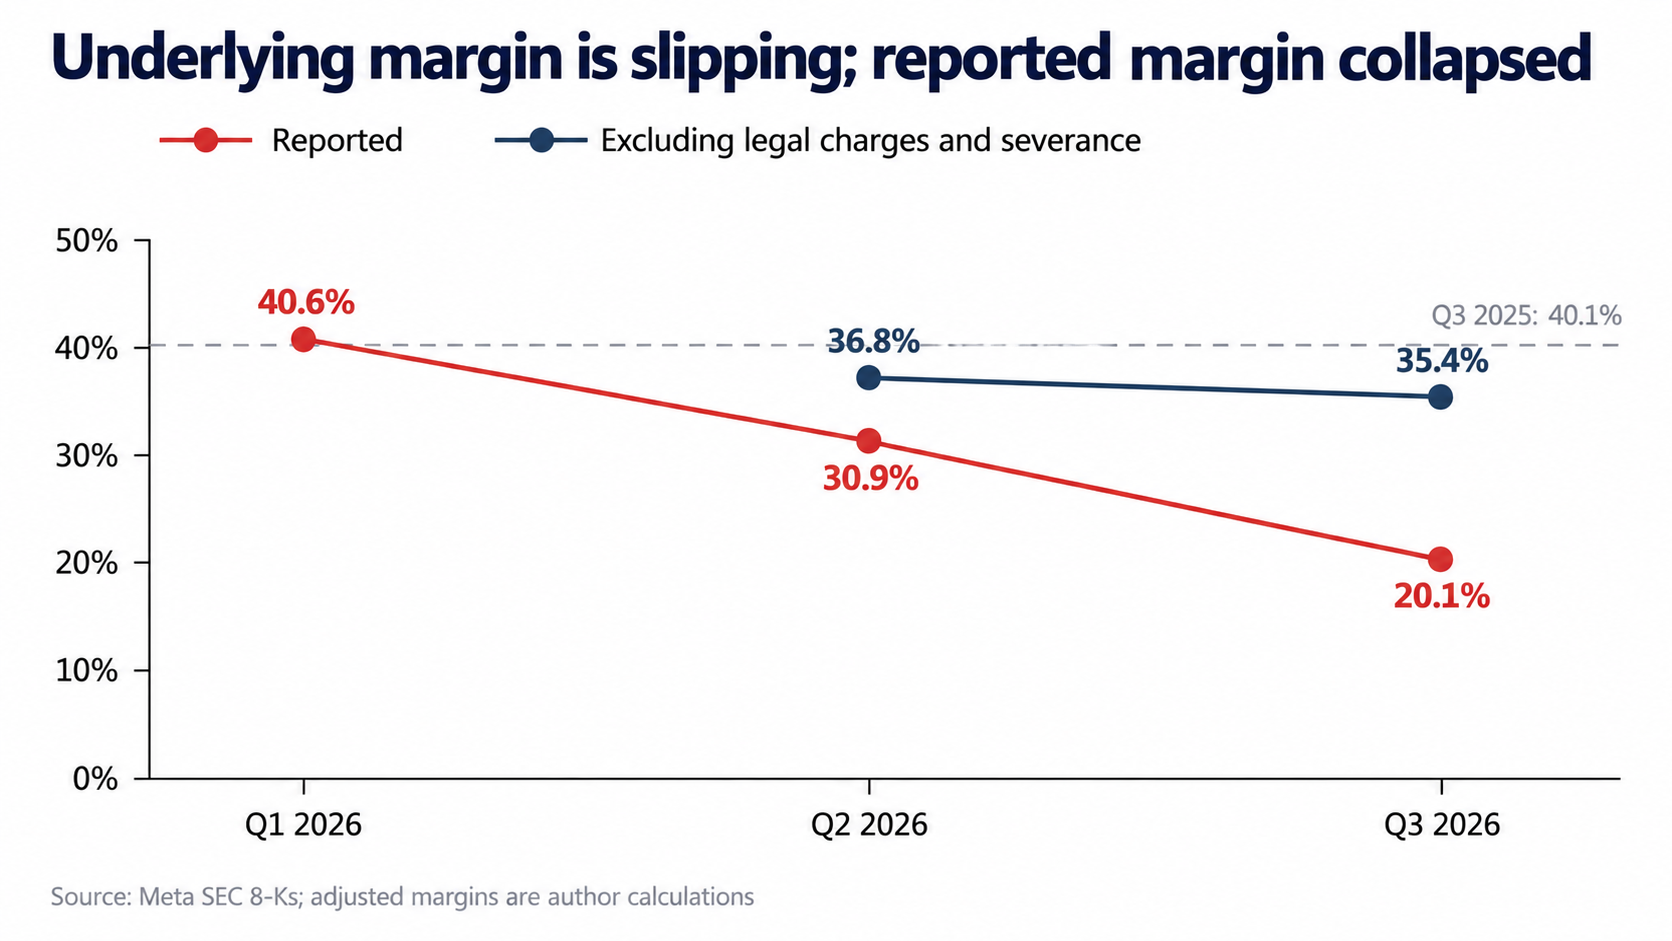
Operating Margin: Reported vs Excluding Disclosed Charges (Self-Made)
(d) = derived by me: Q1 equals the six-month figure minus Q2, from the Q2 release. Q2 excluded items are the $2.40B legal charges and $1.18B severance that Meta disclosed; Q3's is the $9.89B legal charge. I did not review Meta's Q1 release, so Q1 has no adjusted margin.
From Q1 to Q3, revenue rose 14.7%, operating cash flow rose 1.7%, and capex rose 76%. Meta defines free cash flow as operating cash flow minus purchases of property and equipment and finance-lease principal payments.
Sources: Meta Q2 2026 press release (SEC 8-K), Meta Q3 2026 press release (SEC 8-K).
Forensic #2: Ad Growth Is Now Led By Price Per Ad, Not Impressions
Advertising was 97.6% of Q3 revenue and grew 26%; the mix of that growth shifted from volume to price in one quarter.
| Family of Apps metric | Q2 2026 | Q3 2026 |
|---|---|---|
| Ad impressions, YoY | +14% | +10% |
| Average price per ad, YoY | +12% | +14% |
| Advertising revenue | $59,363M | $63,061M |
| Advertising revenue growth, YoY | +27% | +26% |
| Other revenue (Family of Apps) | $1,007M, +73% | $1,097M, +59% |
| Daily active people (DAP) | 3.60B, +3% | 3.64B, +3% |
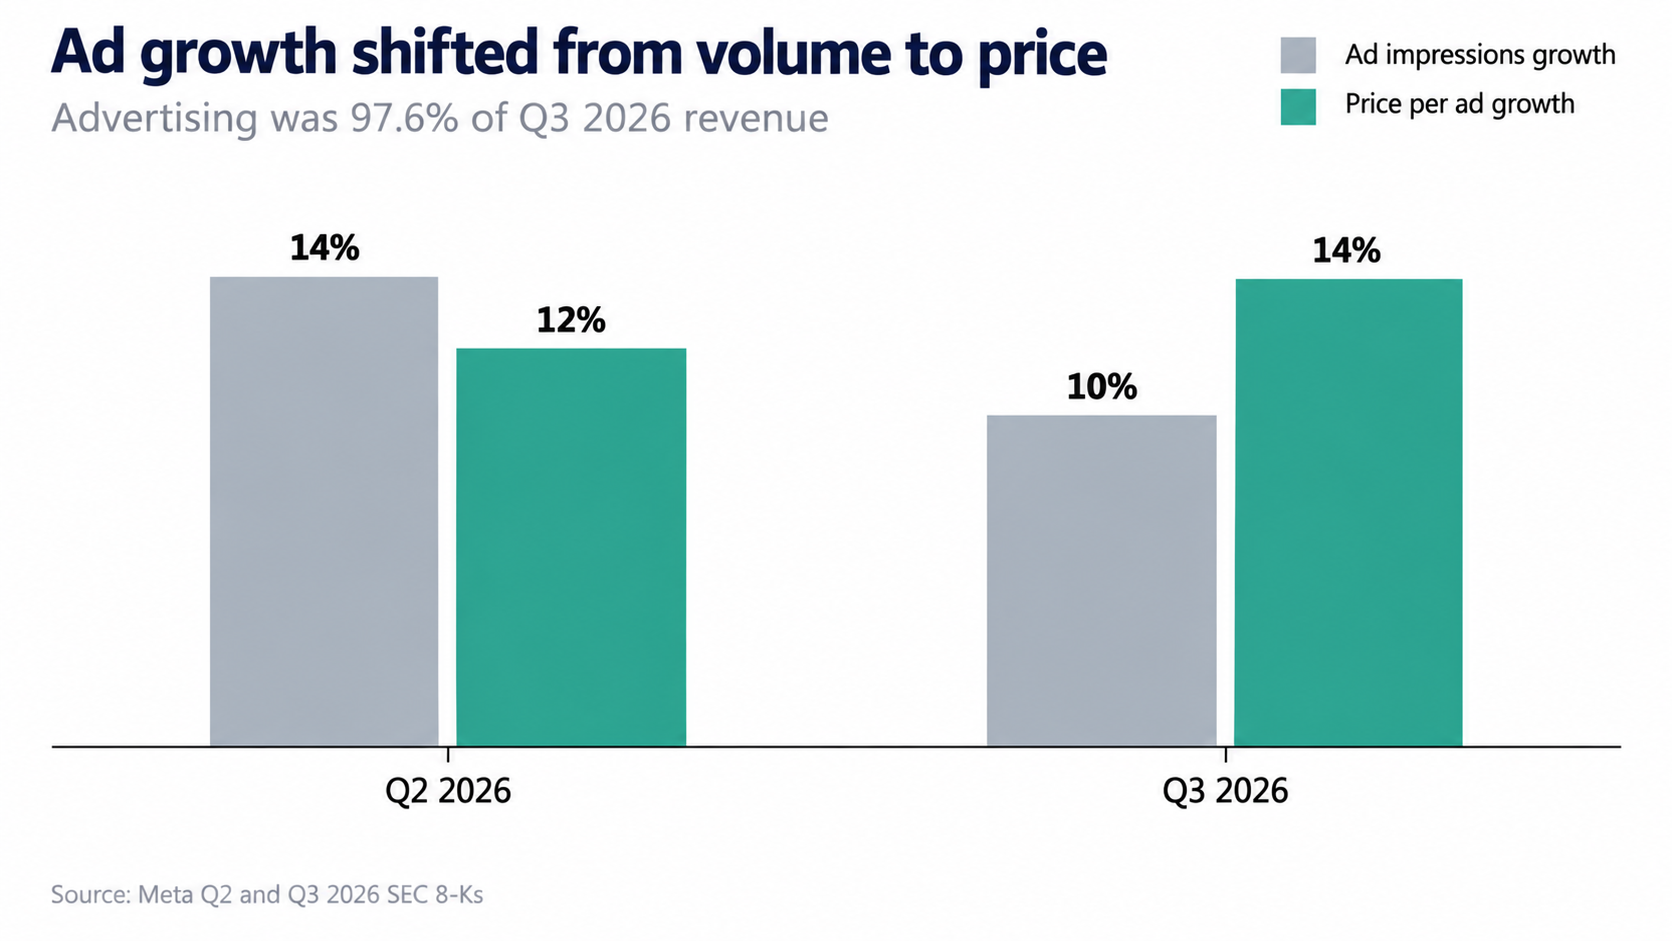
Ad Impressions vs Price per Ad Growth, Q2 and Q3 2026 (Self-Made)
With DAP up 3% and ad revenue up 26%, advertising revenue per daily active person rose about 22% (derived: 1.26 / 1.03). Constant-currency revenue growth was also 26% in Q3, so currency did not drive the figure.
Family of Apps operating income was $17,117M in Q3, down 31% from $24,967M, after the legal charge. Reality Labs lost $4,129M on $443M of revenue.
Muse. CEO Mark Zuckerberg said on the call that more than 10 million people in the US and Canada have set up Muse accounts since the August launch, and about 25% use it on a given day. He said Muse needs significant computing power, and that Meta expects to improve its cost efficiency more than ten-fold over the next year. Meta reports no Muse revenue line; this is usage data, not earnings. Source: AP report on the call.
Sources: Meta Q2 2026 8-K, Meta Q3 2026 8-K.
Forensic #3: Every Major Cost Line Grew Faster Than Revenue Except Marketing
Excluding the charge, Q3 costs rose 36% against revenue growth of 26%, led by cost of revenue (+45%) and general and administrative expense (+41%).
| Cost line ($M) | Q3 2026 | Q3 2025 | YoY | % of Q3 2026 revenue |
|---|---|---|---|---|
| Cost of revenue | 13,369 | 9,206 | +45% | 20.7% |
| Research and development | 20,054 | 15,144 | +32% | 31.0% |
| Marketing and sales | 3,333 | 2,845 | +17% | 5.2% |
| General and administrative, excl. legal charge | 4,967 | 3,512 | +41% | 7.7% |
| Total excl. legal charge | 41,723 | 30,707 | +36% | 64.6% |
| Legal charge (in G&A) | 9,890 | n/a | n/a | 15.3% |
| Total reported | 51,613 | 30,707 | +68% | 79.9% |
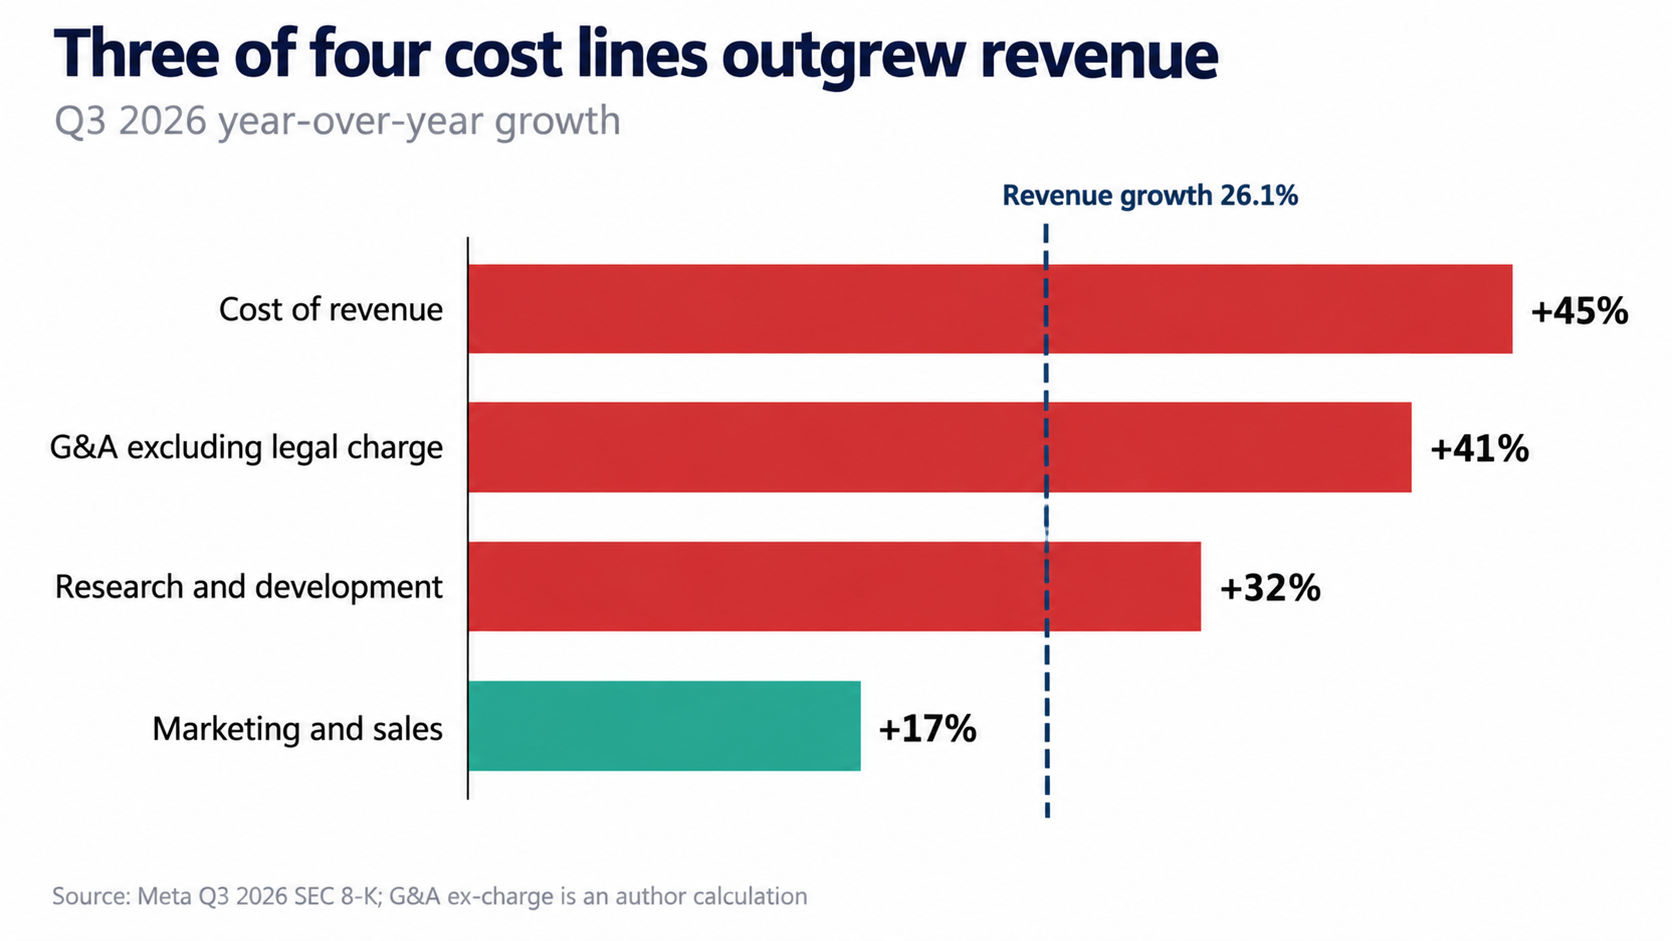
Q3 2026 Cost Line Growth vs Revenue Growth (Self-Made)
Non-cash and people costs moved the same way:
- Depreciation and amortization: $7,154M, up 44% (11.1% of revenue vs 9.7% a year ago).
- Share-based compensation: $7,363M, up 33% in Q3 and 45% over nine months ($21,053M vs $14,537M).
- Headcount: 66,775, down 15%. The May 2026 reduction affected about 8,000 employees, and Q2 included $1.18B of severance.
- Research and development over nine months: $59,409M vs $40,237M, up 48%.
Meta's release does not split R&D between AI infrastructure and compensation, so the driver of the R&D line cannot be read from the filing alone.
Sources: Meta Q3 2026 8-K, Meta Q2 2026 8-K. Ex-charge lines and percentages are my arithmetic.
Forensic #4: Net Cash Fell From $22.8B To $1.5B In Nine Months
Meta borrowed $24.9B in 2026, bought back no stock, and still ended September with about the same cash and securities as it started the year.
| Balance sheet ($M) | Dec 31, 2025 | Jun 30, 2026 | Sep 30, 2026 |
|---|---|---|---|
| Cash, equivalents and marketable securities | 81,592 | 90,260 | 82,449 |
| Long-term debt | 58,744 | 83,664 | 80,922 |
| Cash and securities minus long-term debt (d) | +22,848 | +6,596 | +1,527 |
| Property and equipment, net | 176,400 | 225,724 | 253,222 |
| Total assets | 366,021 | 449,956 | 478,836 |
| Stockholders' equity | 217,243 | 261,221 | 272,386 |
| Restricted cash (d) | about 3,227 | 13,809 | 13,132 |
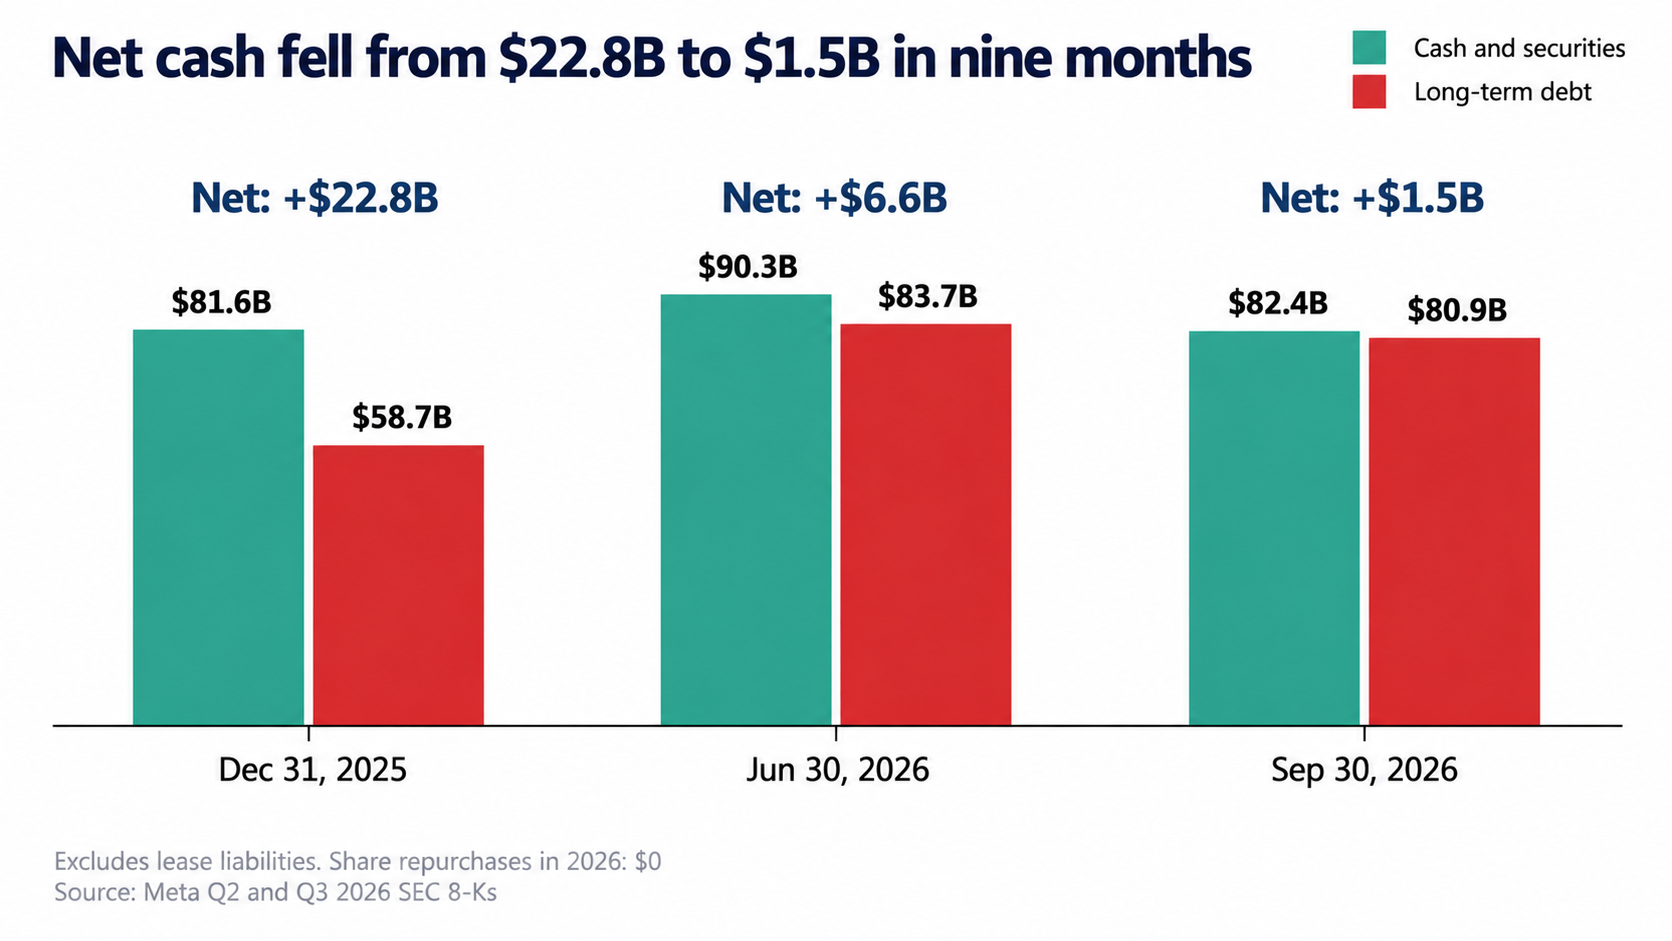
Net Cash: Cash and Securities vs Long-Term Debt (Self-Made)
(d) = derived. "Cash and securities minus long-term debt" excludes lease liabilities, including $31.2B of operating lease liabilities at Sept 30. Restricted cash is cash held under restrictions; the release does not say what it secures.
Nine-month cash uses, from the cash flow statement:
- Operating cash flow: $96.9B (vs $79.6B a year earlier, +22%).
- Capex: $83.1B of property and equipment plus $2.8B of finance-lease principal; free cash flow $11.0B vs $29.5B (-63%).
- Dividends: $4.1B. Taxes paid on employee share settlements: $12.8B.
- Long-term debt issued, net: $24.9B (in Q2). Share repurchases: $0, vs $26.2B in the first nine months of 2025.
- Net property and equipment rose $76.8B in nine months, +44%.
- Interest and other income, net: -$1.1B for nine months vs +$2.0B a year earlier.
Q3 capex ($34.9B) was 106% of Q3 operating cash flow ($32.8B). Over nine months it was 89%. Diluted share count was flat at 2,573M vs 2,572M a year earlier.
Commitments (third-party figure, verify). InvestingLive reports a regulatory filing showing about $825B of future spending commitments, including $356B of leases not yet commenced and $455B of non-cancelable contracts, with $121B due in 2027. I did not locate this table in the documents I opened, so confirm it in the 10-Q before relying on it. Source: InvestingLive, Oct 22.
Sources: Meta Q3 2026 8-K, Meta Q2 2026 8-K.
Q4 Guidance: $49B To $59B Of Capex And A 29% To 37% Operating Margin
Subtracting nine-month actuals from Meta's full-year guidance shows what the fourth quarter has to contain.
| $B | 9M 2026 actual | FY2026 guidance | Implied Q4 (d) | Q3 actual, for scale |
|---|---|---|---|---|
| Revenue | 181.7 | not given; Q4 guide $73 to $76 | 73.0 to 76.0 | 64.6 |
| Total costs and expenses | 127.1 | 175 to 179 | 47.9 to 51.9 | 51.6 (41.7 excl. charge) |
| Income from operations | 54.6 | not given | 21.1 to 28.1 | 13.0 (22.9 excl. charge) |
| Operating margin | 30.1% | not given | 29% to 37% | 20% (35.4% excl. charge) |
| Capex incl. finance-lease principal | 85.8 | 135 to 145 | 49.2 to 59.2 | 34.9 |
| Reality Labs operating loss | 12.8 | 18 to 19 | 5.2 to 6.2 | 4.1 |
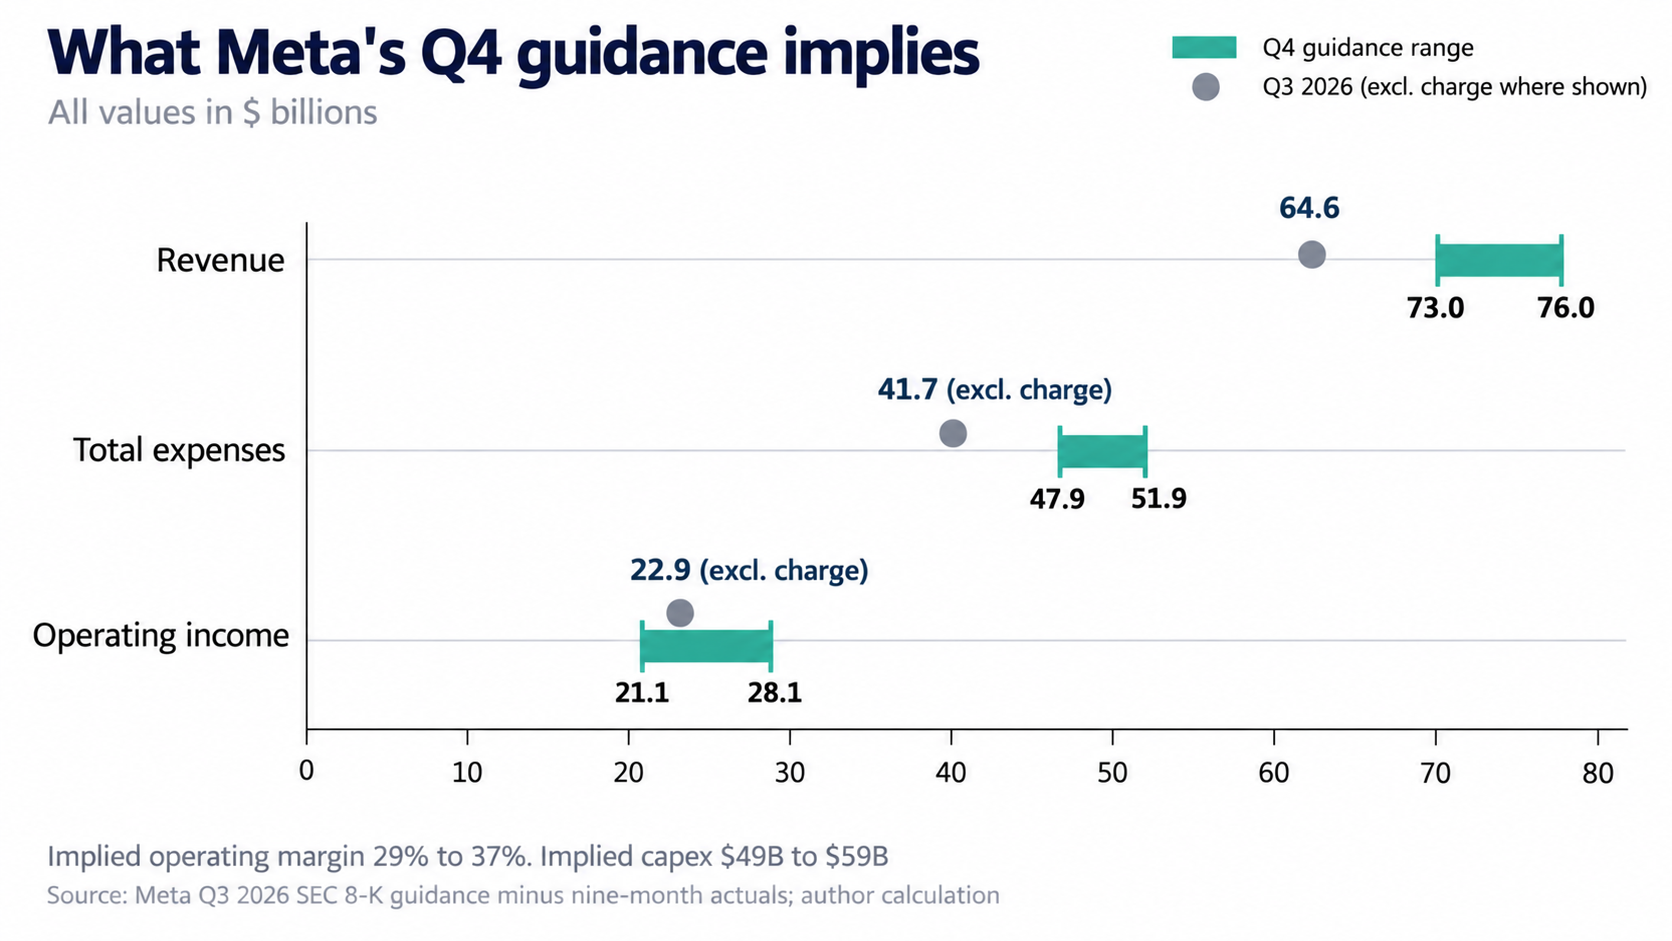
Implied Q4 2026 Guidance Ranges vs Q3 (Self-Made)
Meta also guides a Q4 tax rate of 15% to 17% and expects a 1% currency headwind to Q4 revenue growth.
What that means in plain numbers:
- Q4 capex would be 41% to 70% above Q3's record $34.9B.
- InvestingLive puts the Q4 revenue midpoint ($74.5B) at roughly 24% growth, against 33%, 28% and 26% in Q1 to Q3, and above the $73.7B consensus.
- If Q4 operating cash flow equals Q3's $32.8B, free cash flow would be about -$16B to -$26B. Q4 is Meta's largest revenue quarter, so operating cash flow may be higher; the guide does not say.
- Meta says that excluding the Q3 legal charge, it still expects 2026 operating income above 2025's, and strong overall revenue growth through 2027. It has not given 2027 revenue, capex or expense guidance and said it is still building its budget and capacity plans.
- Reality Labs losses are guided to about $15B in 2027, from $18B to $19B in 2026.
(d) = my arithmetic: full-year guidance minus nine-month actuals. Sources: Meta Q3 2026 8-K; consensus and growth midpoint from InvestingLive; the same Q4 capex and cash-gap arithmetic also appears in TIKR.
Class C Stock: A New Funding Route That Keeps Zuckerberg's 60.6% Vote
Meta will create non-voting Class C shares on January 19, 2027 and has announced no size, price or date for any sale of them.
| Item | What the filings and reports say |
|---|---|
| Effective date | January 19, 2027 (charter amendment) |
| Distribution | One Class C share per Class A and Class B share, as a one-time stock dividend; record and payment dates not yet set |
| Economic effect | Meta expects Class A to trade as if split two-for-one |
| Stated uses | Raising capital, employee pay, acquisitions, other corporate purposes |
| Zuckerberg, Oct 1, 2026 | About 341.2M Class B and 1.2M Class A shares: 60.6% of votes, 13.4% of economic ownership |
| His Class C allotment | About 342.4M shares |
| Freely saleable at once | 20% of the Class C received by his "Holder Group"; the rest is restricted |
| Approval | Special committee of independent directors recommended it; shareholder written consent approved it |
Sources: Meta 8-K, Reuters explainer.
What else the reporting adds:
- Scale of dilution. At about $1.6T of market value (my calculation: about $624 times 2.57B diluted shares), each 1% of the company sold as Class C raises roughly $16B. Covering a Q4 cash gap of $16B to $26B (previous section) would take about 1.0% to 1.7%. Any sale would dilute ownership for every holder, including Zuckerberg's 13.4%, but not voting power.
- Why not debt. Meta's filing says borrowing at this scale can hurt credit ratings, which makes equity more attractive (Reuters). Long-term debt is already $80.9B, up $22.2B this year.
- Management's stance. CFO Susan Li said Meta has no specific financing plans to announce (TIKR, citing the call).
- Founder terms (TIKR's reading of the 8-K). The other 80% of the Class C allotment is stapled to voting shares and frees up at 2.5% a quarter over 32 qualifying quarters. Meta must pay another one-for-one Class C dividend each time the Class C 30-day average price doubles from a split-adjusted $290.30, if returns compound at 10% a year. The board must use best efforts to repurchase at least as many Class C shares as Class A shares.
- Sunset provisions. The special committee proposed them; Zuckerberg indicated he would not support them (Reuters).
- Tax angle. Reuters, citing the filing, says Zuckerberg told the committee he was weighing relocation over California's proposed one-time 5% billionaire wealth tax, on the November 2026 ballot; Class C would let him sell some non-voting stock without reducing his vote.
- Precedent. Google created non-voting Class C stock in 2014 after a shareholder lawsuit; it agreed to compensate Class C holders if they traded more than 1% below Class A in the first year and determined in 2015 that it owed $522M (Reuters). Facebook proposed a similar split in 2016 and dropped it in September 2017 amid a lawsuit (TIKR).
Source for the founder terms and Li's comment: TIKR, Oct 22. I could not confirm these terms in the filing text itself.
Risks: Legal Exposure And What Would Break The Thesis
Meta has recorded $12.29B of legal charges in Q2 and Q3 ($2.40B plus $9.89B); a separate $25B order was issued the same day as the Q3 report.
| Matter | Amount | Status per sources |
|---|---|---|
| Q2 2026 legal proceedings charges | $2.40B | Recorded in Q2 general and administrative expense |
| Agreement with 52 state attorneys general (teen mental health) | Payments up to about $18.59B; $9.89B charged in Q3 | Announced August 2026 |
| New Mexico case (privacy) | $25B | Judge's order on Oct 21 after a jury found Meta liable for deceiving users; the largest fine against Meta (AP) |
| Youth-related trials | Not quantified | Meta says a number are scheduled in coming months in the US |
Three points that matter for modelling:
- Meta's Q3 release does not mention the New Mexico order. Its expense guide of $175B to $179B is described as incorporating the $9.9B charge only.
- Meta's release does not say when the remainder of the up-to-$18.59B agreement is payable. The $9.89B was charged to expense in Q3; the cash flow statement shows other liabilities up $7.4B in the quarter, consistent with an accrual rather than a payment (my reading).
- I did not find Meta's response to the New Mexico ruling in the pages I opened.
AP describes the state agreement as $18B with 48 states; Meta's release says 52 attorneys general and up to about $18.59B. I use Meta's figures.
Reality Labs. Q3 revenue was $443M and operating loss $4,129M. The nine-month loss was $12,775M, versus $13,171M a year earlier (-3%). Meta guides a 2026 loss of $18B to $19B, which implies $5.2B to $6.2B in Q4, and about $15B in 2027.
Sources: Meta Q3 2026 8-K, Meta Q2 2026 8-K, AP, Oct 21.
Valuation Snapshot
The stock fell 6.98% on Oct 22 and was about 10.6% below its pre-earnings close by Oct 27, which puts it near 21x annualised Q3 earnings excluding the legal charge.
| Measure | Value | Basis |
|---|---|---|
| Close, Oct 21 (before the call reaction) | $697.52 | Gotrade, Yahoo Finance data |
| Close, Oct 22 | $648.85, -6.98%, volume 40.6M vs 21.2M 30-day average | Gotrade |
| Quote, Oct 27 | about $623.59, -1.11% on the day | Investing.com market data |
| Change since Oct 21 close | -10.6% | derived |
| 52-week range | $520.26 to $779.82; now 20.0% below the high, 19.9% above the low | Gotrade range; derived |
| Market value | about $1.6T | $623.59 times 2,573M diluted shares (derived) |
| Q3 EPS excl. charge, annualised | $7.40 x 4 = $29.60; 21.1x | Meta's EPS; run-rate, not a forecast |
| 2026 revenue implied by guidance | $254.7B to $257.7B; 6.2x to 6.3x sales | 9M actual plus Q4 guide (derived) |
| Nine-month free cash flow / market value | 0.7% (not annualised) | derived |
| Dividends, Q3 annualised / market value | 0.34% | $1.36B x 4 (derived) |
Two cautions on reading the multiples. The annualised EPS uses Q3's 17% tax rate, close to the 15% to 17% Meta guides for Q4, but nine-month EPS is distorted by a first-half tax benefit (see above). And a Q3 run-rate ignores that Q4 operating expense and Reality Labs losses are guided higher.
On the day, the Nasdaq Composite fell 2.60% and the S&P 500 1.21%, so Meta underperformed the Nasdaq by about 4.4 points. Reuters and other outlets tied the move to the capex outlook and the Class C plan. The stock had risen 2.2% to 2.9% after hours on Oct 21 before reversing.
Third-party views, for context only: Barclays kept Overweight and raised its target to $880 from $780; Oppenheimer projects about $135B of AI-related free cash flow losses through 2028, against roughly $90B of cash and securities (both per InvestingLive, not independently verified).
This article gives no price target. Any target depends on 2027 capex, ad growth and financing choices that Meta has not yet provided.
Sources: Gotrade, Oct 23, Investing.com quote, InvestingLive, TIKR, AP.
What To Watch Next
Meta's Q4 report, expected around late January 2027 (Meta has not confirmed the date in the documents I read), will test most of these at once.
| Check | Where the data stands | The test |
|---|---|---|
| Free cash flow | Q1 +$12.4B, Q2 +$0.8B, Q3 -$2.1B | Break-even in Q4 needs operating cash flow of $49B to $59B (derived from implied capex), 50% to 80% above Q3's $32.8B |
| 2027 capex guide | Not given; 2026 is $135B to $145B | Q4's implied $49B to $59B annualises to about $197B to $237B; a 2027 guide above or below that range shows how much of the Q4 pace Meta plans to hold |
| Ad mix | Impressions +10%, price per ad +14% (Q2: +14%, +12%) | Whether impression growth stabilises near 10% or keeps falling as price growth carries revenue |
| Operating margin | 35.4% excl. Q3 charge; Q4 guide implies 29% to 37% | A print below the implied 29% would mean costs ran above the guide |
| Net cash and debt | Cash and securities minus long-term debt: +$22.8B at Dec 31, +$1.5B at Sept 30 | Whether it turns negative, via new borrowing, or Meta issues Class C stock instead |
| Class C issuance | Effective Jan 19, 2027; no size or date announced | Any announced sale; each 1% of the company is about $16B at current prices |
| Legal | $12.3B charged in Q2 and Q3; $25B New Mexico order; trials pending | Whether the New Mexico order is accrued or appealed, and when the up-to-$18.59B state payments fall due |
Also worth tracking: Muse usage against the 10M-account and 25%-daily-use figures Zuckerberg gave, his stated aim of improving Muse's cost efficiency more than ten-fold in a year, and any revenue line for it; and Meta's Form 10-Q for the quarter, which should carry the legal accruals and commitments tables that the press release omits.
Sources And Data Notes
All financial statement figures come from Meta's two SEC-filed press releases, which I opened in full. Meta reports on a calendar year, so Q3 2026 is the three months ended September 30, 2026. Prices are as of Oct 27, 2026 and will have moved.
Primary sources
- Meta Reports Third Quarter 2026 Results, SEC 8-K Exhibit 99.1, Oct 21, 2026
- Meta Reports Second Quarter 2026 Results, SEC 8-K Exhibit 99.1, July 29, 2026
Secondary sources
- AP, Meta Q3 report, Oct 21: Muse usage, New Mexico order, after-hours move
- Reuters explainer, Oct 22 to 23: Class C terms, Zuckerberg holdings, Google precedent
- InvestingLive, Oct 22: commitments, Q4 consensus, Barclays and Oppenheimer views
- Gotrade, Oct 23: Oct 21 and 22 closes, volume, 52-week range
- TIKR, Oct 22: founder agreement terms, Li comment
- Investing.com page quoting META: the $623.59 Oct 27 quote, a single data point
Marked, not independently confirmed
- The $7.25 Q3 2025 EPS excluding a one-time tax charge comes from a Motley Fool article via Webull, which I saw only as a search excerpt.
- The $825B commitments figure and the founder-agreement terms are second-hand; check them against Meta's 10-Q and the Class C information statement.
Where sources disagree
- State settlement: AP says 48 states and $18B; Meta's release says 52 attorneys general and up to about $18.59B. This article uses Meta's.
- After-hours move on Oct 21: +2.2% (TIKR) vs +2.9% (AP). The regular-session reaction on Oct 22 (-6.98%) is not disputed.
Left out. An Oct 27 headline reported that Nvidia would commit $3B to a Meta share offering. I could not open the article or find a second source, so it is excluded.
Derived figures are my arithmetic from the filings and are marked (d), "derived" or "my calculation".

Sandeep Gupta
Independent equity research analyst publishing forensic theses on US-listed stocks. MBA, Politecnico di Milano School of Management (Milan, Italy).
Get new research in your inbox
Subscribe to receive forensic equity research the moment it's published. Free, no spam.
Discussion
Be the first to comment.