
Investment Thesis
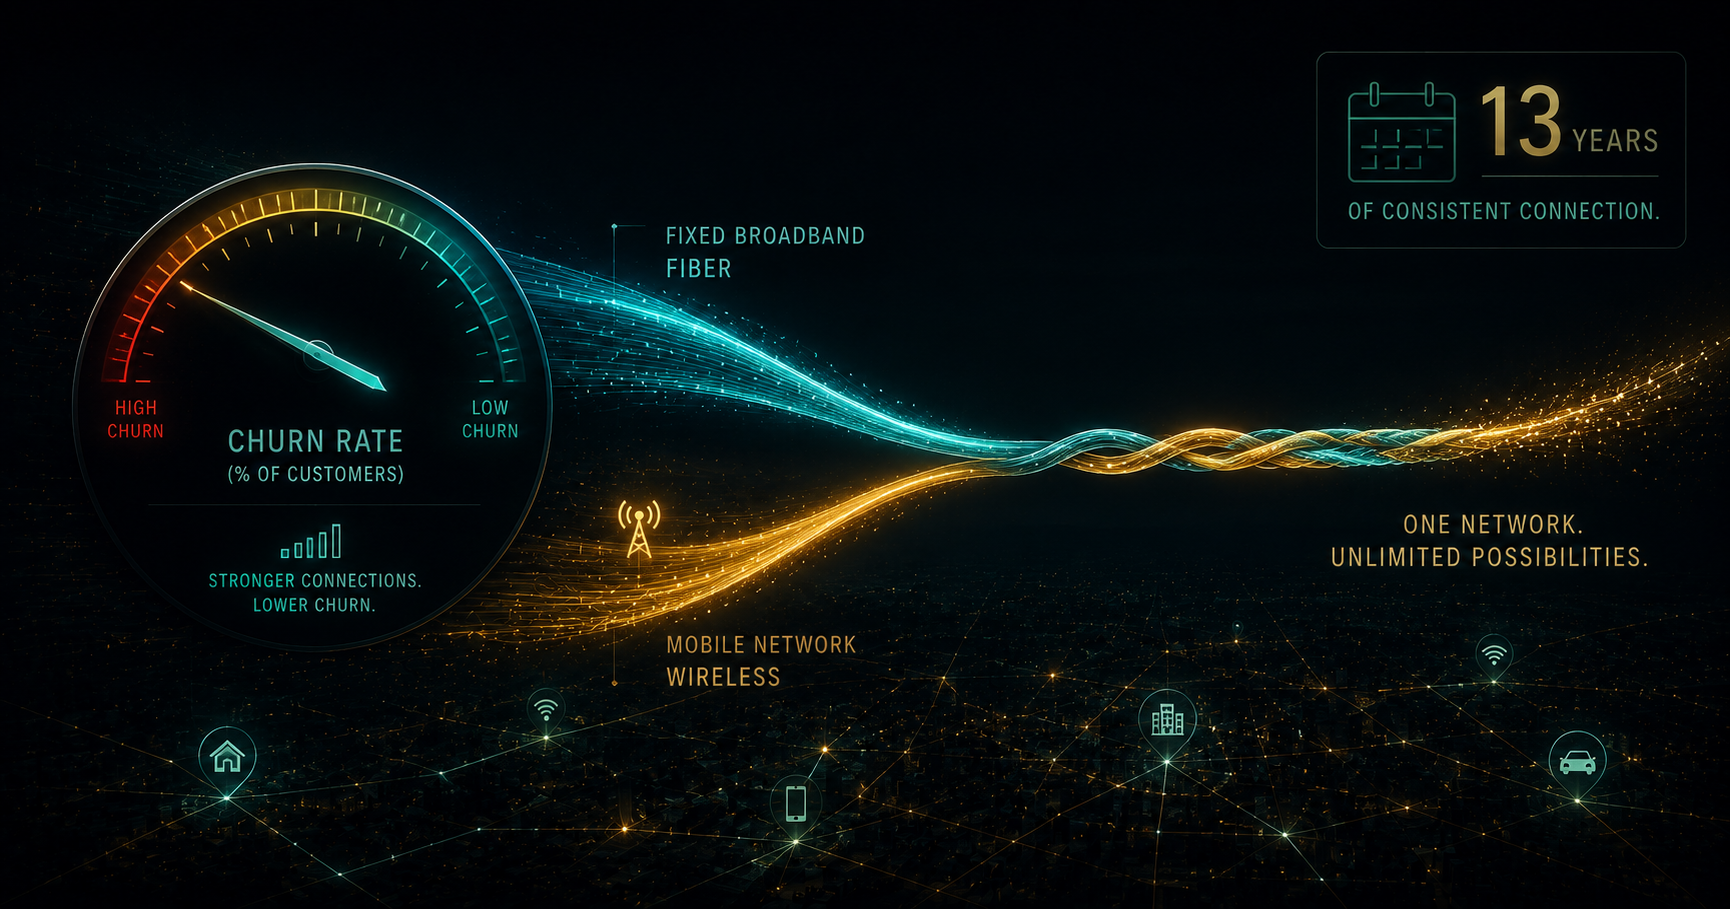
Verizon Communications (NYSE:VZ) was trading at approximately $46 on Friday. The forward yield is approximately 6.1% ($2.71 annualized); the stock sits roughly 8% below its 52-week high and trades at a forward P/E of approximately 9.2x on the raised FY2026 adjusted EPS guidance of $4.95–$4.99. That forward P/E is a discount to the 10-year median of approximately 12x, to large-cap telecom peer AT&T at approximately 10.9x, and to the S&P 500 at approximately 19.5x. The valuation gap is being justified by bears on three grounds: the $172.5B total debt burden (including Frontier-related obligations), the long-contested view that Verizon has been losing wireless market share to T-Mobile since 2020, and the skepticism that the Frontier fiber acquisition ($20B, closed January 20, 2026) will generate adequate returns on invested capital. The Q1 2026 earnings put directly challenged all three of those assumptions. Revenue of $34.4B grew 2.9% year-over-year. Adjusted EPS of $1.28 grew 7.6% year-over-year — the strongest quarterly EPS growth since 2021. Free cash flow was approximately $3.8B. And the company posted 55,000 postpaid phone net additions — the first positive Q1 postpaid phone net add figure since 2013, a 13-year milestone that the bear narrative had not modeled.
Three things the consensus has wrong. One, the wireless market-share thesis is being contradicted by the Q1 data — 55,000 positive postpaid phone net adds, 344,000 better year-over-year, with consumer postpaid phone churn improving to 0.90% and ending March below 0.85%, the best monthly churn figure in several years. Management explicitly stated Q1 will be the low point for mobility and broadband service revenue, with acceleration toward 2–3% for the full year. Two, the Frontier acquisition is delivering convergence economics faster than bears modeled — Verizon disclosed that converged fiber+wireless customers show 30% lower churn than standalone wireless customers, a structural retention advantage that compounds as fiber passings scale from 32M (end-2026 target) toward 40–50M (medium-term). Three, the 21st consecutive annual dividend increase (announced in Q1) confirms management's capital discipline, and the $3B+ share buyback authorization supplements the 6.1% dividend yield in a total-return framework that the single-multiple P/E approach understates.
This article builds three analytical frameworks: a churn-recovery economics model showing the 0.90% postpaid churn as the structural inflection point, a Frontier fiber convergence model that quantifies the 30% churn advantage into revenue per user terms, and a total-return compounder analysis combining the 6.1% dividend yield, the buyback, and the FCF growth trajectory. 12-month price target: $55. Multi-year intrinsic value: $65+. Rating: BUY.
What The Market Believes vs. What The Data Actually Shows
The bear case has four claims. First, T-Mobile has structurally superior network leadership (more mid-band 5G spectrum) and will continue winning postpaid share from Verizon indefinitely. Second, the Frontier acquisition adds $20B of debt to an already-leveraged balance sheet and will require years of integration cost before generating returns. Third, fixed wireless access (FWA) — Verizon's non-fiber broadband product — faces a natural ceiling as the technology delivers inferior speeds at scale, limiting the addressable household base. Fourth, the network outage in January 2026 (an 80 basis point headwind to wireless service revenue in Q1) exposed network reliability risks.
The January network outage is the most important single data point to interrogate. Management described it as a "one-time event" with no lingering financial impact, and the Q1 recovery trajectory — churn falling below 0.85% by March — is inconsistent with the pattern of sustained customer defection following a network reliability event. The 55,000 positive postpaid adds, against the 80bps revenue headwind from customer credits, suggests the underlying wireless competitive position is stronger than bears had previously modeled.
Forensic #1: Postpaid Churn At 0.85% Is The Competitive Inflection — 13 Years In The Making
The most important single data point in Verizon's Q1 2026 results was not the revenue beat or the EPS growth or even the guidance raise. It was the 0.90% consumer postpaid phone churn rate — improving to below 0.85% by March. Understanding why this matters requires understanding the economics of wireless churn.
The churn mathematics. Each wireless customer that churns costs Verizon approximately $300–400 in customer acquisition cost to replace (handset subsidy, sales commissions, activation costs). At 0.90% monthly churn on approximately 70M postpaid lines, monthly gross churners total approximately 630,000 subscribers — each one requiring approximately $350 of replacement cost, totaling approximately $220M monthly or $2.6B annually in churn-related acquisition spend. A 5 basis point improvement in monthly churn (from 0.90% to 0.85%) reduces the gross churn population by approximately 35,000 subscribers per month, saving approximately $12M monthly or $145M annually in acquisition cost. The churn improvement from 0.90% to below 0.85% (as Verizon disclosed for March) represents approximately $145M+ of annual economic benefit — and the compounding effect as retention efficiency flows through to reduced marketing spend and higher customer lifetime value is approximately 3–4x the direct churn-cost saving.
The strategic shift. Management explicitly described "purposely shifting our mix towards durable recurring service revenues and away from low-margin, highly promotional activity." Acquisition and retention costs fell approximately 35% in March versus the end of Q4 — a dramatic reduction in the cost-of-acquisition that validates the strategic pivot. The company is simultaneously reducing churn (retaining better customers) and reducing the cost of acquiring new ones. This combination — lower churn, lower acquisition cost — is a margin expansion setup that flows through to EBITDA over 2–4 quarters with a 3–6 month lag.
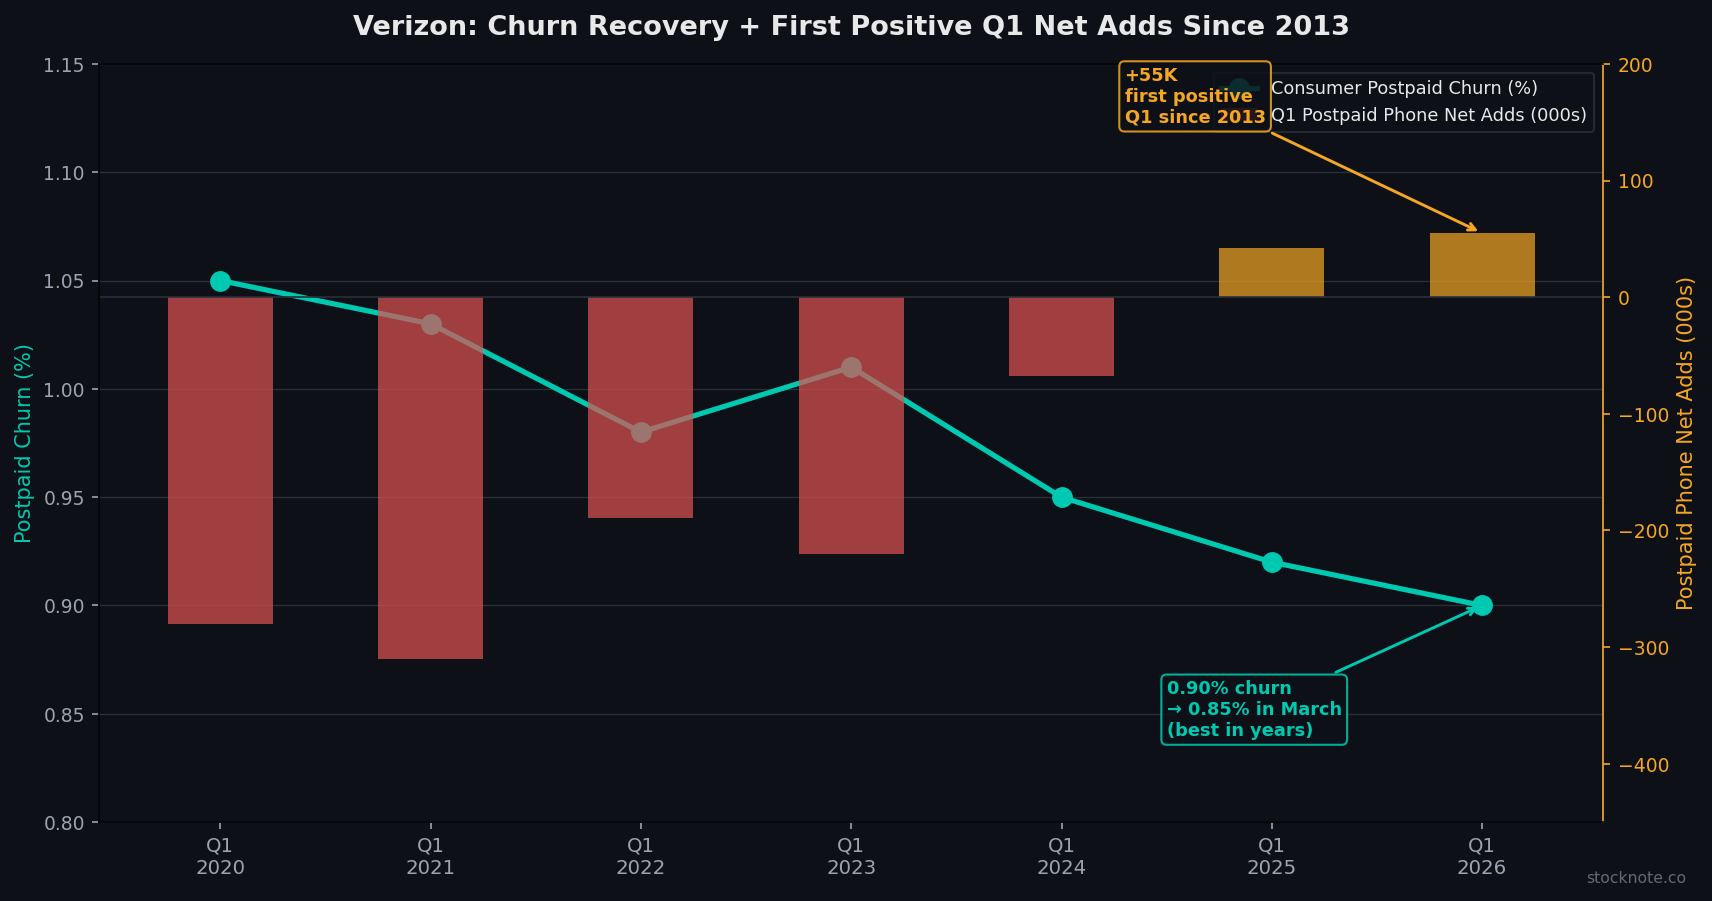
The 13-year milestone context. Generating positive Q1 postpaid phone net additions for the first time since 2013 is a structural statement, not a rounding-error blip. Q1 is the seasonally weakest quarter for wireless net additions (no back-to-school, no holiday upgrade cycle, January and February are the lowest-activity months). If Verizon generates positive net adds in Q1, the Q2–Q4 trend should be materially stronger — supporting the guidance raise to the upper half of the 750,000–1,000,000 full-year postpaid phone net add range. A 900,000–1,000,000 postpaid net add year would be the best Verizon performance since 2017.
Forensic #2: Frontier Fiber Convergence — 30% Lower Churn Compounding As Passings Scale
The Frontier acquisition (closed January 20, 2026) is the largest strategic bet in Verizon's history since the acquisition of Vodafone's US wireless assets in 2014. Bears have been skeptical on valuation and integration risk. The Q1 convergence data argues the strategic rationale is already materializing.
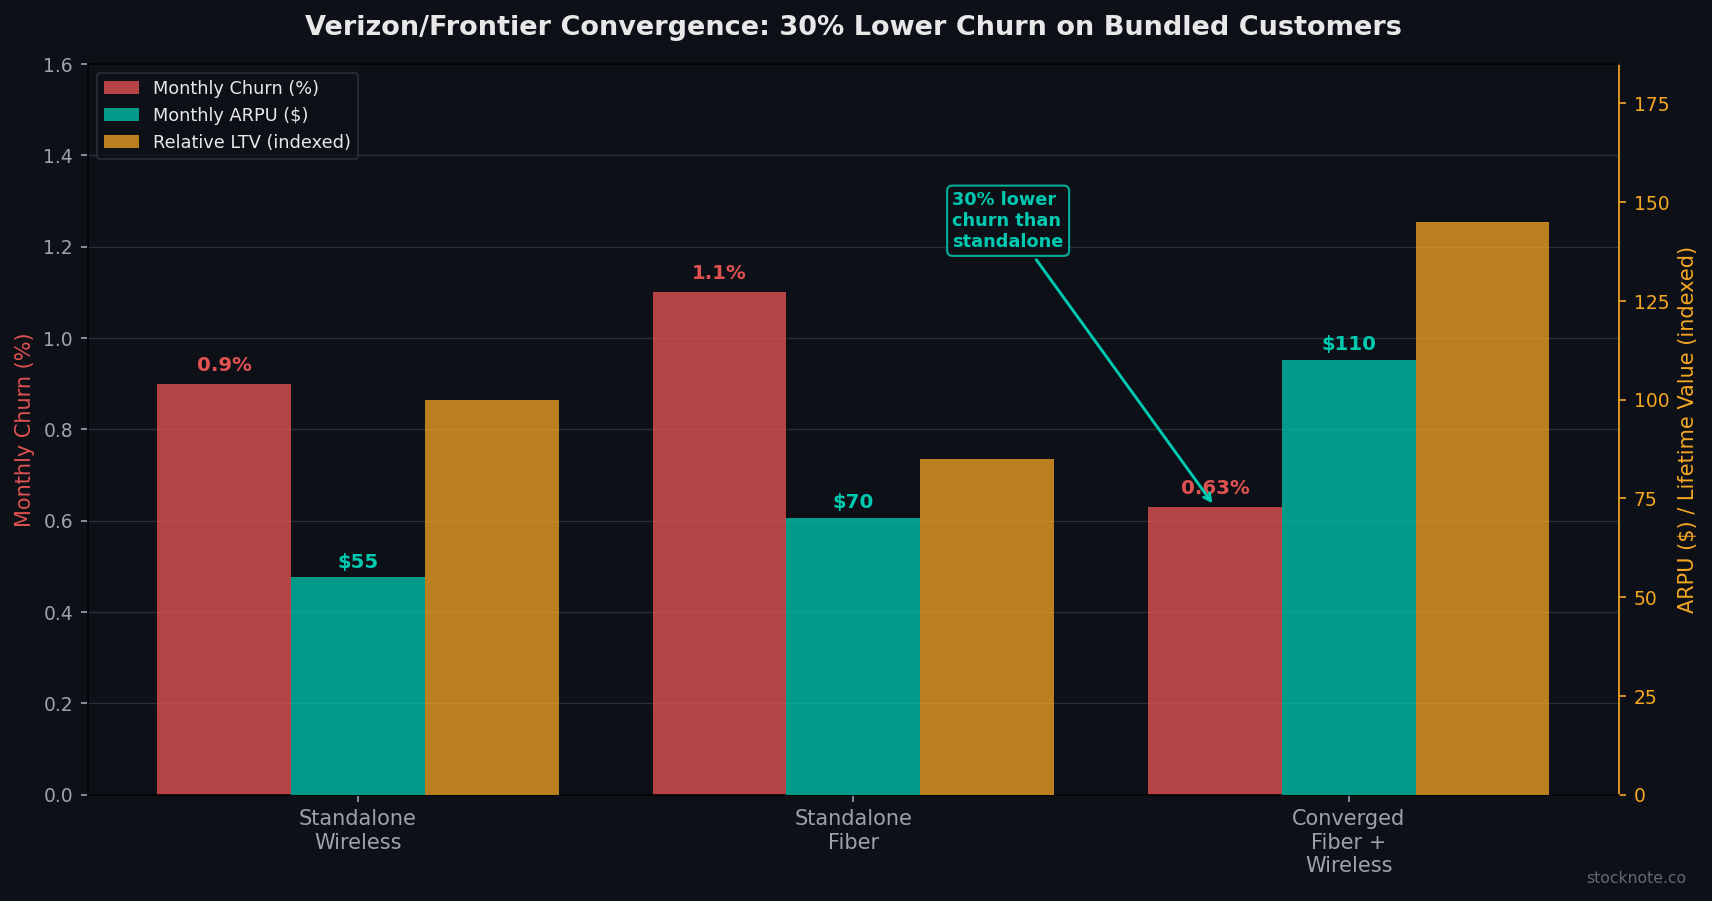
The convergence economics. Verizon disclosed that converged fiber+wireless customers show 30% lower churn than standalone wireless customers. This is the same structural dynamic that AT&T's 45% fiber-to-wireless attach rate is demonstrating — bundled customers are stickier, generate higher lifetime value, and require less retention marketing investment. Applying the 30% churn differential to Verizon's existing customer base quantifies the value creation opportunity: if Verizon converts 5M wireless customers to converged fiber+wireless over 3–5 years (a plausible path given Frontier's 25M+ passings), the churn reduction on those 5M customers (from 0.90% to approximately 0.63% monthly) saves approximately $475M annually in avoided churn cost and generates approximately $500M in incremental annual revenue from higher ARPU.
The fiber scaling math. Verizon targets 32M fiber passings by end-2026 (including the Frontier footprint), expanding toward 40–50M medium-term. Verizon targets at least $1B of Frontier run-rate operating cost synergies by 2028, on top of the structural revenue benefits from convergence. The fiber-passing expansion is the key enabler — each new market where Verizon offers fiber opens a new customer household to the convergence bundle, and with the 30% churn advantage, each converted converged household is approximately 43% more valuable in lifetime terms than a standalone wireless customer.
The 127,000 fiber net adds. Verizon added 127,000 fiber broadband net adds in Q1 2026 — the first full quarter of Frontier integration. Combined with 214,000 fixed wireless access adds, total broadband net adds were 341,000. Consumer fiber broadband penetration on the Frontier footprint is approximately 35–40% in mature markets, implying significant room to grow in newly integrated Frontier geographies where penetration starts below 20%. The path to 8–10M fiber subscribers by 2028 (from approximately 4.5M currently) would double the fiber ARPUs contribution to consolidated revenue.
Forensic #3: The Total-Return Profile Compares Favorably To Investment-Grade Bonds At Double The Duration Risk
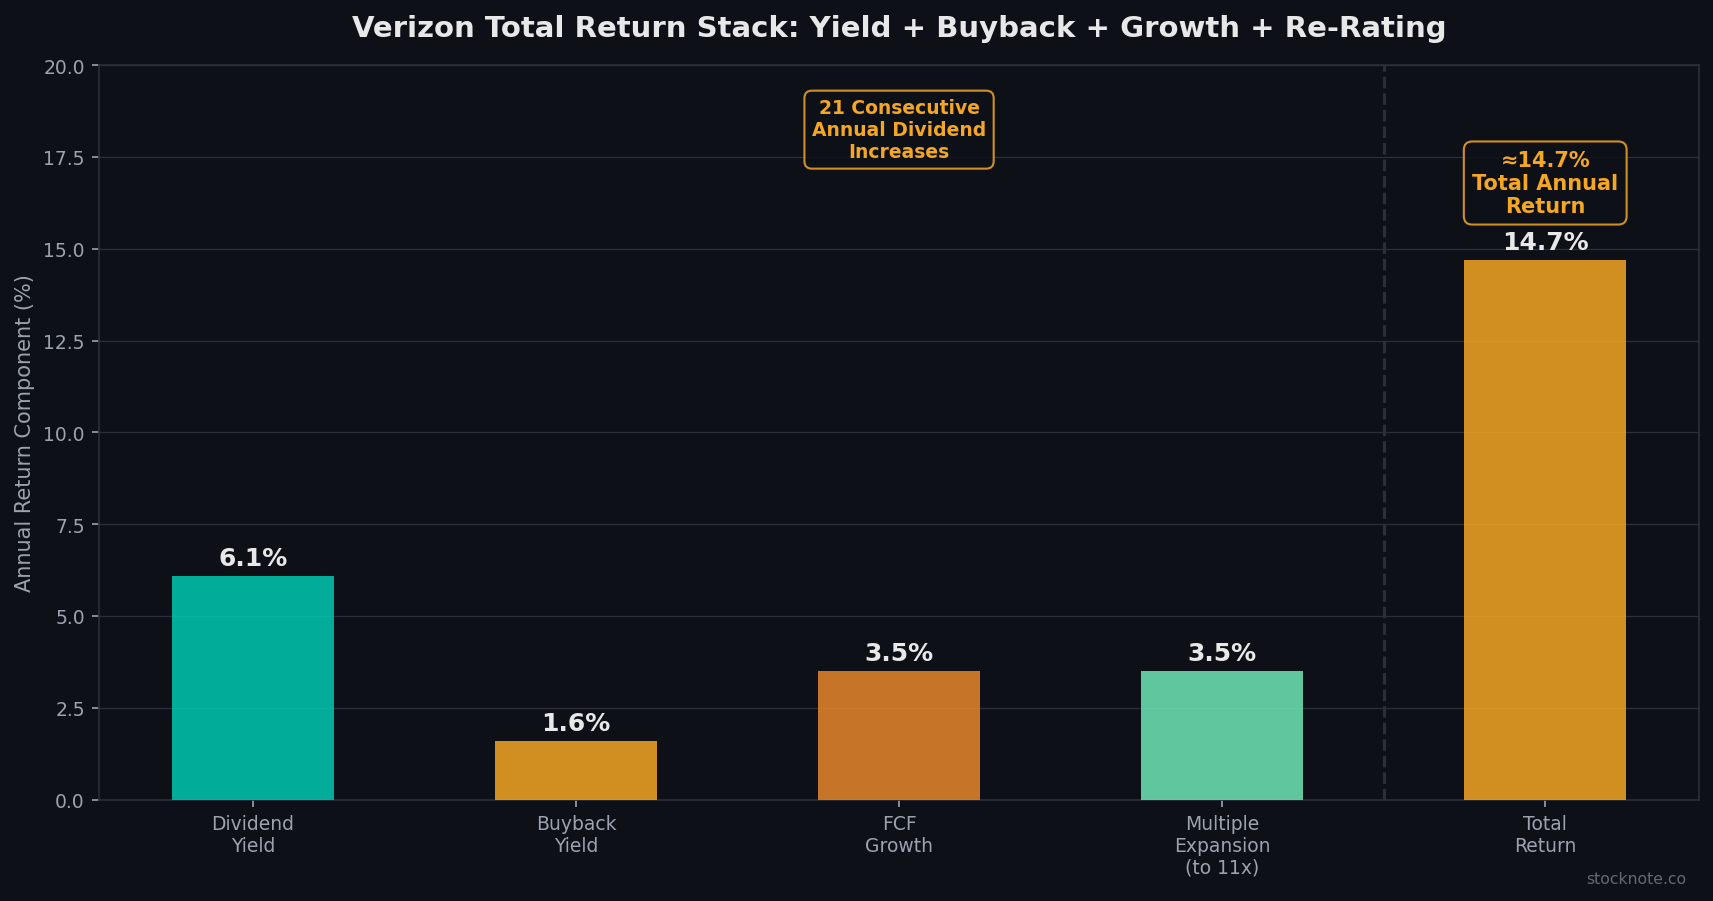
The third forensic argument positions Verizon not as a conventional telecom value stock, but as a total-return compounder with an investment-grade credit profile, 21 consecutive years of dividend growth, and multiple levers of capital return that compound the starting 6.1% yield.
The dividend consistency. Verizon increased its annualized dividend for the twentieth consecutive year in Q1 2026 — a record of dividend growth that spans technology disruptions, recessions, the pandemic, two major acquisitions (Vodafone, Frontier), and the rise of T-Mobile from a minor player to a tier-1 competitor. The $2.71 annualized dividend at a 6.1% yield is covered 1.83x by the FY2026 guided FCF of approximately $21.5B+ (Verizon guides FCF growth of approximately 7%+ for 2026).
The buyback supplement. In Q1 2026, Verizon repurchased $2.5B of shares under its buyback authorization, with a plan for at least $3B for the full year. At $46/share, that buyback represents approximately 65M shares — a 1.6% reduction in the diluted share count, adding approximately $0.08 to EPS from share reduction alone. The total capital returned in Q1 (dividends + buybacks) was $5.4B — a quarterly return yield of approximately 2.8% on the current market cap.
The AI infrastructure optionality. Management described exploring multibillion-dollar revenue opportunities by providing fiber and 5G infrastructure to hyperscalers for AI training and inference — a new revenue vertical that doesn't exist in current consensus models. As cloud companies and AI infrastructure providers seek to move compute outside of centralized data centers (distributed inference at the network edge), telecom operators with combined fiber and 5G coverage become strategic infrastructure partners. Verizon's combination of the largest US 5G network and the Frontier fiber footprint positions it uniquely to serve this market. This is zero in current sell-side models; any material contract announcement would be a significant positive catalyst.
Sum-Of-The-Parts Valuation
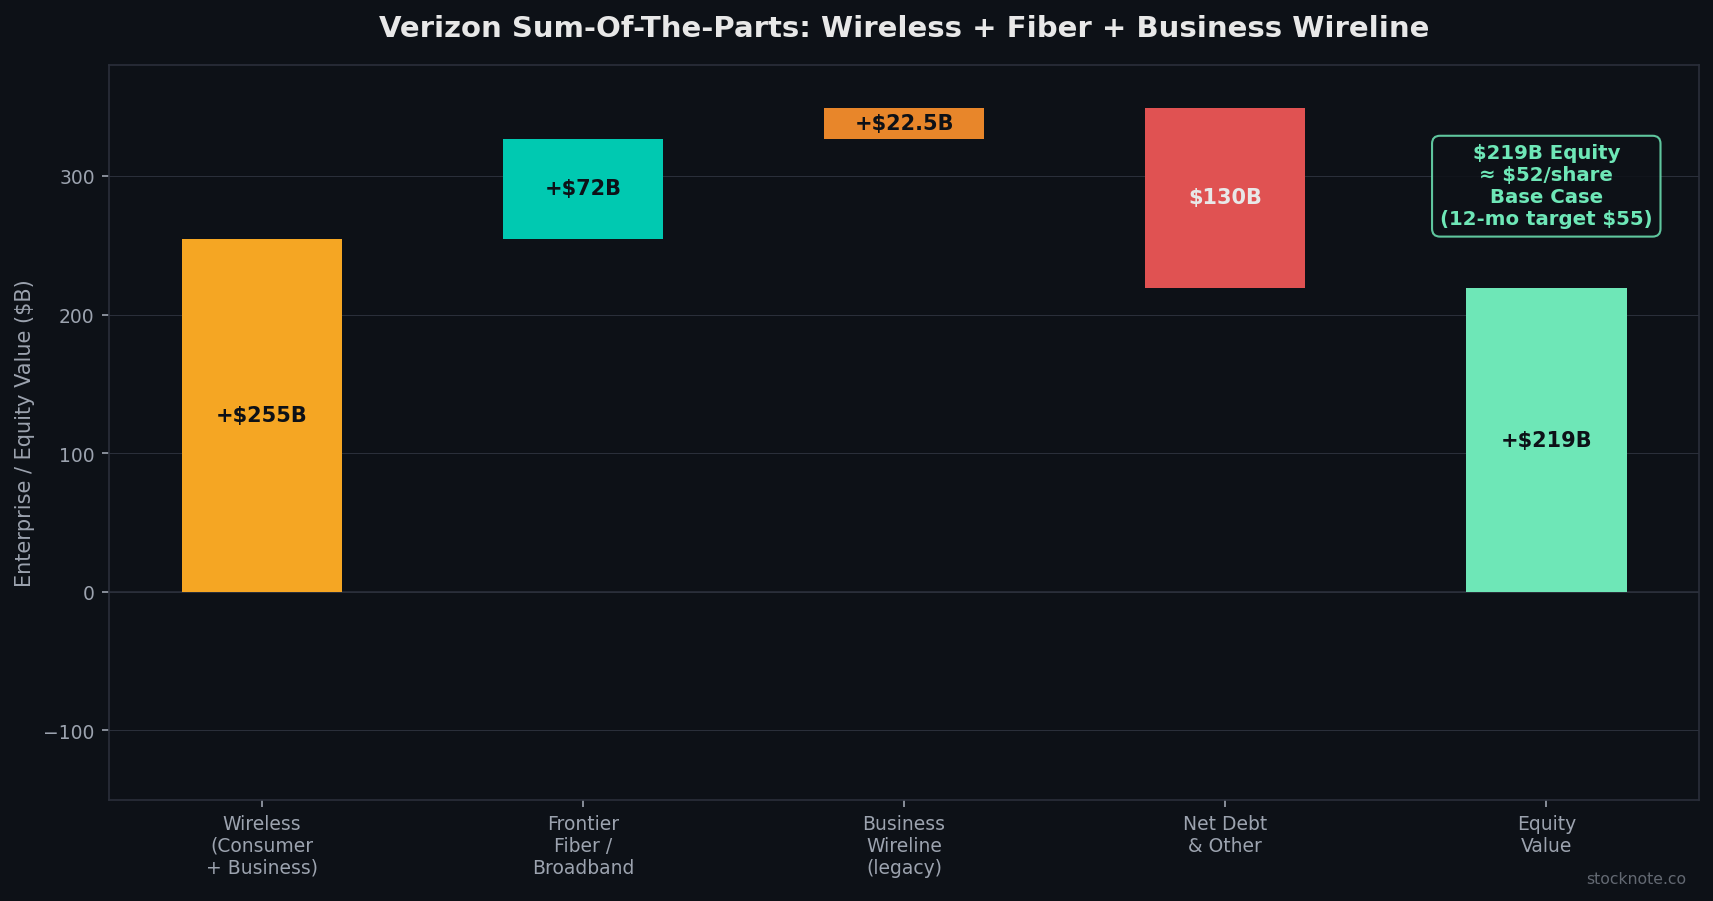
Wireless Services (Consumer + Business): Revenue approximately $85B annualized, EBITDA approximately $34B at 40% margin. At 7.5x EV/EBITDA (stable wireless with recovering share momentum), segment value is approximately $255B.
Fiber/Broadband (Frontier + Organic Fios): Revenue approximately $15B growing 27%+ annually, EBITDA approximately $6B. At 12x (infrastructure multiple), segment value is approximately $72B.
Business Wireline (declining legacy): Revenue approximately $25B, EBITDA approximately $5B, declining. At 4.5x, segment value is approximately $22.5B.
Total EV: $349.5B. Subtract net unsecured debt of $130B and Frontier obligations being paid down, equity value is approximately $219B. On approximately 4.21B diluted shares, that is approximately $52/share base case. Push fiber to a 14x infrastructure multiple (justified as convergence economics become visible) and equity reaches approximately $230B or $55/share — the 12-month target. The multi-year $65+ target reflects Frontier synergies of $1B+ flowing through, the AI infrastructure revenue materializing, and net leverage declining to the targeted 2.0–2.25x by 2027 from the current 2.6x.
The 21-Year Dividend Compounder Floor — A Structural Buyer Base Most Investors Miss
Twenty-one consecutive years of dividend increases is an institutional statement that transcends any single earnings quarter or competitive headwind. The dividend-growth record spans the mobile data revolution, the 2008 financial crisis, the COVID pandemic, the 2021–2022 inflation shock, and the T-Mobile competitive disruption. Income-focused institutions — dividend ETFs (VZ is a major holding in SCHD, VIG, and VYM), insurance company general accounts, and pension funds — accumulate Verizon at yields above 5.5% in diversified telecom names with investment-grade credit ratings. Verizon's Baa1/BBB+ credit ratings ensure it qualifies for insurance-company general-account investment within NAIC guidelines, providing a buyer base that is essentially structural and price-insensitive in the near term.
The OpEx savings target. Verizon targets $5B in operating expense savings for 2026, supported by AI-driven productivity gains (contact center automation, network operations optimization, field service scheduling) and decommissioning of legacy network elements from the Frontier integration. The 10-workstream transformation program is designed to make Verizon an "AI-native" company — reducing structural costs by 15–20% across back-office operations over a 3-year window. At $5B of annual OpEx savings flowing to EBITDA, and a 7.5x EV/EBITDA multiple, the incremental equity value is approximately $37.5B or $9/share — none of which is in current sell-side models.
Risks: What Would Break The Thesis
First, Q2 churn reversal. If the improvement to below 0.85% in March is not sustained — if Q2 consumer postpaid churn returns to 0.95%+ — the competitive thesis is challenged. Track the Q2 2026 earnings (July 22, 2026) churn figure as the primary test. Two consecutive quarters of postpaid churn above 0.90% would warrant a price-target reduction. Second, Frontier integration cost overruns. The $20B acquisition is complex — network integration, IT system migration, customer service consolidation — and execution risk is real. Cost overruns above the guided synergy range would pressure near-term FCF and potentially impair the deleveraging timeline. Third, a 5G spectrum re-auction where T-Mobile obtains additional mid-band spectrum advantage further widens the network quality gap in rural markets where Verizon has historically competed on coverage rather than speed.
Conclusion and Investment Recommendation
Verizon is a 21-year dividend compounder where three independent signals are converging positively for the first time since the T-Mobile competitive disruption began in 2020. Postpaid phone churn below 0.85% in March — the first positive Q1 net adds in 13 years — confirms the competitive turnaround is operational, not hoped for. Frontier fiber convergence is producing a 30% churn advantage on bundled customers, compounding as 32M+ fiber passings are activated through 2026. And the total-return profile (6.1% yield + buyback + 7% FCF growth) delivers approximately 10%+ annual return without any multiple expansion. Multiple expansion — from the current 9.2x to a peer-consistent 11–12x — adds another $10–15 per share of upside on the 12-month horizon. Rating: BUY. 12-month price target: $55. Multi-year intrinsic value: $65+.

Sandeep Gupta
Independent equity research analyst publishing forensic theses on US-listed stocks. MBA, Politecnico di Milano (Milan, Italy).
Get new research in your inbox
Subscribe to receive forensic equity research the moment it's published. Free, no spam.
Related Research
 T
T AT&T's 45% Fiber-Wireless Attach Rate Is The Convergence Story The Debt Overhang Narrative Is Missing (T)
 O
O Realty Income’s 671 Consecutive Monthly Dividends And A 235bps Acquisition Spread Make The Rate-Sensitivity Label Wrong (O)
 STLA
STLA
Discussion
Be the first to comment.