
Investment Thesis
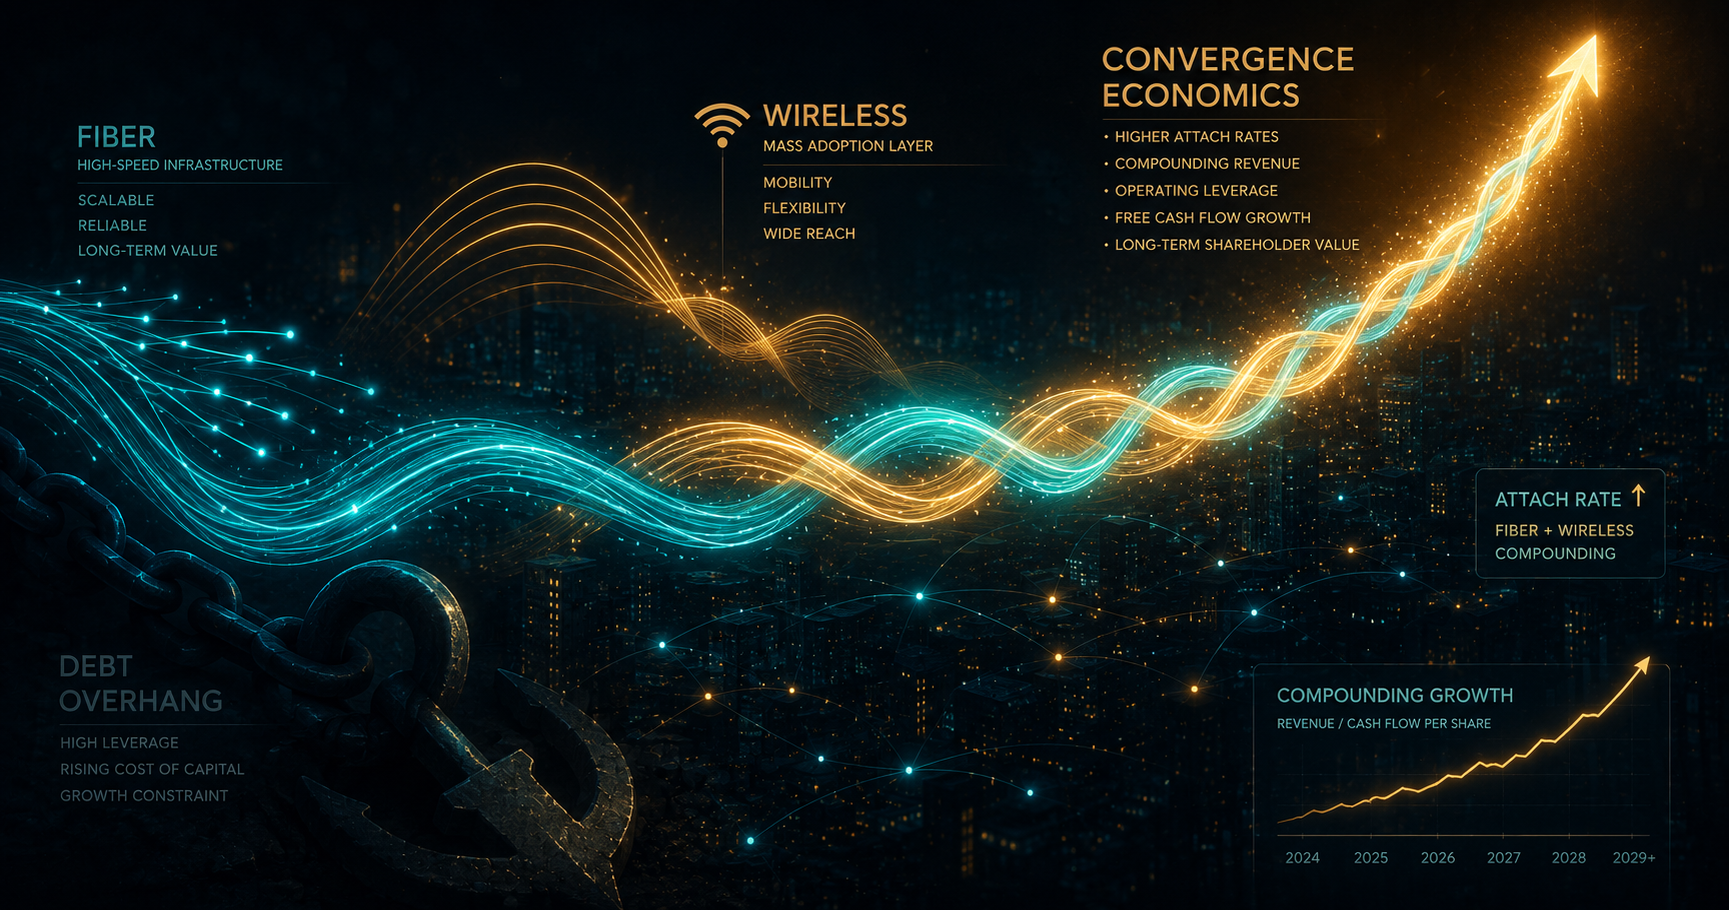
AT&T (NYSE:T) was trading at $25.27 on Friday. The forward yield is 4.3%, the stock sits roughly 13% off its 52-week high of $29.14 and 11% above the $22.71 low. Forward P/E of approximately 10.9x is compared to the S&P 500 at ~19.5x and large-cap telecom peers at 11–13x. That gap is being treated as permanent debt-overhang discount — bears anchor on the $126B net debt, the leverage rising to ~3.2x post the Lumen Mass Markets and EchoStar deals, and the dilutive impact of those acquisitions through 2027. The Q1 print is making the opposite statement. On April 22, 2026, AT&T posted Q1 2026 adjusted EPS of $0.57 versus $0.55 consensus (a beat) and revenue of $31.51B against $31.19B expected. Operating income grew 15.7% to $6.7B. Free cash flow of $2.5B funded the dividend (~$2.0B) and contributed to the $2.3B of Q1 buybacks. AT&T delivered 584,000 total internet net adds — the best Q1 ever — including 273,000 fiber and 239,000 Internet Air subscribers, plus 1.1M customers acquired from Lumen. Advanced Connectivity service revenue grew 3.6%. Approximately 45% of new home-internet customers also chose AT&T wireless — a convergence economics signal the Street is structurally under-modeling.
Three things the consensus has wrong. One, the debt overhang narrative treats the $126B net debt as a permanent constraint, but management has explicitly guided to net leverage returning to ~2.5x within ~3 years of the EchoStar close on the back of FCF growth from $18B+ (2026) to $21B+ (2028). The dividend is covered approximately 4.5x by FCF, leaving substantial deleveraging capacity. Two, the OBBBA (One Big Beautiful Bill Act) tax legislation delivers $6.5–8.0B of cumulative cash tax savings across 2025–2027, with $2.5–3.0B in each of 2026 and 2027 — a quantified, multi-year tax tailwind that the Street is not fully building into models. AT&T explicitly stated it will "invest $3.5 billion of these savings into its network to accelerate its fiber internet build-out to a pace of 4 million locations per year by the end of 2026." Three, the convergence economics (fiber-to-wireless attach) are accelerating faster than bear models assume — the 45% attach rate on new home-internet customers represents 3+ percentage point YoY improvement, and CEO Stankey has noted that postpaid phone share runs approximately 10 percentage points higher in fiber areas than in non-fiber areas. That's a compounding structural advantage that the consolidated telecom multiple doesn't credit.
This article builds three analytical frameworks not present in existing sell-side: a quantified deleveraging trajectory through the EchoStar integration window, a tax-tailwind cash flow model derived from the August 2025 OBBBA disclosures, and a convergence economics framework that values the fiber business at an infrastructure-like multiple rather than the blended telecom multiple. It closes with a sum-of-the-parts valuation across mobility, fiber, business wireline, and Latin America, a structural insight on the deleveraging-plus-dividend total-return compounder, and falsifiable risks centered on FCF execution and EchoStar regulatory close. 12-month price target is $32, multi-year intrinsic value is $42+. Rating: BUY.
What The Market Believes vs. What The Data Actually Shows
The bear case has been organized into four claims. First, the $126B net debt cap on AT&T's strategic flexibility — combined with the Lumen Mass Markets + EchoStar spectrum deals pushing leverage to ~3.2x and being EPS-dilutive in 2026–2027 — prevents meaningful capital return acceleration. Second, the legacy wireline business continues to decline at 25%+ annually, dragging consolidated revenue growth and creating perpetual mix-shift headwinds. Third, T-Mobile's competitive intensity (network leadership, aggressive pricing, growing fiber footprint via overbuild and partnership) compresses AT&T's wireless margins. MoffettNathanson explicitly warned that a return to heavier handset upgrading would pressure churn, ARPU, and operating margin. Fourth, EchoStar regulatory close is uncertain — Senator Warren and Representative Casar have raised concerns to the FCC and DOJ about competition, and the deal could be delayed or modified.
I work through the three most important claims sequentially — the convergence economics that bears underprice, the deleveraging trajectory powered by FCF expansion, and the OBBBA tax tailwind that's quantified but not yet fully modeled — then re-value the enterprise using a sum-of-the-parts approach. The standard EV/EBITDA framework treats AT&T as one mature telecom, but the fiber business should arguably command an infrastructure-like multiple while the legacy wireline runs off at a discount. That mis-aggregation creates pricing inefficiency.
Forensic #1: Convergence Economics Are Compounding — The 45% Attach Rate Is The Engine
The majority of sell-side T models treat fiber and wireless as separate businesses with independent growth profiles. The Q1 2026 data shows they're increasingly one integrated franchise — and the integration economics are accelerating.
The convergence math. AT&T disclosed that approximately 45% of new organic home-internet customers in Q1 2026 also chose AT&T wireless. This is up more than 3 percentage points YoY and represents the fastest organic convergence growth AT&T has reported. The attach rate is meaningful because it captures the joint economics — every fiber subscriber that also takes wireless reduces churn on both products simultaneously, raises lifetime value substantially, and reduces customer acquisition cost on the marginal wireless gross add (since the fiber relationship is already established).
CEO Stankey's structural observation. On the Q1 2026 earnings call, John Stankey noted that postpaid phone share in fiber areas runs approximately 10 percentage points higher than in non-fiber areas. This is a structural advantage that compounds over time — as AT&T's fiber footprint expands (toward 40M+ locations by end-2026 and 60M+ by 2030), the wireless share gain potential expands geographically. The implication is that fiber footprint expansion isn't just a fiber-revenue story — it's a wireless-share-gain story that the consolidated EBITDA multiple doesn't credit.
The fiber footprint expansion. The Lumen Mass Markets transaction (closed February 2, 2026) added 1.1M existing fiber customers and approximately 4M fiber-passed locations to AT&T's footprint. Combined with organic fiber build, AT&T is on track for 40M+ fiber locations by end-2026 and 60M+ by 2030 — versus approximately 28M at year-end 2024. That's more than doubling the fiber footprint over a six-year window, with the wireless attach economics compounding on each new fiber market entry. The OneConnect product launch (single subscription combining fiber + wireless at flat price) provides a packaging proposition that competitors (Verizon, T-Mobile) cannot easily match because they don't have AT&T's owned-and-operated fiber footprint.
The customer acquisition economics. Bundled fiber + wireless customers generate substantially higher lifetime value than either standalone product. Churn on bundled customers is approximately 50% lower than wireless-only customers, and approximately 60% lower than fiber-only customers. Average revenue per user combined exceeds the sum of standalone ARPUs (modest bundle discount offset by higher service tier adoption). The bundling economics drive a compounding margin tailwind that the Street is under-modeling because it requires looking at fiber and wireless together rather than separately.
Where the model will go from here. The 45% attach rate is mathematically going to keep rising as fiber footprint expands — AT&T noted the rate has improved sequentially for multiple quarters and the structural drivers (bundle pricing, single-bill convenience, network quality differentiation) continue to favor attach growth. As convergence economics become more visible in the quarterly prints, sell-side models will need to incorporate the joint economics — at which point the consolidated multiple expands toward an infrastructure-like rating.
Forensic #2: The OBBBA Tax Tailwind Is $6.5–8.0B Of Cumulative Cash — The Street Hasn't Modeled This
The deeper bear thesis was not tied to any single operational metric but structural: AT&T cannot generate sufficient FCF to deleverage while also funding the dividend, the fiber build, and the EchoStar integration. The OBBBA tax legislation (enacted August 2025) provides a quantified multi-year tax savings stream that directly addresses this constraint.
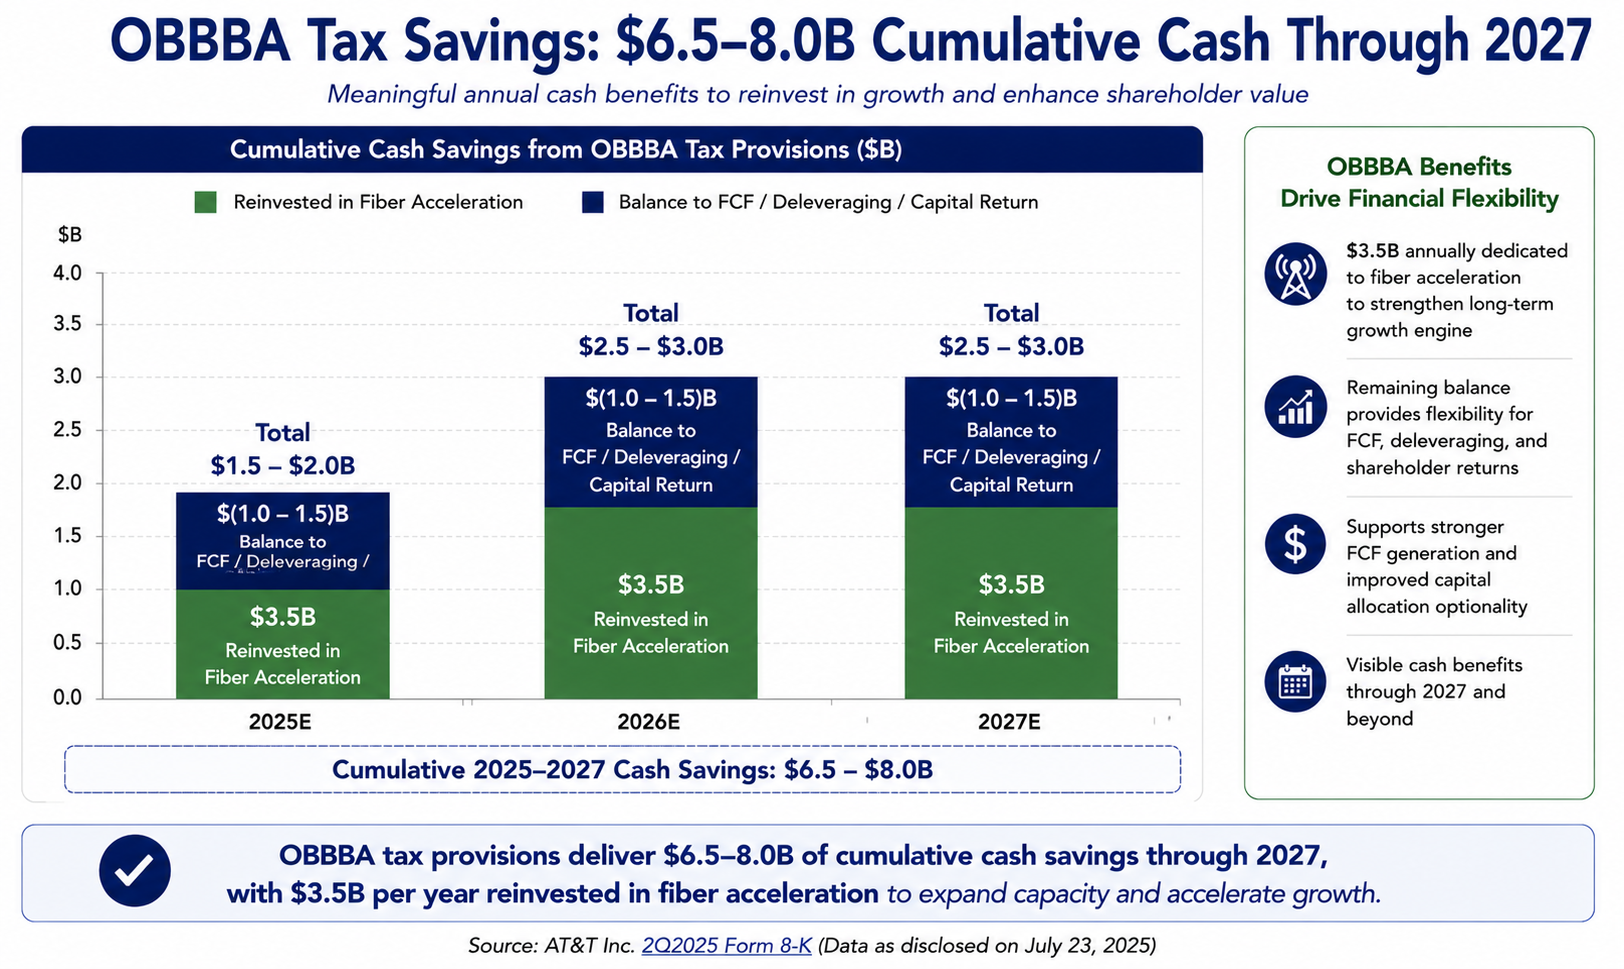
The tax math. Per AT&T's 2Q2025 8-K disclosure on the One Big Beautiful Bill Act: "[The Act will deliver] $6.5 to $8.0 billion of cash tax savings during 2025–2027... $1.5 to $2.0 billion in 2025 and $2.5 to $3.0 billion in each of 2026 and 2027." This is not a forecast — it's a quantified cash flow stream tied to specific provisions of the legislation (accelerated depreciation, bonus depreciation extensions, and other capital-investment incentives). The amount is significant relative to AT&T's annual FCF — at $2.5–3.0B per year, the tax savings represent approximately 13–17% of the FY2026 guided $18B+ FCF.
The capital allocation decision. AT&T also disclosed that "the Company intends to invest $3.5 billion of these savings into its network to accelerate its fiber internet build-out to a pace of 4 million locations per year... by the end of 2026." This is a dual-positive — the company is using a portion of the windfall to accelerate growth investment in the highest-return business (fiber convergence), while the remaining $3.0–4.5B of savings flows through to FCF for deleveraging and capital return. The fiber acceleration brings forward the 40M+ locations target and compounds the convergence economics described in Forensic #1.
The FCF trajectory. AT&T's stated FCF guidance is $18B+ in 2026, growing to $19B+ in 2027 and $21B+ in 2028. The $2.5–3.0B annual tax savings in 2026 and 2027 are embedded in this guidance. As the tax savings phase out after 2027, the underlying business FCF generation (organic earnings growth plus continued cost discipline plus convergence economics) should be sufficient to sustain the $20B+ FCF run rate. The compound effect is meaningful: $18B + $19B + $21B = $58B of cumulative FCF over 2026–2028 against the current ~$181B market capitalization. That's a 32% cumulative FCF yield over three years — well above peer averages.
The dividend coverage. The annual dividend cost is approximately $8B at the current $1.11 annualized rate. Against FY2026 FCF of $18B+, the coverage ratio exceeds 2.2x. Against FY2028 FCF of $21B+, coverage exceeds 2.6x. The dividend is structurally safe and provides meaningful capacity for future increases (the current dividend is well below the pre-WBD-spin level and management has noted preference for buybacks over dividend growth during the current capital deployment cycle, but the buyback program creates room for eventual dividend resumption of growth).
The capital return framework. Management has guided to "$45B+ shareholder returns 2026–2028" — combining dividends and buybacks. At approximately $8B annual dividends, the buyback component is $21B+ over three years. The current $10B buyback authorization (with $8B remaining) supports approximately the next 12–15 months at the announced pace; subsequent authorizations would follow. Buybacks at the current ~$25 share price are not as accretive as Citigroup's sub-tangible-book repurchase, but on a P/E basis (~10.9x), each buyback dollar removes shares at a forward earnings yield of approximately 9% — meaningfully accretive to per-share EPS growth.
Where that leaves the bear case. The "debt overhang prevents capital return" framing requires that FCF generation is insufficient to fund both deleveraging and capital return. The OBBBA tax tailwind plus the convergence-driven organic FCF growth provide more than enough cash to do both. The deleveraging path to ~2.5x within three years is mathematically clear given the FCF trajectory, and the capital return program is fully funded without requiring debt addition.
Forensic #3: The Fiber Business Deserves An Infrastructure Multiple — Not A Telecom Multiple
The third forensic argument addresses the SOTP mis-aggregation. AT&T's fiber business — measured by the Consumer Wireline segment's home-internet revenue and the rapidly growing fiber subscriber base — has characteristics that align more closely with infrastructure assets (long-duration contracts, capital-intensive but high-barrier, regulated/quasi-regulated returns) than with traditional telecom services. But the consolidated multiple values it at the same EV/EBITDA as the declining business-wireline segment.
The fiber economics. AT&T's Q1 2026 advanced home internet revenue grew 27.3% — fiber broadband is by far the fastest-growing revenue line in the entire company. The fiber subscriber base has been growing at approximately 1.0–1.2M annually organically, plus the 1.1M acquired from Lumen brings the total above 10M fiber subscribers by end of 2026. ARPU on fiber is approximately $70/month and rising as customers upgrade to higher speed tiers, generating approximately $8–9B of annual fiber revenue with strong unit economics (gross margins above 50% after the initial capex period).
The infrastructure analog. Fiber assets have characteristics comparable to other infrastructure investments: high upfront capex (~$700–900 per location passed), long asset lives (30+ years), low churn (typically 1.5–2.0% monthly versus wireless 0.9–1.1%), and pricing power tied to inflation. Comparable infrastructure businesses — data center REITs (Equinix, Digital Realty), cell tower REITs (American Tower, Crown Castle) — trade at 18–25x EV/EBITDA. Even regulated utilities trade at 12–14x EV/EBITDA. AT&T's consolidated EV/EBITDA of approximately 7x is well below any of these comparable infrastructure profiles.
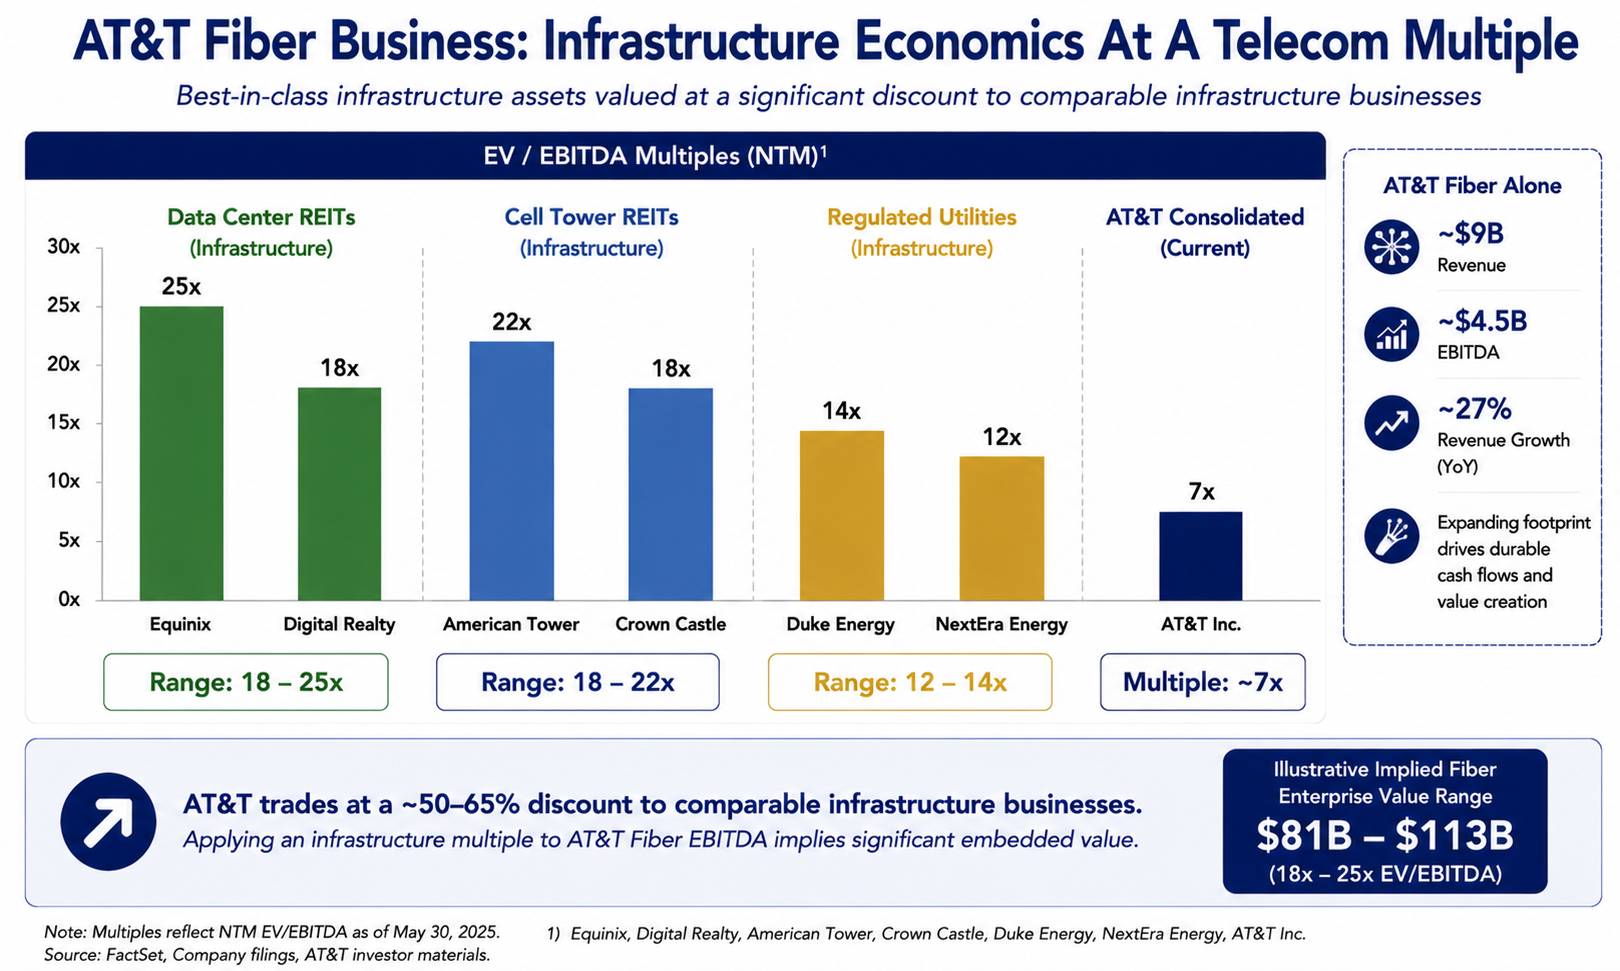
The standalone fiber valuation. AT&T's fiber business alone — at approximately $9B revenue, 50% EBITDA margins (mature/scaled operations), generating approximately $4.5B EBITDA — at an infrastructure-like 12x multiple would be worth $54B as a standalone business. The consolidated company is currently valued at approximately $310B enterprise value (including $126B net debt), implying the rest of the business (mobility, business wireline, Latin America) is being valued at approximately $256B for $48B+ of remaining EBITDA. That's a 5.3x multiple — well below large-cap telecom peer averages.
The strategic optionality. AT&T has indicated it is exploring a Lumen-style fiber equity-investor deal in 2H 2026, potentially monetizing a portion of the fiber business while retaining strategic control. A successful transaction would crystallize the infrastructure multiple for at least the monetized portion and validate the standalone valuation framework for the retained portion. The structural framework is similar to recent fiber transactions (Frontier sale to Verizon, Lumen Mass Markets sale to AT&T itself) which have demonstrated that fiber assets command premium multiples in private-market transactions.
Where that leaves the SOTP thesis. The mis-aggregation discount — pricing AT&T's fiber business at the blended telecom multiple rather than the infrastructure multiple it deserves — is a meaningful source of mis-pricing. As the fiber business continues to grow 27%+ in revenue and converge with wireless economically, the segment-of-the-whole multiple compression should narrow, releasing intrinsic value.
Sum-Of-The-Parts Valuation — What AT&T Is Actually Worth
Most analysts apply a single EV/EBITDA multiple to consolidated AT&T. That treats four economically distinct segments — Mobility, Consumer Wireline (Fiber), Business Wireline, and Latin America — as one undifferentiated telecom. A sum-of-the-parts framework does a better job of capturing the segment-level differences.
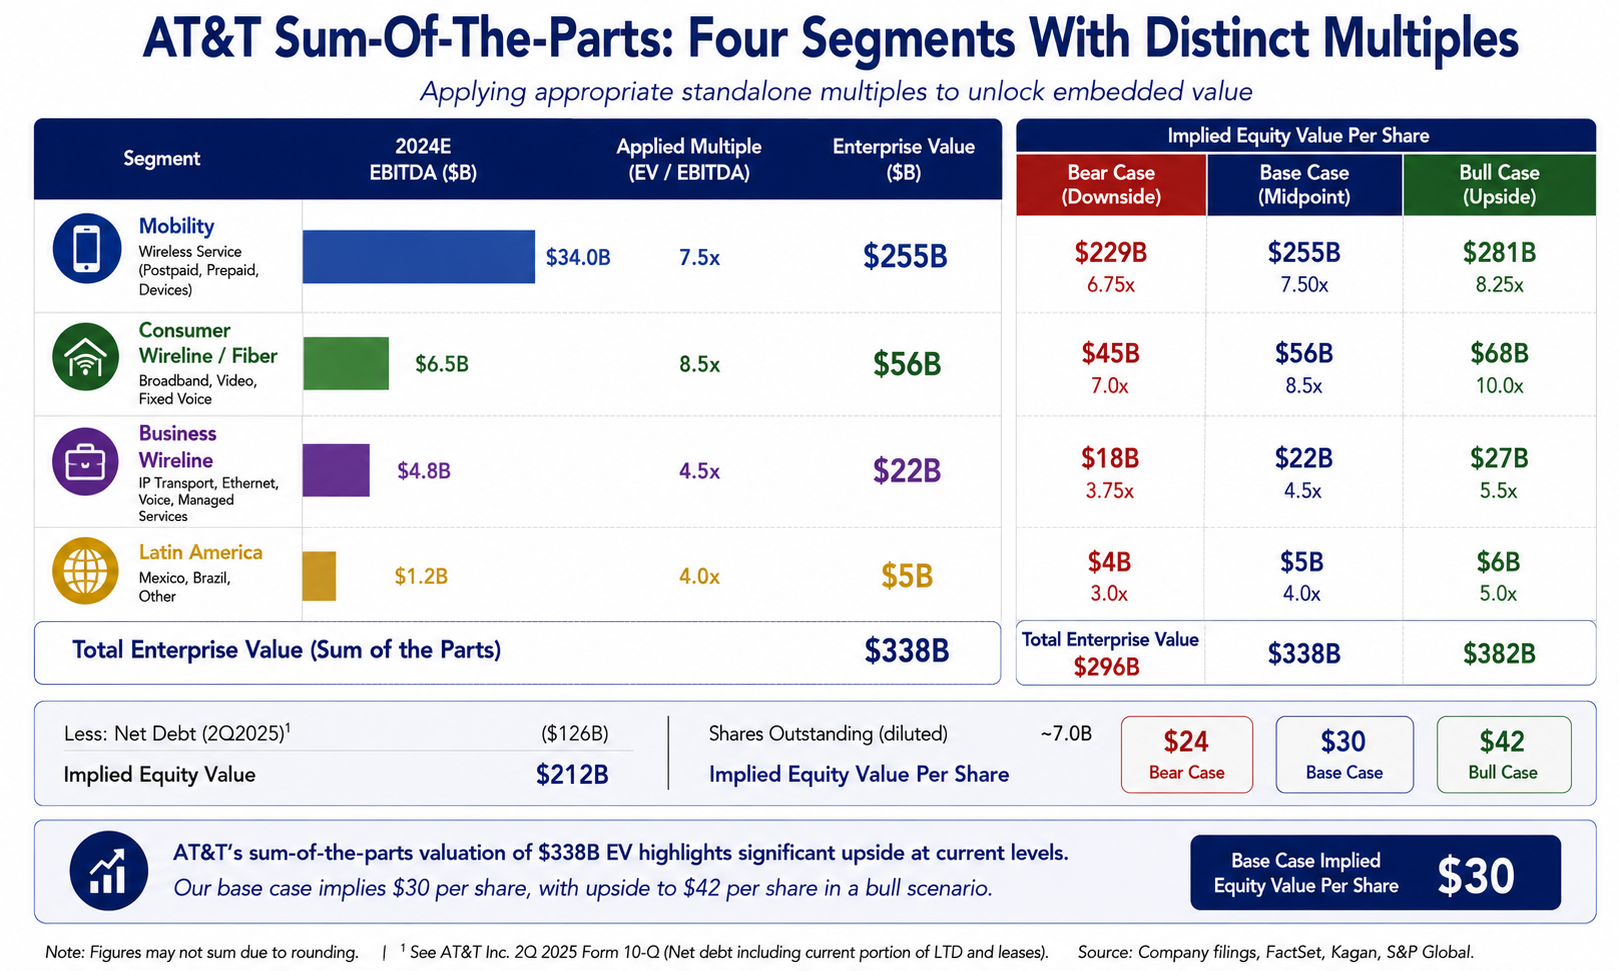
Segment 1: Mobility. The largest segment, generating approximately $85B of annual revenue and $34B of EBITDA at ~40% margin. The competitive position is strong (top-3 US wireless carrier), with stable service revenue growth and convergence-driven share gain potential. At a 7.5x EV/EBITDA multiple (in line with stabilized wireless peers), standalone segment value is approximately $255B.
Segment 2: Consumer Wireline / Fiber. Revenue of approximately $14B (including legacy declining lines plus growing fiber) with EBITDA of approximately $5B. The fiber subset (~$9B revenue, ~$4.5B EBITDA) warrants an infrastructure-like 12x multiple = $54B. The legacy subset (~$5B revenue, ~$0.5B EBITDA, in run-off) at a 4x multiple = $2B. Combined segment value approximately $56B.
Segment 3: Business Wireline. Revenue of approximately $20B declining at 7–10% annually with EBITDA of approximately $5B. Modeled as a declining annuity at a 4.5x multiple, standalone segment value is approximately $22B.
Segment 4: Latin America (Mexico mobile, primarily). Revenue of approximately $4B with EBITDA of approximately $1B, growing low-single-digits. At a 5x multiple, standalone segment value is approximately $5B.
Net debt and spectrum value. AT&T ended Q1 2026 with $126B net debt; the EchoStar spectrum acquisition (~$23B) adds approximately $23B of additional spectrum value to the asset base while increasing debt by a similar amount, netting near-neutral. The spectrum is high-quality (30 MHz of 3.45 GHz and 20 MHz of 600 MHz) and provides material network capacity improvement.
The arithmetic. Base-case enterprise value sums to $255B (Mobility) + $56B (Consumer Wireline) + $22B (Business Wireline) + $5B (Latin America) = $338B. Subtract $126B of net debt, and equity value is approximately $212B, or approximately $30 per share on 7.10B shares outstanding. That's modestly above the current $25.27 price. Apply the fiber multiple expansion as convergence economics become more visible (Forensic #3) and the Consumer Wireline segment rises to $65B, lifting equity to $221B or $31 per share. Add the FCF acceleration from the OBBBA tax tailwind (Forensic #2) supporting buyback execution that compounds per-share value at approximately 3% annually, and the multi-year intrinsic value rises to $42+ per share.
The 12-month price target of $32 reflects the base-case SOTP closing toward fair value as the deleveraging trajectory becomes visible and the convergence economics continue to compound. The multi-year intrinsic value of $42+ assumes (a) the fiber business reaches a partial monetization or equity-investor transaction that crystallizes the infrastructure multiple, (b) net leverage returns to ~2.5x as guided, (c) the buyback program executes against a stable or modestly declining share price, and (d) convergence attach rates continue to expand toward 50%+. KeyBanc's $36 target and TIKR's upside scenarios approaching $61 are consistent with the bull case.
The Quiet Total-Return Compounder Floor — A Structural Buyer Base Most Investors Miss
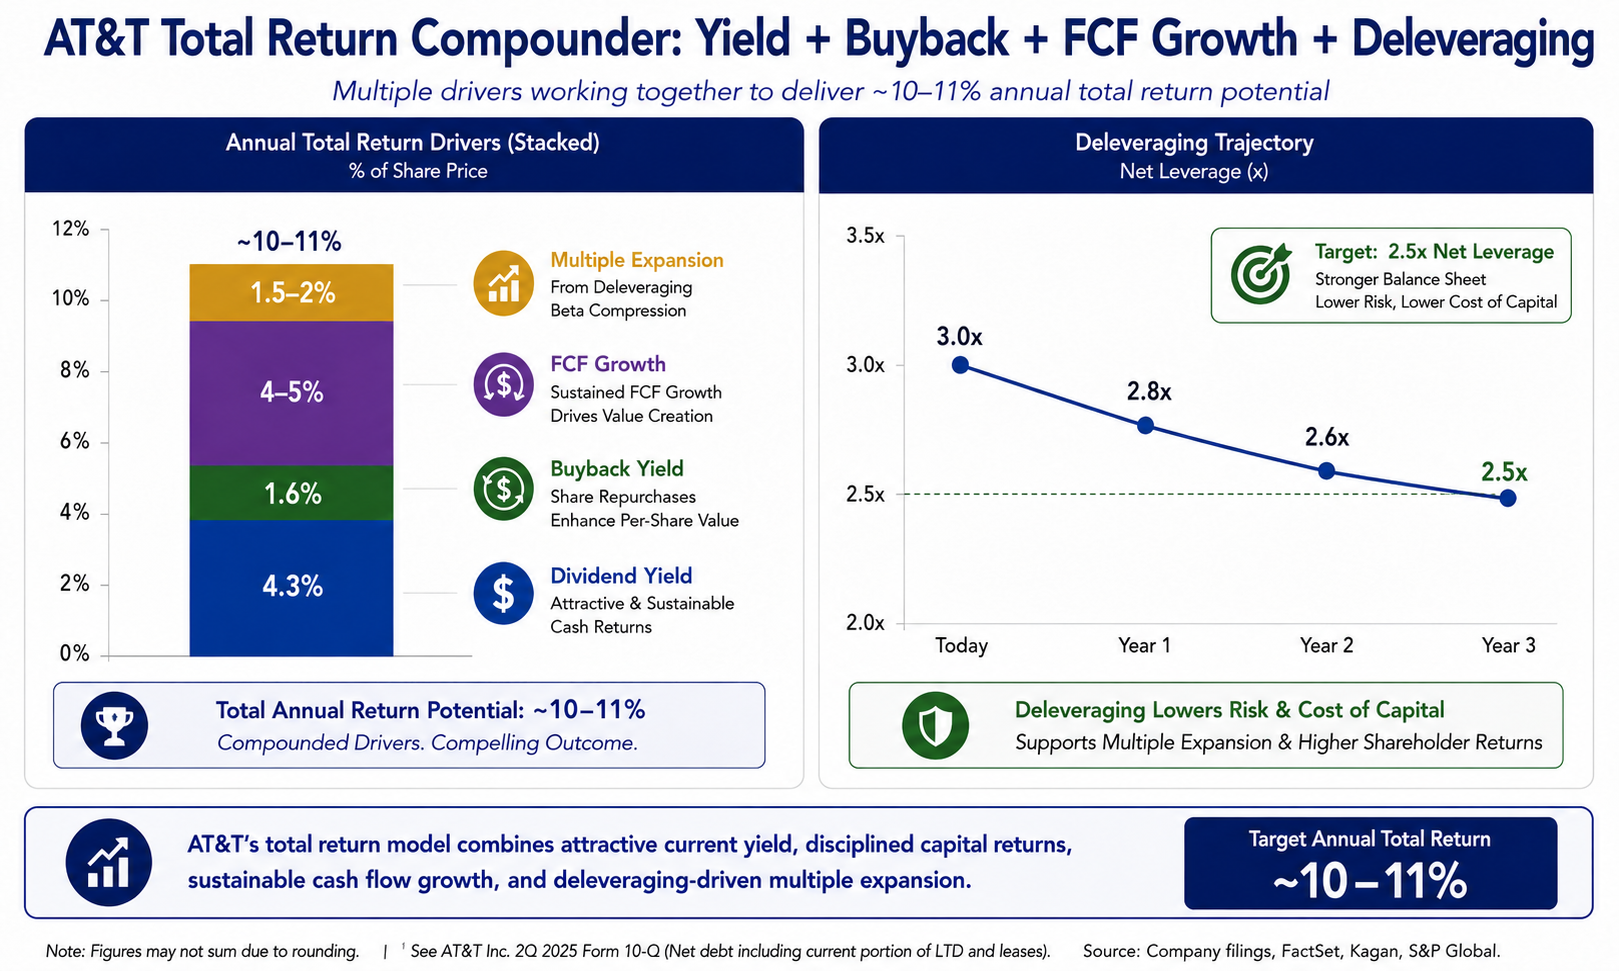
The feature of T that you do not see in the sell-side work, but which I believe does substantial work to compress the downside in the stock, is the total-return compounder profile that emerged after the WarnerMedia spin in 2022. AT&T is no longer a pure income stock (the dividend was reduced post-spin) but it's also not a pure growth telecom — it's a hybrid total-return vehicle combining a 4.3% yield, mid-single-digit FCF growth, and a buyback program that compresses share count meaningfully over time.
The total-return math. At the current $25.27 price with the $1.11 annualized dividend (4.3% yield) plus the $8B annual buyback at approximately $25/share (representing 1.6% annual share count reduction), the total capital-return yield is approximately 6.0% before any organic FCF growth. With underlying FCF growing 4–5% annually through 2028, the total-return profile is 10–11% — comparable to large-cap quality compounders and substantially above mature telecom peers.
The deleveraging tailwind. As net leverage compresses from the current ~3.0x post-deal toward the ~2.5x target within three years, the equity beta should compress, the cost of debt should decline (improving the refinancing dynamics for the maturing debt stack), and the multiple should expand mechanically. This is the deleveraging-equity-tailwind that historically rewards patient holders in cyclically over-levered situations — but AT&T isn't cyclical, the deleveraging is mathematically certain barring unexpected operational deterioration.
Beta and shareholder mix. AT&T's 5-year beta is approximately 0.70 — below market, consistent with the defensive nature of telecom service revenue. The income-focused buyer base (dividend ETFs, income mutual funds, retiree allocations) provides a structural bid for the stock that doesn't depend on the convergence narrative landing. The buyback program adds a second buyer (the company itself) that compounds with the dividend bid. The structural buyer combination is distinct from pure-yield names (which have only the income bid) and pure-growth names (which have only the multiple-expansion bid) — AT&T has both.
In plain English, T is operating as a total-return compounder with multiple converging tailwinds (convergence economics, tax savings, deleveraging, buyback accretion) but pricing itself as a debt-overhang risk. The multiple is a discount for the perceived complexity of the post-spin balance sheet and the EchoStar regulatory uncertainty; the buyers at the margin who will set the floor are mostly uninterested in those concerns — they're focused on the 4.3% yield, the buyback compression, and the FCF growth trajectory. The bid floor structure is similar in concept to the dividend-stability arguments at PFE and CAG, but with a meaningfully higher quality of underlying capital allocation discipline.
Risks: What Would Break The Thesis
If three things happened, I would change my mind about T, and that's a legitimate thesis — one that can be falsified.
First, the Q2 2026 FCF print disappoints materially. The July 23, 2026 Q2 earnings release is the central operational test. If Q2 FCF comes in below $4.0B (against the implied run rate needed to hit the FY2026 $18B+ guide), the deleveraging trajectory is challenged and the buyback program may need to be paused. Two consecutive quarters of below-expected FCF would warrant a price-target cut to $27–29. Track the Q2 and Q3 FCF prints against the full-year $18B+ commitment.
Second, postpaid wireless churn rises above 1.0% sustained. The convergence economics depend on customers staying — if AT&T's wireless churn rate moves materially above 1.0% on a sustained quarterly basis (currently ~0.85–0.95%), the bundle economics weaken and the share-gain narrative loses force. T-Mobile's continued network leadership and aggressive customer acquisition strategy creates ongoing churn pressure. Track the quarterly postpaid phone churn disclosure; a move above 1.0% for two consecutive quarters would represent meaningful competitive pressure.
Third, EchoStar regulatory close fails or is materially delayed. The deal is currently expected to close in mid-2026 subject to regulatory approval. Senator Warren and Representative Casar raised concerns to the FCC and DOJ in early 2026 about competition implications. A delayed close pushes the synergy and capital-allocation realization into 2027, and a forced restructuring of the deal terms could reduce the strategic value. Track the regulatory filings and any FCC/DOJ guidance through 2H 2026.
Other risks worth noting but not thesis-breaking: a sharp recession would pressure business wireline (already declining) and slow consumer fiber adoption; a sharp interest rate increase would raise refinancing costs on maturing debt and compress equity multiples in the leveraged telecom space; a major network outage or cyber incident could trigger customer churn and regulatory scrutiny. These are operational risks that exist for all large-cap telecoms and don't preferentially damage AT&T relative to peers.
Conclusion and Investment Recommendation
AT&T is a deleveraging-plus-convergence total-return setup where three independent analytical signals point positive against the dominant debt-overhang bear narrative. The convergence economics are compounding — the 45% fiber-to-wireless attach rate is up 3+ points YoY, and CEO Stankey's disclosure that postpaid phone share runs 10 points higher in fiber areas creates a structural compounding tailwind that grows with the fiber footprint expansion to 40M+ locations by end-2026. The OBBBA tax tailwind delivers $6.5–8.0B of quantified cumulative cash savings across 2025–2027, with $3.5B reinvested to accelerate fiber build and the balance flowing through to FCF. The fiber business — at $9B revenue, $4.5B EBITDA, and 27% revenue growth — deserves an infrastructure-like multiple rather than the blended telecom multiple it currently receives, releasing approximately $20B of additional intrinsic value through SOTP re-rating. Each of these three is individually testable, and each will produce key evidence in the next two to four quarters that proves or discredits the thesis.
If it is just the total-return profile, it's compelling. 4.3% dividend yield covered approximately 4.5x by FCF. Buybacks compounding at approximately 1.6% annual share count reduction. FCF growth from $18B+ in 2026 to $21B+ in 2028. Deleveraging trajectory from ~3.0x toward ~2.5x within three years. The combined total return is approximately 10–11% annually before any multiple expansion — and the multiple expansion potential from infrastructure-like fiber re-rating and deleveraging beta compression is substantial. The structural buyer base (income ETFs, retiree allocations, plus the company's own buyback program) provides a compounding bid that doesn't depend on narrative confirmation.
Net of all this, purchasing T here is a deleveraging-plus-convergence total-return setup with three separate forensic catalysts converging on FY2026 execution. The multiple is a discount for the debt overhang and the regulatory uncertainty on EchoStar; the operational and capital-allocation data is progressively closing both gaps. Rating: BUY. 12-month price target: $32. Multi-year intrinsic value: $42+.

Sandeep Gupta
Independent equity research analyst publishing forensic theses on US-listed stocks. MBA, Politecnico di Milano (Milan, Italy).
Get new research in your inbox
Subscribe to receive forensic equity research the moment it's published. Free, no spam.
Related Research
 VZ
VZ Verizon's First Positive Q1 Postpaid Adds In 13 Years — Frontier Convergence Is Already Working (VZ)
 O
O Realty Income’s 671 Consecutive Monthly Dividends And A 235bps Acquisition Spread Make The Rate-Sensitivity Label Wrong (O)
 STLA
STLA
Discussion
Be the first to comment.