
Investment Thesis
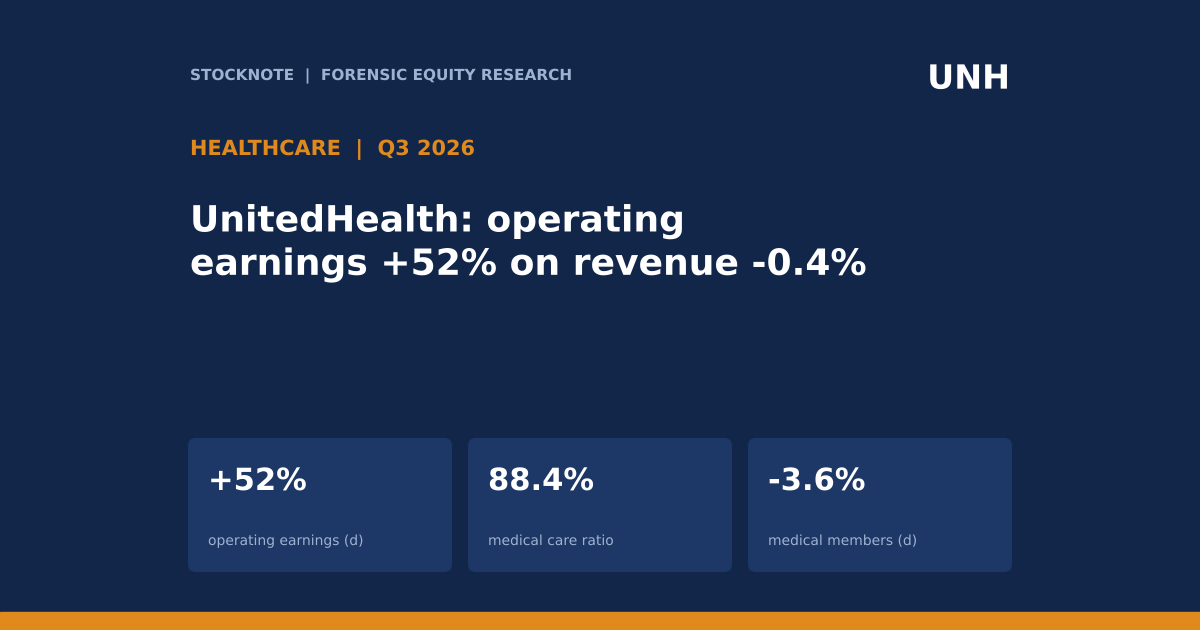
UnitedHealth Group's third-quarter 2026 revenue was $112,694 million, down 0.4% from $113,161 million, while earnings from operations rose 52% (d) to $6,563 million. The operating margin went from 3.8% to 5.8%, the medical care ratio from 89.9% to 88.4%, and adjusted EPS from $2.92 to $4.69. The company raised its 2026 outlook to at least $19.50 of GAAP EPS and at least $20.50 adjusted. The numbers show a margin recovery that came without growth: people served in the medical business fell 3.6% (d) to 48.3 million, with risk-based lines down about 10% (d).
- Consolidated. Revenue $112,694M; earnings from operations $6,563M (year-ago $4,315M); net earnings attributable to shareholders $4,110M ($2,348M); GAAP EPS $4.56 ($2.59); adjusted EPS $4.69 ($2.92).
- Segments. UnitedHealthcare revenue $86,330M, earnings $2,831M (margin 3.3% against 2.1%); Optum revenue $66,883M, earnings $3,732M (margin 5.6% against 3.6%).
- Ratios. Medical care ratio 88.4% (89.9%); operating cost ratio 12.8% (13.5%); days claims payable 47.0 (46.2); days sales outstanding 16.9 (18.6).
- Cash and capital. Cash flows from operations $5.1B (1.2 times net earnings); debt-to-capital 41.7% (Q2: 41.2%); nine-month repurchases about $5.0B and dividends $6.2B.
- Outlook. 2026 GAAP EPS at least $19.50; adjusted EPS at least $20.50; GAAP net earnings projected above $17,650M.
- This article contains no rating, price target or investment advice. Derived figures are marked (d).
Bottom line. A health insurer can raise margin by pricing for risk and shedding the members it loses money on, at the cost of revenue growth. That is what these numbers show: profit up half on flat revenue. The test of whether the recovery lasts is the medical care ratio, since each point on roughly $100B of quarterly revenue is large, and the member base that remains.
Source: UnitedHealth Group Q3 2026 8-K earnings release.
Q3 2026 At A Glance
| $ millions | Q3 2026 | Q3 2025 | Change (d) |
|---|---|---|---|
| Total revenues | 112,694 | 113,161 | -0.4% |
| Earnings from operations | 6,563 | 4,315 | +52% |
| Operating margin | 5.8% | 3.8% | +2.0 pts |
| Net earnings to shareholders | 4,110 | 2,348 | +75% |
| GAAP / adjusted EPS | $4.56 / $4.69 | $2.59 / $2.92 | +76% / +61% |
| Medical care ratio | 88.4% | 89.9% | -1.5 pts |
| Days claims payable | 47.0 | 46.2 | +0.8 |
Source: UnitedHealth 8-K.
What The Market Believes vs. What The Data Actually Shows
| Belief | What the data show |
|---|---|
| Profit recovery means growth is back | Revenue fell 0.4% (d) and people served in medical plans fell 3.6% (d). |
| Every segment is shrinking | UnitedHealthcare revenue fell 0.8% (d) and Optum 3.3% (d), but both earned more: +57% and +49% (d). |
| Reserves are being released to flatter the ratio | Days claims payable rose to 47.0 from 46.2, a higher payable balance, which is not the pattern of a reserve release (my interpretation; the release does not give reserve development). |
| Cash earnings lag accounting earnings | Cash flow from operations was $5.1B, 1.2 times net earnings. |
| Leverage is falling | Debt-to-capital was 41.7% against 41.2% at June 30, so it rose 0.5 points. |
Forensic #1: Profit Without Growth
| $ millions | Q3 2026 | Q3 2025 | Change (d) |
|---|---|---|---|
| UnitedHealthcare revenue | 86,330 | 87,070 | -740 |
| Optum revenue | 66,883 | 69,177 | -2,294 |
| UnitedHealthcare earnings | 2,831 | 1,805 | +1,026 |
| Optum earnings | 3,732 | 2,510 | +1,222 |
| Total earnings from operations | 6,563 | 4,315 | +2,248 |
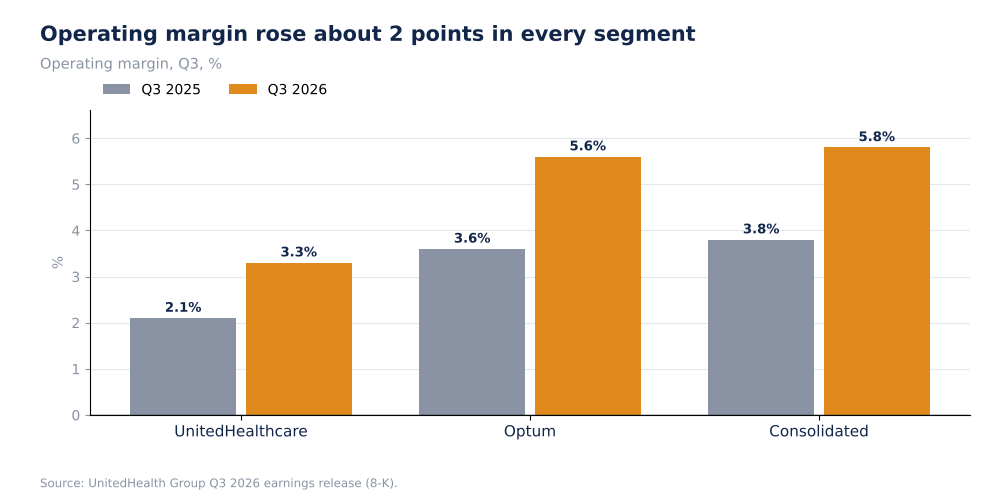
UnitedHealth Operating Margin By Segment, Q3 2025 Vs Q3 2026 (Self-Made, Company Data)
The two segments' earnings rose $1,026M and $1,222M (d), which add to the $2,248M (d) rise in consolidated operating earnings, so corporate items did not change materially. The segment revenues sum to more than consolidated revenue ($153.2B against $112.7B, d) because of intersegment eliminations, so segment revenues should not be added.
Why it matters. Both segments improved margin by about two points on falling revenue. For UnitedHealthcare, the margin change of 1.2 points (d) on $86B of revenue is worth about $1.0B (d) of quarterly earnings.
Source: UnitedHealth 8-K. Changes are my arithmetic (d).
Forensic #2: Who Left The Plans
| People served (thousands) | Sept 30, 2026 | Sept 30, 2025 | Change (d) |
|---|---|---|---|
| Medicare Advantage | 7,605 | 8,435 | -9.8% |
| Medicaid | 6,695 | 7,460 | -10.3% |
| Commercial risk-based | 7,575 | 8,440 | -10.2% |
| Part D stand-alone | 2,690 | 2,795 | -3.8% |
| Medicare Supplement | 4,245 | 4,300 | -1.3% |
| Commercial fee-based | 22,180 | 21,490 | +3.2% |
| Total medical | 48,300 | 50,125 | -3.6% |
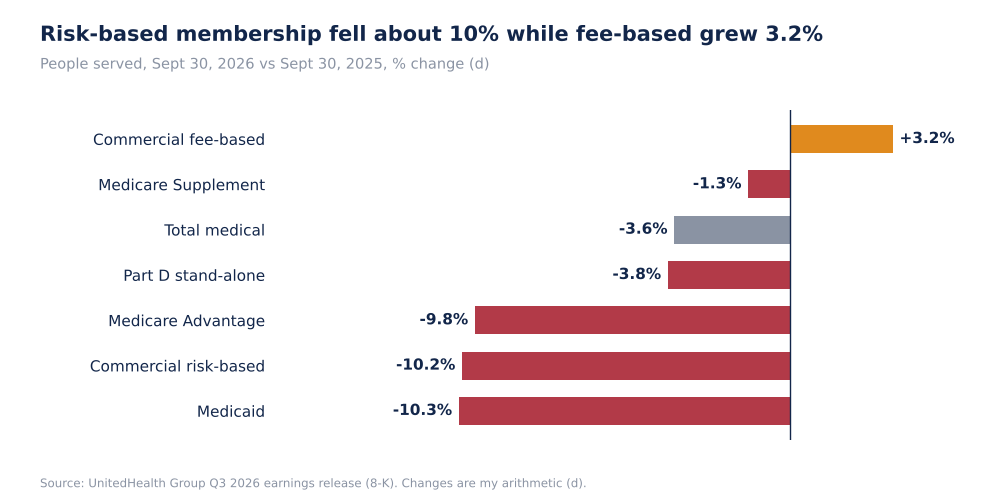
UnitedHealthcare People Served, Percent Change In A Year (Self-Made, Company Data)
The member losses are concentrated where the insurer takes the claims risk: commercial risk-based -10.2%, Medicaid -10.3% and Medicare Advantage -9.8% (d). Fee-based commercial members, where the employer bears the claims cost, grew 3.2% (d). Total medical members fell by 1,825 thousand (d) and the risk-based lines above together by 2,460 thousand (d). The release does not say whether the member losses were chosen (repricing, exits) or lost to competitors.
Why it matters. Shedding unprofitable risk is how margin recovers. The cost is that revenue shrinks, and a recovery built on a smaller base needs the remaining members to stay profitable.
Source: UnitedHealth 8-K. Changes are my arithmetic (d).
Forensic #3: Cost Ratios And Reserves
| Ratio | Q3 2026 | Q3 2025 | Change |
|---|---|---|---|
| Medical care ratio | 88.4% | 89.9% | -1.5 pts |
| Operating cost ratio | 12.8% | 13.5% | -0.7 pts |
| Days claims payable | 47.0 | 46.2 | +0.8 days |
| Days sales outstanding | 16.9 | 18.6 | -1.7 days |
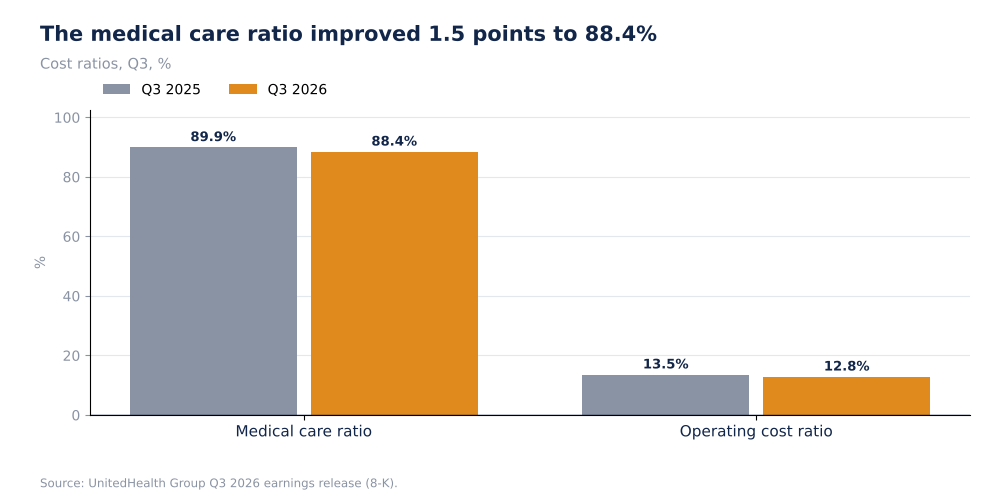
UnitedHealth Medical Care Ratio And Operating Cost Ratio, Q3 (Self-Made, Company Data)
The medical care ratio is claims cost as a share of premiums, and a 1.5-point improvement on premium revenue is the main driver of the margin gain. The operating cost ratio, which is on total revenue, improved 0.7 points. The ratios are on different bases and should not be added. A rising days claims payable figure (47.0 against 46.2) means more claims are unpaid at quarter-end relative to daily cost, which is neutral to mildly conservative for reserve adequacy; the release does not give prior-period reserve development, so I cannot test it. Days sales outstanding fell by 1.7 days (d), so receivables are being collected faster.
Why it matters. Reserve levels are the largest judgment in insurer earnings. A stable or rising payable balance alongside a falling claims ratio is what a clean margin gain looks like, but only the later reserve development confirms it.
Source: UnitedHealth 8-K.
Forensic #4: Cash, Capital And Outlook
| Item | Value |
|---|---|
| Cash flows from operations, Q3 | $5.1B (1.2x net earnings) |
| Debt-to-capital | 41.7% (June 30: 41.2%) |
| Share repurchases, nine months | about $5.0B ($5,031M) |
| Dividends paid, nine months | $6.2B |
| Returns, nine months (d) | about $11.2B |
| 2026 GAAP EPS outlook | at least $19.50 |
| 2026 adjusted EPS outlook | at least $20.50 |
| Projected GAAP net earnings | above $17,650M |
Q3 net earnings of $4,300M (before noncontrolling interests) were covered 1.2 times by cash flow from operations (d). Nine-month returns of about $11.2B (d) are well above one quarter's operating cash flow, so the nine-month cash flow, which is not in my extract, is needed to judge coverage. The outlook of at least $20.50 adjusted compares with a quarterly run-rate of $4.69; annualising Q3 gives about $18.76 (d), so the full-year outlook implies earlier quarters were stronger or the company is guiding conservatively. The prior outlook is not in the release, so I cannot show how much it moved.
Why it matters. Cash conversion of 1.2 times net earnings is healthy, and the capital return is large relative to a quarter's cash flow. Debt-to-capital rose a little, so the returns are not coming with deleveraging.
Source: UnitedHealth 8-K. Derived figures marked (d).
Valuation Snapshot
I have no UnitedHealth share price in my sources, so no multiples are calculated. The earnings base is guided adjusted EPS of at least $20.50.
| Measure | Value |
|---|---|
| 2026 adjusted EPS outlook | at least $20.50 |
| Q3 adjusted EPS | $4.69 |
| Medical care ratio | 88.4% |
| Debt-to-capital | 41.7% |
What has to be true. For the margin to hold, the medical care ratio must stay near 88% on a smaller base of risk-based members, and cost trends must not accelerate.
Risks: What Would Break The Thesis
- Medical cost trend. A small rise in the medical care ratio is large in dollars.
- Shrinking base. Risk-based membership is down about 10% in key lines.
- Missing prior guidance. The release does not show the earlier outlook.
- Reserves. Prior-period reserve development is not in my extract.
- Leverage. Debt-to-capital rose 0.5 points in the quarter.
The reading would be wrong if the member losses prove involuntary and the medical care ratio rises on the remaining mix.
What To Watch Next
- Fourth-quarter medical care ratio against 88.4%.
- Membership in Medicare Advantage and Medicaid against 7,605K and 6,695K.
- Reserve development in the 10-Q.
- Optum margin against 5.6%.
- Debt-to-capital against 41.7%.
- Delivery of the at least $20.50 adjusted EPS outlook.

Sandeep Gupta
Independent equity research analyst publishing forensic theses on US-listed stocks. MBA, Politecnico di Milano School of Management (Milan, Italy).
Get new research in your inbox
Subscribe to receive forensic equity research the moment it's published. Free, no spam.
Related Research

Latest earnings releases: UNH
— earningsrelease3q26unh 1 UnitedHealth Group Reports Third Quarter 2026 Results
Discussion
Be the first to comment.