
Investment Thesis
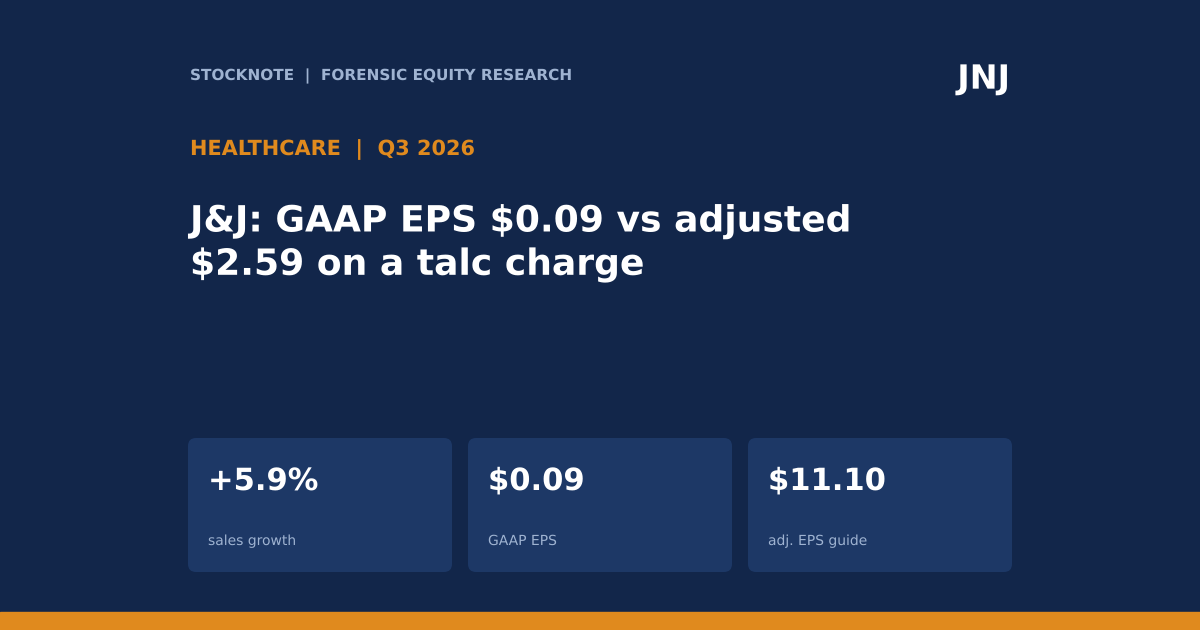
Johnson & Johnson reported third-quarter 2026 sales of $25,399 million, up 5.9%, and raised its full-year guidance. The earnings lines tell two different stories. GAAP net earnings were only $210 million ($0.09 a share) against $5,152 million ($2.12) a year earlier, reflecting a special charge for the proposed talc litigation resolution plus charges for the Firefly Bio acquisition and the Sail Biomedicines collaboration. Adjusted net earnings were $6,339 million ($2.59), down 7.5% per share. The gap between the two, $6,129 million (d), is 97% (d) of adjusted earnings. The release does not give dollar amounts for the talc charge or the other items.
- Sales. $25,399M (+5.9%; operational +6.0%); US $14,959M (+9.1%); international $10,440M (+1.5%).
- Segments. Innovative Medicine $16,757M (+7.7%); MedTech $8,642M (+2.5%). STELARA is cited as a headwind of about 690 basis points.
- Earnings. GAAP net earnings $210M (-95.9%); adjusted net earnings $6,339M (-6.8%); GAAP EPS $0.09; adjusted EPS $2.59 (-7.5%).
- Cash. Free cash flow of about $15.1B year to date (estimate as of October 13) against $14.2B a year earlier.
- Guidance. 2026 reported sales $101.0B to $101.4B (midpoint $101.2B, +7.4%); adjusted EPS $11.05 to $11.15 (midpoint $11.10, +2.9%), up from a $11.04 midpoint in July.
- This article contains no rating, price target or investment advice. Derived figures are marked (d).
Bottom line. The operating business grew sales 6% and is guided to grow adjusted EPS about 3% for the year, with growth concentrated in the US and in Innovative Medicine. The GAAP figure is dominated by litigation and deal charges whose size is not in the release. A reader who uses either EPS number alone gets the wrong picture: adjusted EPS excludes real costs, and GAAP EPS this quarter is mostly one-off.
Source: Johnson & Johnson Q3 2026 8-K.
Q3 2026 At A Glance
| Metric | Q3 2026 | Q3 2025 | Change |
|---|---|---|---|
| Worldwide sales ($M) | 25,399 | 23,993 | +5.9% |
| US sales ($M) | 14,959 | 13,708 | +9.1% |
| International sales ($M) | 10,440 | 10,285 | +1.5% |
| Innovative Medicine ($M) | 16,757 | 15,563 | +7.7% |
| MedTech ($M) | 8,642 | 8,430 | +2.5% |
| GAAP net earnings ($M) | 210 | 5,152 | -95.9% |
| Adjusted net earnings ($M) | 6,339 | 6,801 | -6.8% |
| GAAP / adjusted EPS | $0.09 / $2.59 | $2.12 / $2.80 | -95.8% / -7.5% |
Source: J&J 8-K.
What The Market Believes vs. What The Data Actually Shows
| Belief | What the data show |
|---|---|
| Sales growth shows broad strength | The US supplied $1,251M (d) of the $1,406M (d) increase, or 89% (d); international added only $155M (d). |
| Adjusted EPS is growing | Adjusted EPS was $2.59 against $2.80, down 7.5%, even though full-year guidance is up 2.9% at the midpoint. |
| MedTech is a second growth engine | MedTech grew 2.5% and added $212M (d) of sales, against $1,194M (d) for Innovative Medicine. |
| GAAP EPS of $0.09 shows deteriorating profits | The adjusted figure was $2.59; the $6,129M (d) gap is mostly a talc litigation charge and deal costs not itemised in the release. |
| Guidance raise is large | The adjusted EPS midpoint rose $0.06 (d) and the reported sales midpoint $0.1B (d). |
Forensic #1: Where The Growth Came From
| Sales, $M | Q3 2026 | Q3 2025 | Increase (d) | Share of increase (d) |
|---|---|---|---|---|
| US | 14,959 | 13,708 | 1,251 | 89% |
| International | 10,440 | 10,285 | 155 | 11% |
| Innovative Medicine | 16,757 | 15,563 | 1,194 | 85% |
| MedTech | 8,642 | 8,430 | 212 | 15% |
| Total | 25,399 | 23,993 | 1,406 | 100% |
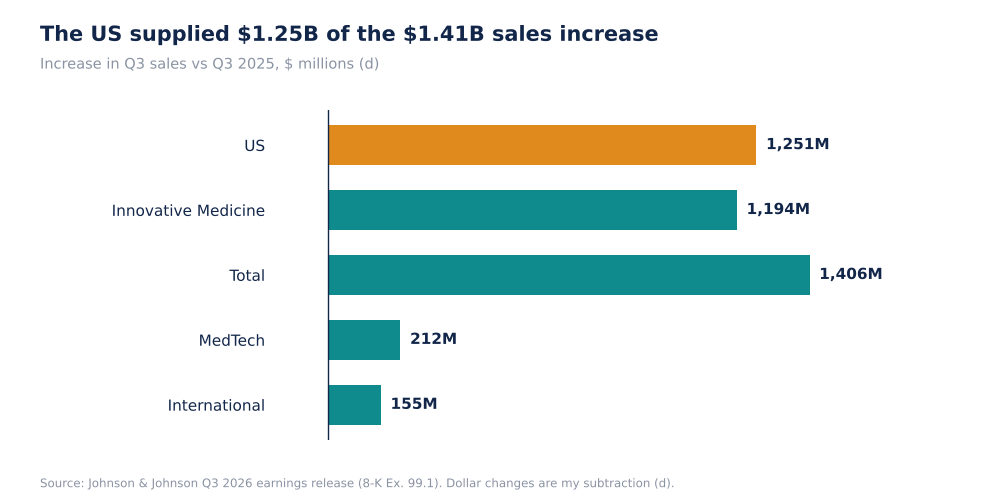
Increase In J&J Sales By Region And Segment, $M (Self-Made, d)
The two cuts of the same $1,406 million total are consistent: US plus international and Innovative Medicine plus MedTech each sum to the total (d). The US supplies 89% of the increase and Innovative Medicine 85% (d). The release names TREMFYA, DARZALEX, CARVYKTI, TECVAYLI, RYBREVANT/LAZCLUZE, ERLEADA, SPRAVATO and CAPLYTA as drivers in Innovative Medicine, and electrophysiology, Shockwave, contact lenses and trauma in MedTech, but gives no sales by product. STELARA, SIMPONI, REMICADE, OPSUMIT/OPSYNVI and IMBRUVICA are headwinds.
Why it matters. If the 690-basis-point STELARA headwind applies to Innovative Medicine growth, as the wording suggests, growth excluding it would be about 14.8% (d); I cannot confirm the base from the release. That is the size of the loss of exclusivity the newer products are replacing.
Source: J&J 8-K. Dollar changes and shares are my arithmetic (d).
Forensic #2: Growth Rates By Region And Segment
| Q3 2026 growth | Reported | Operational |
|---|---|---|
| Worldwide | +5.9% | +6.0% |
| US | +9.1% | +9.1% |
| International | +1.5% | +1.8% |
| Innovative Medicine | +7.7% | +7.9% |
| MedTech | +2.5% | +2.5% |
| Currency effect, worldwide | -0.1% |
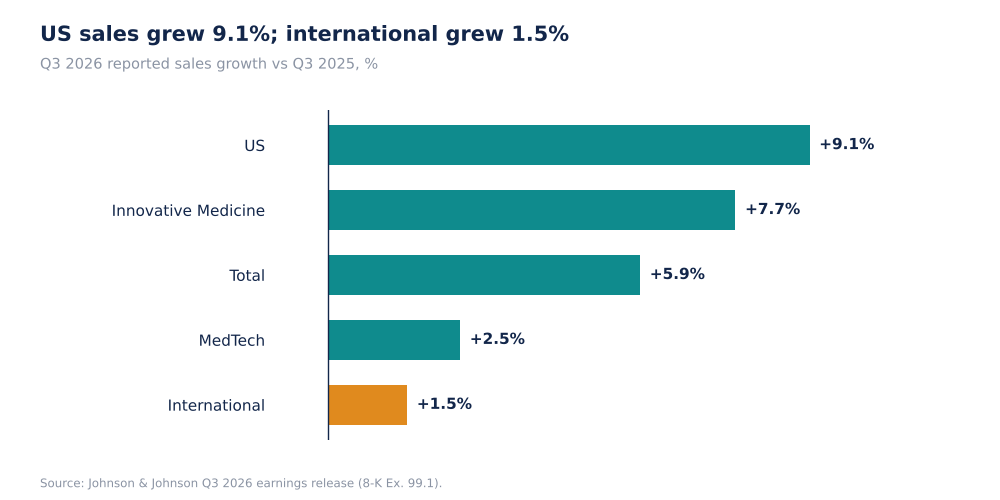
J&J Q3 2026 Reported Sales Growth By Region And Segment (Self-Made, Company Data)
Currency barely matters: reported and operational growth differ by 0.1 point worldwide. International growth of 1.5% (1.8% operational) is a gap of 7.6 points (d) to the US. The extract does not explain it; the headwind products are not split by region.
Why it matters. A company that grows 9% in one region and 1.5% in the other is exposed to US pricing and policy more than the 5.9% headline suggests.
Source: J&J 8-K.
Forensic #3: GAAP Versus Adjusted
| Q3 | GAAP | Adjusted | Gap (d) | GAAP / adjusted (d) |
|---|---|---|---|---|
| Net earnings 2026 ($M) | 210 | 6,339 | 6,129 | 3.3% |
| Net earnings 2025 ($M) | 5,152 | 6,801 | 1,649 | 76% |
| EPS 2026 | $0.09 | $2.59 | $2.50 | 3.5% |
| EPS 2025 | $2.12 | $2.80 | $0.68 | 76% |
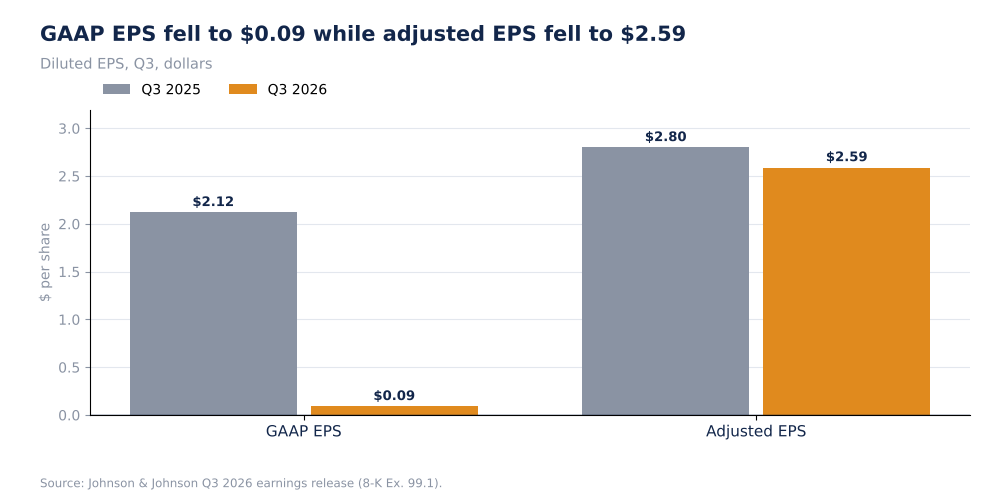
J&J GAAP Vs Adjusted EPS, Q3 2025 Vs Q3 2026 (Self-Made, Company Data)
Adjusted earnings exclude amortization of intangibles and special items. Even a year earlier the gap was $1,649M (d), or 24% (d) of adjusted earnings, so excluded items are a regular part of the model. This quarter the gap rose to $6,129M (d), 3.7 times (d) last year's. The talc charge is described as a one-time special charge for a proposed resolution; whether it settles the matter is not stated.
Why it matters. Cash costs of a litigation resolution are paid over time, so the charge becomes cash outflow in future years. The size is not disclosed here, so it cannot be netted against the $15.1B of free cash flow.
Source: J&J 8-K. Gaps and ratios are my arithmetic (d).
Forensic #4: Guidance Versus The Quarter
| 2026 guidance midpoint | July 29 | October | Change (d) |
|---|---|---|---|
| Reported sales | $101.1B | $101.2B | +$0.1B |
| Operational sales growth | 6.8% | 6.9% | +0.1 pt |
| Adjusted operational sales growth | 6.5% | 6.6% | +0.1 pt |
| Adjusted operational EPS | $10.94 | $11.00 | +$0.06 |
| Adjusted EPS | $11.04 | $11.10 | +$0.06 |
| Adjusted EPS growth | 2.3% | 2.9% | +0.6 pt |
Guidance was nudged up even though third-quarter adjusted EPS fell 7.5%. The release does not give first-half or nine-month adjusted EPS, so I cannot work out the implied fourth quarter. Back-solving from the 2.9% guided growth, the prior-year adjusted EPS base is about $10.79 (d). Year-to-date free cash flow of about $15.1B is 6% (d) above $14.2B last year, an estimate as of October 13 and not a reported figure.
Why it matters. The guidance moves are small; the information is in the direction, which says management sees the full year slightly better than in July despite the weaker quarter.
Source: J&J 8-K. Implied base is my arithmetic (d).
Valuation Snapshot
I have no J&J share price in my sources, so no multiples are calculated. The earnings base is guided adjusted EPS of $11.05 to $11.15.
| Measure | Value |
|---|---|
| 2026 adjusted EPS guidance (midpoint) | $11.10 |
| 2026 reported sales guidance (midpoint) | $101.2B |
| Free cash flow, year to date (estimate) | about $15.1B |
| Euro rate assumption | $1.15 |
What has to be true. For adjusted EPS growth to reach 2.9% for the year while Q3 fell 7.5%, the other quarters must have grown; the release does not provide them.
Risks: What Would Break The Thesis
- Undisclosed charge. The talc and deal amounts are not in the release.
- STELARA erosion. A headwind of about 690 basis points.
- International weakness. +1.5% in the quarter.
- MedTech growth. +2.5% is below the company's average.
- Free cash flow is an estimate as of October 13.
The reading would be wrong if the talc resolution is not completed or if its eventual cost exceeds what the charge implies.
What To Watch Next
- The 10-Q for the size of the talc and deal charges.
- Fourth-quarter adjusted EPS against the guidance range.
- US versus international growth.
- STELARA erosion against new product growth.
- MedTech growth against 2.5%.
- Cash payments related to the talc resolution.

Sandeep Gupta
Independent equity research analyst publishing forensic theses on US-listed stocks. MBA, Politecnico di Milano School of Management (Milan, Italy).
Get new research in your inbox
Subscribe to receive forensic equity research the moment it's published. Free, no spam.
Related Research
Latest earnings releases: JNJ
— Johnson & Johnson reports Q3 2026 results, raises 2026 guidance
Discussion
Be the first to comment.