
Investment Thesis
Abbott's third-quarter 2026 sales were $13,013 million, up 14.5% as reported but up only 7.0% on a comparable basis. The 7.5-point gap (d) is almost entirely in Diagnostics, which rose 46.7% reported and 6.4% comparable. The earnings lines diverge in the same way: GAAP diluted EPS was $0.53 against $0.94, while adjusted EPS was $1.42 against $1.30, up 9.2%. GAAP operating earnings fell 34% to $1,358 million (10.4% of sales, from 18.1%), while adjusted gross margin rose to 57.2% from 55.8%. Full-year guidance was reaffirmed at about 6.0% comparable growth and adjusted EPS of $5.50 to $5.55.
- Sales. $13,013M (+14.5% reported, +7.0% comparable). Medical Devices $5,826M (+6.9% / +7.8% comparable); Diagnostics $3,305M (+46.7% / +6.4%); Nutrition $2,262M (+5.1% / +4.9%); Established Pharmaceuticals $1,614M (+6.8% / +8.4%).
- Margins. GAAP gross margin 50.3% (year-ago 51.7%); adjusted gross margin 57.2% (55.8%); GAAP operating margin 10.4% (18.1%).
- Earnings. GAAP net earnings $920M ($1,644M); net earnings excluding specified items $2,477M ($2,278M); GAAP EPS $0.53 ($0.94); adjusted EPS $1.42 ($1.30).
- Costs. GAAP SG&A $4,266M (+39.8%); adjusted SG&A $3,505M ($3,004M); GAAP R&D $920M (+20.1%).
- Guidance. Full-year comparable sales growth about 6.0%; adjusted EPS $5.50 to $5.55; Q4 adjusted EPS $1.62 to $1.67. Quarterly dividend $0.63 (54 consecutive years of increases).
- This article contains no rating, price target or investment advice. Derived figures are marked (d).
Bottom line. Abbott's underlying business grew 7% and adjusted earnings 9%, but GAAP profit was cut by items that the release excludes from adjusted results and the extract does not itemise. The reported 14.5% growth overstates organic momentum by about 7.5 points (d) because of the Diagnostics step-up. The quality question is whether the $1,557M (d) gap between adjusted and GAAP net earnings is acquisition accounting, which is non-cash and declines over time, or recurring cost.
Source: Abbott Laboratories Q3 2026 8-K.
Q3 2026 At A Glance
| $ millions | Q3 2026 | Q3 2025 | Change |
|---|---|---|---|
| Worldwide sales | 13,013 | 11,369 | +14.5% (comparable +7.0%) |
| GAAP gross profit / margin | 6,544 / 50.3% | 5,874 / 51.7% | |
| Adjusted gross profit / margin | 7,448 / 57.2% | 6,344 / 55.8% | |
| GAAP operating earnings / margin | 1,358 / 10.4% | 2,057 / 18.1% | -34.0% |
| GAAP net earnings | 920 | 1,644 | -44.1% |
| Net earnings excl. specified items | 2,477 | 2,278 | +8.7% |
| GAAP / adjusted EPS | $0.53 / $1.42 | $0.94 / $1.30 | -43.6% / +9.2% |
Source: Abbott 8-K. Margins as calculated in the release.
What The Market Believes vs. What The Data Actually Shows
| Belief | What the data show |
|---|---|
| Sales growth of 14.5% shows momentum | Comparable growth was 7.0%; Diagnostics reported +46.7% against +6.4% comparable. |
| Profit is deteriorating | Adjusted EPS rose 9.2% to $1.42; GAAP EPS fell 43.6% to $0.53. The difference is specified items. |
| Margins are falling | GAAP gross margin fell 1.4 points but adjusted gross margin rose 1.4 points; the adjusted operating margin implied by the release's adjusted lines is about 23.4% (d) against 23.0% (d). |
| SG&A is out of control | GAAP SG&A rose 39.8%, but adjusted SG&A rose only 16.7% (d); the difference is $761M (d) of excluded items against $47M (d) a year ago. |
| Diabetes care is the engine | Diabetes Care sales were $2,185M (+6.2% reported); continuous glucose monitors grew 7.3% reported and 7.7% comparable. |
Forensic #1: Reported Versus Comparable Growth
| Q3 2026 | Sales ($M) | Reported | Comparable | Gap (d) | Estimated increase ($M, d) |
|---|---|---|---|---|---|
| Medical Devices | 5,826 | +6.9% | +7.8% | -0.9 pts | 376 |
| Diagnostics | 3,305 | +46.7% | +6.4% | +40.3 pts | 1,052 |
| Nutrition | 2,262 | +5.1% | +4.9% | +0.2 pts | 110 |
| Established Pharma | 1,614 | +6.8% | +8.4% | -1.6 pts | 103 |
| Total | 13,013 | +14.5% | +7.0% | +7.5 pts | 1,644 |
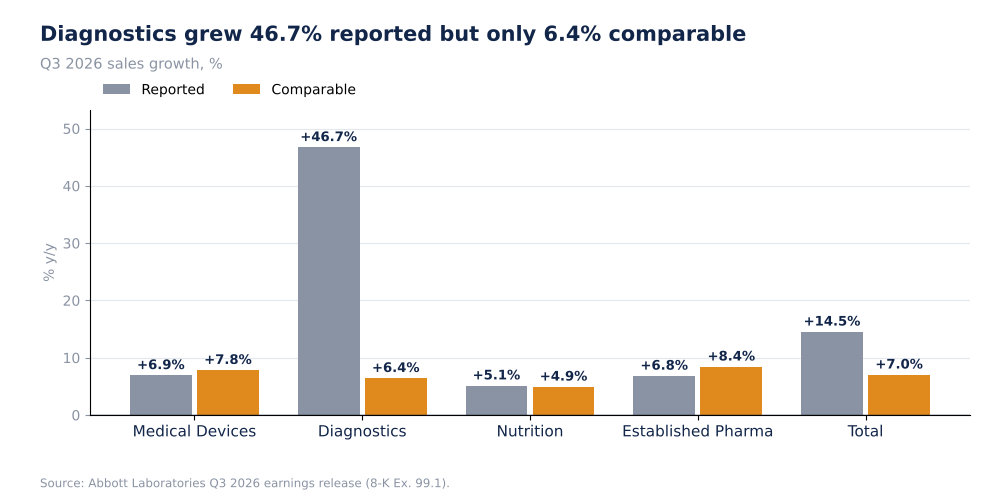
Abbott Reported Versus Comparable Sales Growth, Q3 2026 (Self-Made, Company Data)
Back-solving from the reported growth rates, Diagnostics sales rose by about $1,052M (d), or 64% (d) of the $1,644M total increase, even though its comparable growth was 6.4%. The four segment estimates sum to $1,641M (d), within $3M of the actual increase, which supports the method. The release does not name the cause of the gap in the extract I read; a reported growth rate that far above comparable growth is typical of an acquisition or a change in scope, so I treat the excess as inorganic (my inference).
Why it matters. Comparable growth of 7.0% is the like-for-like number. Reported growth overstates organic momentum by about 7.5 points (d), and any margin or EPS comparison should recognise that the acquired business is included in this year and not last.
Source: Abbott 8-K. Estimated increases are back-solved (d).
Forensic #2: GAAP Versus Adjusted EPS
| $ millions | GAAP | Excluding specified items | Gap (d) | GAAP / adjusted (d) |
|---|---|---|---|---|
| Net earnings 2026 | 920 | 2,477 | 1,557 | 37% |
| Net earnings 2025 | 1,644 | 2,278 | 634 | 72% |
| EPS 2026 | $0.53 | $1.42 | $0.89 | 37% |
| EPS 2025 | $0.94 | $1.30 | $0.36 | 72% |
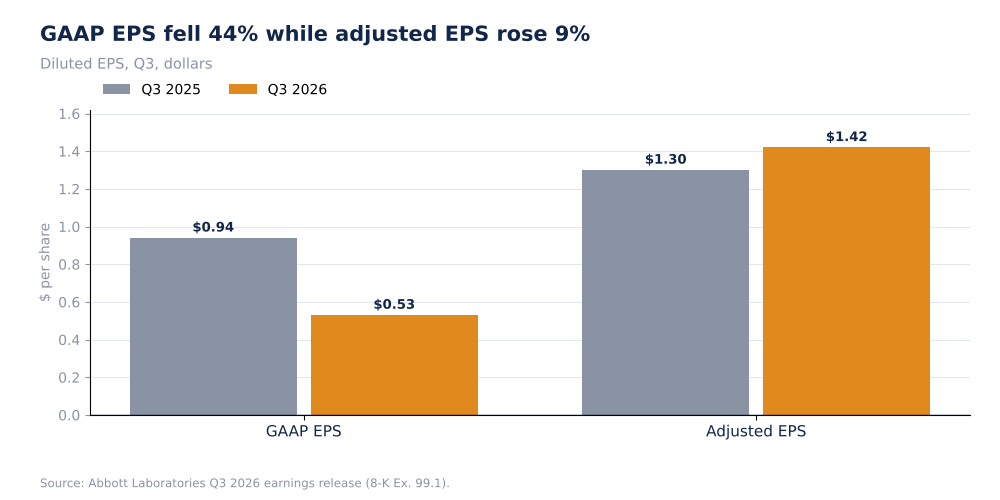
Abbott GAAP Versus Adjusted EPS, Q3 2025 Vs Q3 2026 (Self-Made, Company Data)
The gap between adjusted and GAAP net earnings rose from $634M (d) to $1,557M (d), 2.5 times (d), so the excluded items are growing. The line items give some localisation: the gross profit difference between adjusted and GAAP was $904M (d) against $470M (d), and the SG&A difference $761M (d) against $47M (d). Together they explain $1,665M (d) of the $1,557M net earnings gap before tax; the extract does not itemise the rest. A rise in both cost of sales and SG&A exclusions is consistent with acquisition accounting (amortisation of acquired intangibles and integration costs), but the release extract does not say.
Why it matters. If the exclusions are acquisition amortisation they are non-cash and decline over time; if they include restructuring or litigation they recur. The distinction changes how much of the $0.89 gap (d) belongs in a valuation.
Source: Abbott 8-K. Gaps and ratios are my arithmetic (d).
Forensic #3: Margins
| % of sales (d) | Q3 2026 | Q3 2025 |
|---|---|---|
| GAAP gross margin | 50.3% | 51.7% |
| Adjusted gross margin | 57.2% | 55.8% |
| GAAP operating margin | 10.4% | 18.1% |
| Adjusted operating margin (adjusted gross profit less adjusted R&D and SG&A) (d) | 23.4% | 23.0% |
| Adjusted SG&A / sales (d) | 26.9% | 26.4% |
| GAAP SG&A / sales (d) | 32.8% | 26.8% |
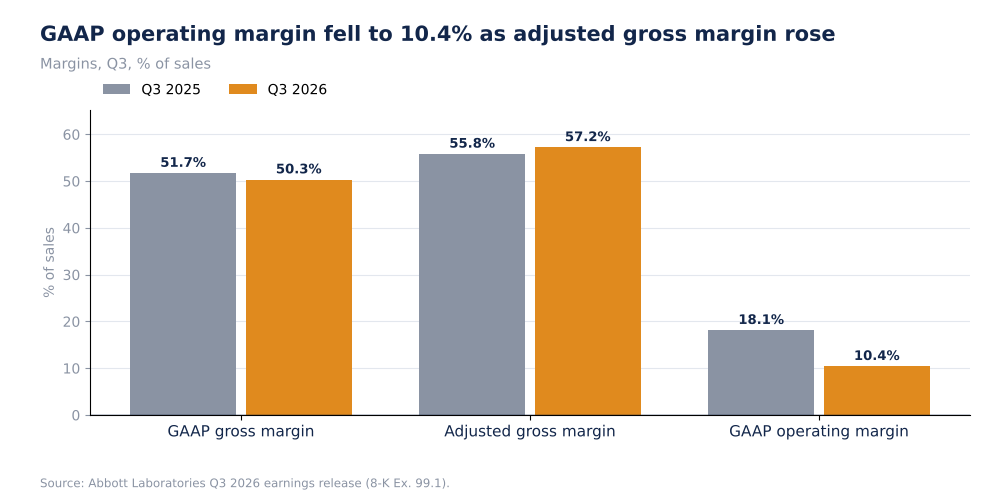
Abbott GAAP And Adjusted Margins, Q3 2025 Vs Q3 2026 (Self-Made, Company Data)
On adjusted lines, operating margin was about 23.4% against 23.0% (d), an improvement of 0.5 points: adjusted gross margin gained 1.4 points while adjusted SG&A and R&D as a share of sales were roughly flat. This calculation assumes there are no other operating items, which the extract does not confirm. GAAP operating margin fell 7.7 points (d) because GAAP SG&A rose to 32.8% of sales from 26.8%.
Why it matters. The operating business appears to be earning slightly better margins on an adjusted basis, while the reported margin is 7.7 points lower. The truth for shareholders is between them, depending on how recurring the excluded items are.
Source: Abbott 8-K. Margin lines marked (d) are my arithmetic.
Forensic #4: Guidance And What It Implies
| 2026 guidance | Value |
|---|---|
| Comparable sales growth | about 6.0% |
| Adjusted diluted EPS | $5.50 to $5.55 (range tightened, midpoint reaffirmed) |
| Q4 adjusted diluted EPS | $1.62 to $1.67 |
| Implied nine-month adjusted EPS (d) | about $3.88 (full-year midpoint less Q4 midpoint) |
| Q4 midpoint vs Q3 adjusted EPS (d) | +16% ($1.645 vs $1.42) |
The Q4 guide of $1.62 to $1.67 is 16% (d) above Q3's $1.42, so the full-year range needs a stronger fourth quarter. The implied nine-month figure of about $3.88 (d) is a back-solve and not a reported number. Comparable growth of about 6.0% for the year compares with 7.0% in Q3, which is above the full-year guide, so Q4 comparable growth would need to be lower than Q3's or earlier quarters were weaker; the extract does not have the first half.
Why it matters. A tightened range with a higher fourth quarter means management has more visibility, but the step-up from $1.42 to about $1.645 is the number to test.
Source: Abbott 8-K. Implied figures marked (d).
Valuation Snapshot
I have no Abbott share price in my sources, so no multiples are calculated. The earnings base is guided adjusted EPS of $5.50 to $5.55 and a quarterly dividend of $0.63 ($2.52 annualised, d).
| Measure | Value |
|---|---|
| Adjusted EPS guide (midpoint) | $5.525 (d) |
| Annualised dividend (d) | $2.52 |
| Dividend / adjusted EPS guide (d) | 46% |
| Consecutive years of dividend increases | 54 |
What has to be true. For the guide to hold, Q4 adjusted EPS must reach about $1.62 to $1.67, and the excluded items must prove non-recurring or non-cash.
Risks: What Would Break The Thesis
- Unitemised exclusions. The $1,557M net earnings gap is not itemised in my extract.
- Inorganic growth. Diagnostics reported growth is far above comparable.
- Cash flow missing. The extract has no cash flow.
- Back-solved figures. Estimated segment increases rely on rounded percentages.
- Q4 step-up. The guide needs a stronger fourth quarter.
The reading would be wrong if the excluded items are recurring cash costs, or if the Diagnostics gap is something other than acquisition accounting.
What To Watch Next
- Abbott's 10-Q for the itemised specified items.
- Fourth-quarter adjusted EPS against $1.62 to $1.67.
- Comparable growth in Diagnostics against 6.4%.
- Medical Devices comparable growth against 7.8%.
- Continuous glucose monitor growth against 7.7% comparable.
- GAAP operating margin against 10.4%.

Sandeep Gupta
Independent equity research analyst publishing forensic theses on US-listed stocks. MBA, Politecnico di Milano School of Management (Milan, Italy).
Get new research in your inbox
Subscribe to receive forensic equity research the moment it's published. Free, no spam.
Related Research
Latest earnings releases: ABT
— Abbott Reports Third-Quarter 2026 Results and Reaffirms Full-Year EPS Guidance
Discussion
Be the first to comment.